Publisher’s version / Version de l'éditeur: Technical Report, 2010
READ THESE TERMS AND CONDITIONS CAREFULLY BEFORE USING THIS WEBSITE.
https://nrc-publications.canada.ca/eng/copyright
Vous avez des questions? Nous pouvons vous aider. Pour communiquer directement avec un auteur, consultez la
première page de la revue dans laquelle son article a été publié afin de trouver ses coordonnées. Si vous n’arrivez pas à les repérer, communiquez avec nous à [email protected].
Questions? Contact the NRC Publications Archive team at
[email protected]. If you wish to email the authors directly, please see the first page of the publication for their contact information.
NRC Publications Archive
Archives des publications du CNRC
For the publisher’s version, please access the DOI link below./ Pour consulter la version de l’éditeur, utilisez le lien DOI ci-dessous.
https://doi.org/10.4224/17210693
Access and use of this website and the material on it are subject to the Terms and Conditions set forth at
Hydraulic Ram Impact Tests on Laminate Panels
Kennedy, Allison
https://publications-cnrc.canada.ca/fra/droits
L’accès à ce site Web et l’utilisation de son contenu sont assujettis aux conditions présentées dans le site LISEZ CES CONDITIONS ATTENTIVEMENT AVANT D’UTILISER CE SITE WEB.
NRC Publications Record / Notice d'Archives des publications de CNRC:
https://nrc-publications.canada.ca/eng/view/object/?id=ddd13fef-dfe9-4a6a-9a7a-bbad5a0e8e4d https://publications-cnrc.canada.ca/fra/voir/objet/?id=ddd13fef-dfe9-4a6a-9a7a-bbad5a0e8e4d
DOCUMENTATION PAGE
REPORT NUMBER
TR-2010-16
NRC REPORT NUMBER DATE
August 2010
REPORT SECURITY CLASSIFICATION
Unclassified
DISTRIBUTION
Unlimited
TITLE
HYDRAULIC RAM IMPACT TESTS ON LAMINATE PANELS
AUTHOR (S)
Allison Kennedy
CORPORATE AUTHOR (S)/PERFORMING AGENCY (S)
Institute for Ocean Technology, National Research Council, St. John’s, NL
PUBLICATION
SPONSORING AGENCY(S)
Institute for Ocean Technology, National Research Council, St. John’s, NL
IOT PROJECT NUMBER
PJ 2258
NRC FILE NUMBER
KEY WORDS
Laminate, Lifeboat, Impact, Strength.
PAGES iv, 16 FIGS. 13 TABLES SUMMARY
The hydraulic ram tests were structural tests in which fibreglass specimens were impacted with a steel ram head until puncture occurred. The fiberglass test specimens are
representative of the hull material of a conventional lifeboat. Various sized fibreglass panels at both cold and warm temperatures were impacted. The purpose of the tests was to
determine the limiting loads of lifeboat hull material and to establish the effect of panel size and temperature. The results of these tests can lead to the determination of an
optimal panel size for a lifeboat operating in ice.
ADDRESS National Research Council
Institute for Ocean Technology Arctic Avenue, P. O. Box 12093 St. John's, NL A1B 3T5
National Research Council Conseil national de recherches Canada Canada Institute for Ocean Institut des technologies Technology océaniques
HYDRAULIC RAM IMPACT TESTS ON LAMINATE PANELS
TR-2010-16Allison Kennedy
TABLE OF CONTENTS
List of Figures ... iv
1.0 INTRODUCTION ... 1
2.0 DATA ACQUISITION SYSTEM ... 2
3.0 EXPERIMENTAL ERROR... 2
4.0 2008 HYDRAULIC RAM TESTS ... 3
4.1. Room Temperature 18”x18” Panel... 3
4.2. Chilled 18”x18” Panel ... 5
4.3. Data Analysis ... 6
4.4. Lessons Learned... 7
5.0 2009 HYDRAULIC RAM TESTS ... 7
5.1. Test Plan... 8
5.2. Test Results... 8
5.3. Deformation Pattern... 9
5.4. Data Analysis ... 10
6.0 COMPARISON OF 2008 AND 2009 TESTS... 13
7.0 CONCLUSIONS... 16
LIST OF FIGURES
Figure 1: Hydraulic Ram Test Set Up... 1
Figure 2: Underneath Video Camera Set Up ... 2
Figure 3: 18” ×18” Panel Test Setup ... 3
Figure 4: Room Temperature 18”×18” Panel After Impact... 4
Figure 5: Room Temperature 18”×18” Panel Damage Pattern ... 4
Figure 6: Chilled Panel After Impact... 5
Figure 7: 2008 Hydraulic Ram Results... 6
Figure 8: 18” and 30” Deformation Patterns ... 10
Figure 9: 24”, 26” and 28” Panel Results ... 11
Figure 10: 2009 Hydraulic Ram Results... 12
Figure 11: Comparison of 2008 and 2009 Test Deformation Pattern... 13
Figure 12: Comparison of 2008 and 2009 Test Underside Camera... 14
HYDRAULIC RAM IMPACT TESTS ON LAMINATE PANELS
1.0 INTRODUCTION
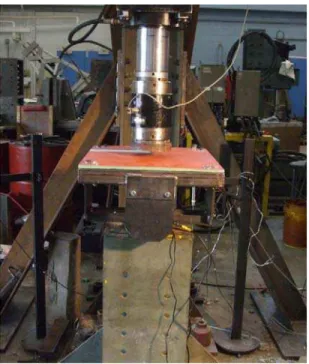
The hydraulic ram tests were structural tests in which a fibreglass specimen was impacted with a steel ram head until puncture occurred. Various sized fibreglass panels at both cold and warm temperatures were impacted. During hydraulic ram testing the ram head was moved at a constant speed of approximately 0.054 m/s. The purpose of the tests was to determine the limiting loads of lifeboat hull material and to establish the effect of panel size and temperature. The results of these tests can lead to the determination of an optimal panel size for a lifeboat operating in ice. During testing, the fibreglass panels were held in position by a metal frame that could be extended in two directions to accommodate a range of panel sizes. Below is an illustration of the test set up.
Figure 1: Hydraulic Ram Test Set Up
The majority of the test panels were fabricated to represent lifeboat laminate. There was laminate material available for testing which came from an out of use lifeboat. However, there was only enough of this material to fabricate two 18”×18” panels. All panels were approximately ¼” thick which corresponds to a conventional lifeboat hull thickness. Each fibreglass panel tested was marked with a 1”×1” grid on the interior side of the panel. The “interior” side represented the panel side without gel coat as this is the side of the panel that would be facing to the interior of the lifeboat. The purpose of this grid was to enable a comparison of damage pattern after testing.
2.0 DATA ACQUISITION SYSTEM
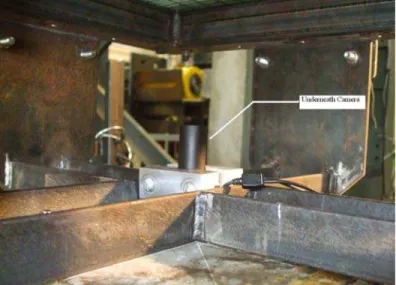
The data acquisition system for the hydraulic ram tests included three video cameras and a dynamometer, which was contained within the hydraulic ram itself. The dynamometer measured both the impact force and the deflection of the panel. One camera was positioned on the side of the panel and lights were arranged so that clear pictures could be obtained of the experiments. A second video camera was positioned in front of the panel viewing both the hydraulic ram and the panel, while a third small video camera was
positioned underneath the panel to obtain an underside view of the deformation. The
following figure illustrates the underneath camera set up. As can be seen from this picture, the base of the frame held the camera steady.
Figure 2: Underneath Video Camera Set Up
The hydraulic ram recorded force in the unit of kilo-pound and displacement in the unit of millimetre. It measured the force and displacement at a frequency of 20 Hz. The hydraulic ram was connected electronically to a personal computer which stored the measured force and displacement values in comma separated variables files.
3.0 EXPERIMENTAL ERROR
The hydraulic ram tests contained a number of uncertainty elements contributing to the values of the measured data. An uncertainty analysis was completed to define the interval of uncertainty surrounding each measured variable.
There are two main types of error: precision and bias error. Precision error deals with the error involved in repetition of experimentation. There were no repeated tests completed in the hydraulic ram tests and therefore this term was ignored. Bias error is a fixed component of error which is the same for any experiment completed, that is, it does not vary from test to test. The bias error was defined and included in the results of the hydraulic ram test findings.
There were two values measured: force and displacement. The force was measured by a 146 kilo pound load cell and the displacement was measured by a 10 inch LVDT. The rating of each device corresponds to the upper limit of measurement. The uncertainty involved in the displacement measurement was found in the 2009 MTS Services and Accessories catalogue. This listed the typical manufacturer’s uncertainty in a linear LVDT as 2%. The uncertainty in force measurement was found from load cell specifications from Nova Tech Load Cells. The typical uncertainty involved in load cells calibrated hydraulically was listed as 1% over the entire load cell range. Error bars were added to the results of hydraulic ram testing to indicate the error range in displacement and force measurement.
4.0 2008 HYDRAULIC RAM TESTS
Hydraulic ram tests were conducted in July 2008 with two 18”×18” laminate panels. These panels came from the hull of a conventional lifeboat. A goal of the 2008 tests was to determine the yield and ultimate force limit of lifeboat laminate panels. The other experimental goal was to gain a better understanding of the test process and parameters. The execution and analysis of these tests resulted in improvement of 2009 testing.
4.1. Room Temperature 18”x18” Panel
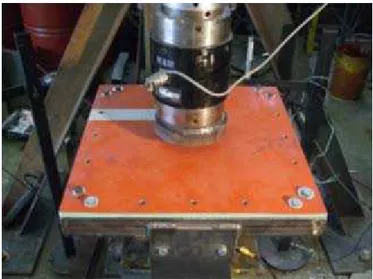
The first test was conducted on an 18”×18” room temperature fibreglass lifeboat panel. The room temperature at the test facility was measured prior to testing and was found to
be 20 oC. The panel was bolted on each of the four corners to the hollow metal frame.
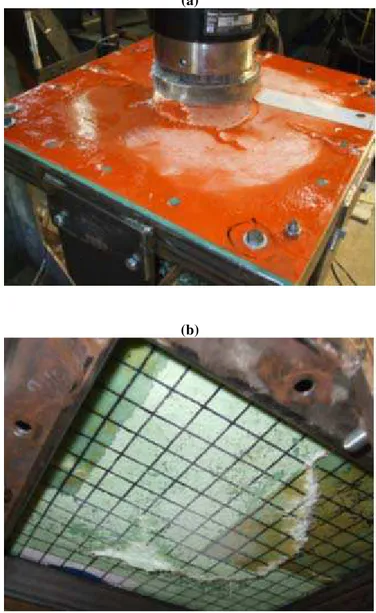
This simulated clamped end conditions on the panel. The flat, circular impact head was driven into the centre of the fibreglass panel with increasing force until it punctured the panel. The figure below demonstrates the set up for this test.
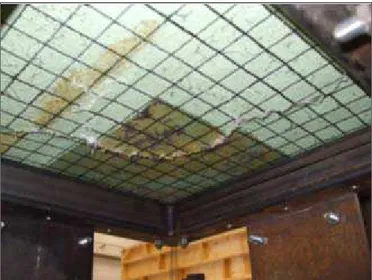
The panel was oriented in such a way that the circular impact head hit it in the centre at a 90-degree angle. The panel frame support was bolted onto the ground so that it did not move or shake upon impact. The panels were marked, North, South, East and West on the corresponding sides so that the damage of all panels could be compared at the impacted orientation. Below is a figure demonstrating the panel after impact.
Figure 4: Room Temperature 18”×18” Panel After Impact
The results from the hydraulic ram showed a peak force of approximately 74 kN and a maximum displacement of around 32 mm. The puncture in the material occurred around the perimeter of the impact head and then moved out towards the edge. This was observed in detail from bottom photographs of the deformed panel. The picture below represents the damage pattern.
Figure 5: Room Temperature 18”×18” Panel Damage Pattern
Figure 5 indicates that the damage is in a circular pattern, which outlines the impact head and extends outwards in two directions towards the panel sides.
4.2. Chilled 18”x18” Panel
The second hydraulic ram test was conducted on a lifeboat panel similar to the first but
chilled to approximately –20oC. The panel was chilled to represent the lifeboat panel
operating in cold conditions. The set up was the same, with the panel centred such that the impact head struck in the center. The results of this impact showed a maximum force of approximately 75 kN and a maximum displacement of 42.4 mm. The maximum force value was close to the room temperature panel; however the chilled panel had a significantly larger maximum displacement. Pictures of the deformed panel are shown below.
(a)
(b)
Figure 6: Chilled Panel After Impact
The deformation patterns of both room temperature and chilled panels were quite similar. Both patterns outlined the circular impact head and lead out towards the panel sides.
4.3. Data Analysis
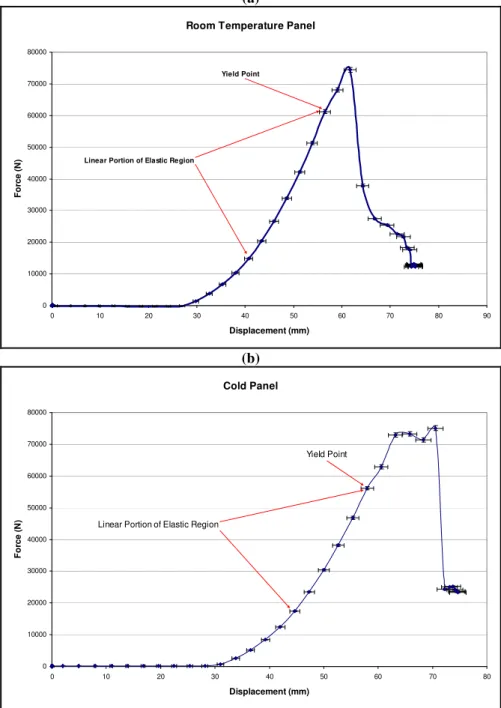
The results of both hydraulic ram tests were plotted as force versus deflection curves. The puncture energy was determined by finding the area under these curves, which was completed using integration. The puncture energy is the amount of energy the panel absorbs up until fracture. The force versus displacement plots for the cold and room temperature panels are shown below.
(a)
Room Temperature Panel
0 10000 20000 30000 40000 50000 60000 70000 80000 0 10 20 30 40 50 60 70 80 9 Displacement (mm) For c e ( N ) 0 Yield Point
Linear Portion of Elastic Region
(b) Cold Panel 0 10000 20000 30000 40000 50000 60000 70000 80000 0 10 20 30 40 50 60 70 8 Displacement (mm) For c e ( N
) Linear Portion of Elastic Region
0 Yield Point
Data analysis showed that the room temperature panel had puncture energy of approximately 1000 J while the chilled panel had puncture energy of approximately 1500 J. Despite the fact that the maximum force values for both panels were similar, the amount of energy required to break the panels (work to failure) differed by nearly 500 J. In other words, it took an additional 500 J to puncture the cold panel than it did to puncture the room temperature panel.
The ultimate strength of the panels could be found by dividing the maximum force by the impact area. The impact head of the hydraulic ram was a 3” radius circle. It was assumed that the impacting edge hit at a perfect 90-degree angle leading to a contact area of 0.018
m2. The ultimate strength for the room temperature and chilled panels was found to be
4.13 MPa and 4.17 MPa respectively.
The lifeboat panel stiffness was estimated by determining the slope of the elastic portion of the force versus displacement curve for the chilled laminate panel. Two considerations were made in this analysis. The first considered the linear portion of the elastic region of Figure 7. This resulted in a stiffness value of 2.91 MN/m. The second consideration involved the non-linear portion of the elastic region. The panel stiffness found using this method was 2.06 MN/m. Note that this is the stiffness as defined by the entire elastic range, beginning when the force starts to rise to the yield point. The range in lifeboat laminate stiffness was found to be 2.06 – 2.91 MN/m.
4.4. Lessons Learned
One of the goals of the initial two hydraulic ram tests was to gain a better understanding of the test process and parameters. There were a few interesting points arising from the initial tests that must be considered when preparing for future hydraulic ram tests. The first consideration involved the panel damage pattern. Damage was concentrated and initialized around the perimeter of the impact head. A hemispherical impact head may prevent this from occurring. Another consideration was that the panel moved slightly as it was impacted. The frame must be securely bolted to the floor so that motions do not occur, which can cause errors. The final consideration was that the small underside panel video camera did not cover the entire range of the panel. A camera with a broader range of vision must be used to capture the deformation of the entire panel.
5.0 2009 HYDRAULIC RAM TESTS
A second set of hydraulic ram tests were conducted in July, 2009. These tests were more substantial than the first tests in terms of the number of specimens tested and they incorporated the lessons learned from 2008 testing. The 2009 tests included testing 13 replicated lifeboat laminate panels. The 2009 hydraulic ram tests referred to guidelines outlined in ISO standards.
The ISO standard: ISO 6603-2 entitled Plastics – Determination of puncture impact behaviour of rigid plastics - defines the practice of testing a sample specimen to determine the puncture impact energy. This protocol dictates the sample size to be either
a 60 mm square or a 60 mm diameter circle, both having a thickness of 2 mm. The standard recommends a hemispherical striking head which is to be lubricated with oil or grease prior to each test. The standards were developed for drop tests, in which a steel object is dropped onto a test specimen. The sample size for the 2009 hydraulic ram tests was varied from the ISO recommendation to mimic realistic lifeboat-ice impact situations.
There were some important differences in the arrangement of the 2009 tests that resulted from lessons learned from 2008 testing and recommendations from ISO 6603 – 2. These differences include the following:
1. The hydraulic ram head used was hemispherical in shape with a radius of 7.6 cm (3”).
2. The bolts holding the hydraulic ram base to the cement floor during testing were tightened.
3. The underside camera used was a “fish-eye” type camera capable of capturing the entire underside of the panel.
Another difference in the two test sets was that the 2008 tests were completed on two panels of the same size and varying temperatures. The 2009 tests were completed on panels of differing dimensions but constant room temperature. Finally, the 2009 tests involved the test panels bolted more securely to the test frame. The panels were bolted along each of the four sides as opposed to at each corner alone.
5.1. Test Plan
There were a total of 13 panels tested in the 2009 test sequence. These panels were divided into six different sizes: 18”×18”, 20”×20”, 22”×22”, 24”×24”, 26”×26” and 30”×30.” There were two panels of each size except for the 18”×18” panel. The reasoning behind testing only one 18”×18” panel was due to the limited amount of material for testing, as well as the fact that this size panel had been tested previously in the 2008 tests.
5.2. Test Results
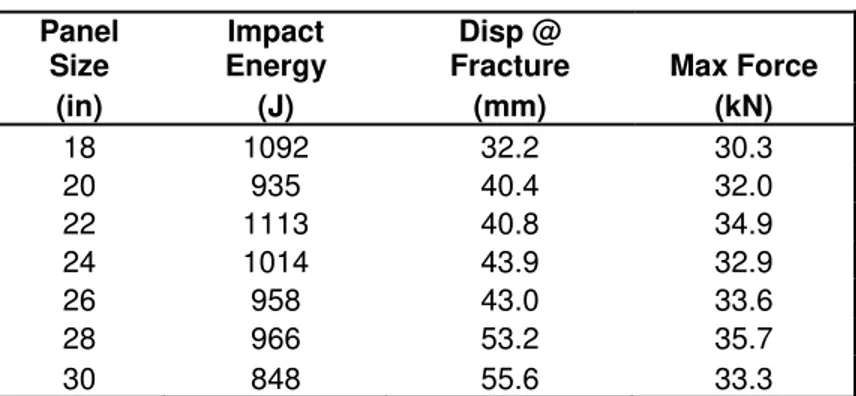
A summary of results, in terms of impact energy, maximum force, and displacement at fracture, for each of the 13 tests, is provided in the table below. The results are indicative of the average values of the two panels tested for each panel size.
Table 1: Summary of 2009 Hydraulic Ram Test Results Panel Size Impact Energy Disp @
Fracture Max Force
(in) (J) (mm) (kN) 18 1092 32.2 30.3 20 935 40.4 32.0 22 1113 40.8 34.9 24 1014 43.9 32.9 26 958 43.0 33.6 28 966 53.2 35.7 30 848 55.6 33.3
The impact energy ranged from 848 to 1113 J, the displacement at fracture ranged from 32.2 mm to 55.6 mm and the peak force ranged from approximately 30.3 kN to 35.7 kN.
5.3. Deformation Pattern
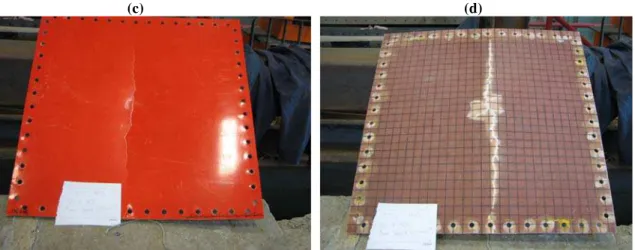
There was a distinct damage pattern difference between the 2009 test specimens in terms of the larger and smaller dimensioned panels. The smaller panels had deformation patterns concentrated in the centre of the panel while the larger panels had deformation patterns that extended to the edges of the panel in almost a straight line. Figure 8(a) and (b) illustrate damage on the front and back of an 18”×18” panel while Figure 8(c) and (d) represent damage on the front and back of a 30”×30” panel.
(a) (b)
(c) (d)
Figure 8: 18” and 30” Deformation Patterns
5.4. Data Analysis
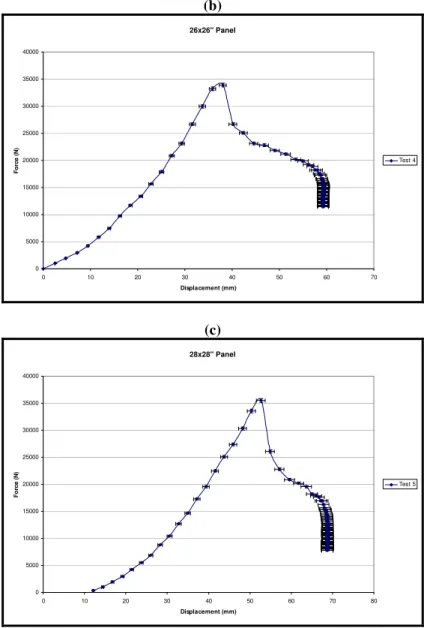
The data for the 2009 hydraulic ram tests were analysed using the same procedure as the 2008 tests. The data from each of the 13 tests was plotted in terms of force versus displacement to get an idea of the maximum force, displacement and impact energy. Three of these curves are shown in Figure 9 to demonstrate the analysis process. The force versus displacement curves for the remaining panel sizes tested in the 2009 hydraulic ram tests are provided in Appendix A.
(a) 24x24" Panel 0 5000 10000 15000 20000 25000 30000 35000 40000 0 10 20 30 40 50 60 70 80 Displacement (mm) Fo rc e ( N ) Test 3
(b) 26x26" Panel 0 5000 10000 15000 20000 25000 30000 35000 40000 0 10 20 30 40 50 60 70 Displacement (mm) Fo rc e ( N ) Test 4 (c) 28x28" Panel 0 5000 10000 15000 20000 25000 30000 35000 40000 0 10 20 30 40 50 60 70 80 Displacement (mm) For c e ( N ) Test 5
Figure 9: 24”, 26” and 28” Panel Results
The results showed that for each panel size the maximum force was around 35 kN and the displacement at maximum force was between 35 mm and 55 mm. The impact energy was found for each of the 13 test specimens using numerical integration.
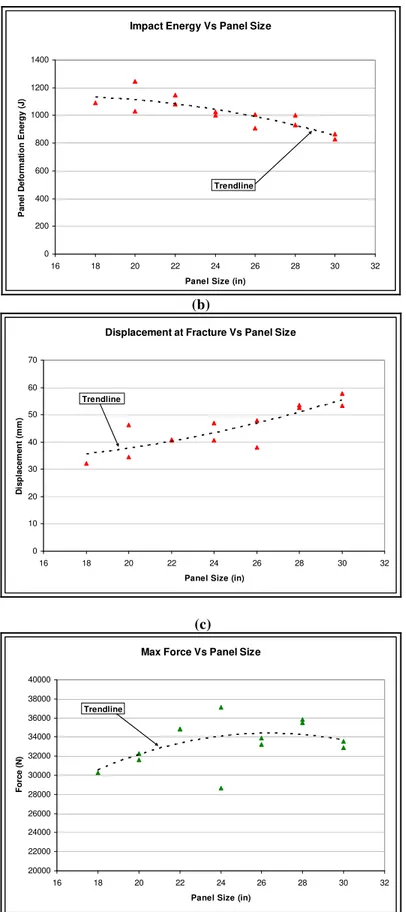
The maximum force, maximum displacement and impact energy were plotted against panel size. These plots are shown in Figure 10 (a), (b) and (c).
Impact Energy Vs Panel Size 0 200 400 600 800 1000 1200 1400 16 18 20 22 24 26 28 30 32
Panel Size (in)
Pa n e l D e fo rm a ti o n En e rg y ( J ) Trendline (b)
Displacement at Fracture Vs Panel Size
0 10 20 30 40 50 60 70 16 18 20 22 24 26 28 30 32
Panel Size (in)
D isp lacem e n t (m m ) Trendline (c)
Max Force Vs Panel Size
20000 22000 24000 26000 28000 30000 32000 34000 36000 38000 40000 16 18 20 22 24 26 28 30 32
Panel Size (in)
F o rce (N ) Trendline
First, consider these three curves in terms of variation in panel size. It is clear that the impact energy as well as the maximum displacement prior to complete fracture were affected by changing panel size. Figure 10(a) indicated that as the panel size increased the impact energy decreased with a variation of approximately 300-400 J between the largest and smallest panels. Figure 10(b) indicated that increasing panel size had the opposite effect on maximum displacement. As the panel size increased the maximum displacement also increased significantly. The impact of varying panel size on the maximum force was less clear as illustrated by Figure 10(c). However, a peak was reached at a panel size of 24” with lower values for smaller and larger panels. The values for maximum force are all in the same range between 28 kN and 38 kN.
6.0 COMPARISON OF 2008 AND 2009 TESTS
There were a number of differences between the results of the 2008 and 2009 tests. Some variation was due to the changes in test set up. Another probable source of variation relates to the different material types tested. The replicated and actual lifeboat material reacted similarly to tensile loading as shown by the results of tensile tests (Kennedy, 2010). Despite the fact that the two materials behaved similarly to tensile loading, they may not have reacted the same to impact loading.
The panel deformation pattern of the 2009 tests was substantially different from the deformation pattern encountered with the 2008 tests. The 2008 test pattern distinctly outlined the impact head while the 2009 test deformation pattern did not appear to be affected by the geometry of the impact head. Figure 11(a) represents the typical deformation pattern observed during the 2008 hydraulic ram tests and Figure 11(b) represents damage from the 2009 tests.
(a) (b)
Figure 11: Comparison of 2008 and 2009 Test Deformation Pattern
The deformation pattern observed in the 2009 tests did not follow the contour of the ram head thus suggesting that the use of a hemispherical impactor was successful.
The underside view of the panel was entirely visible in the 2009 tests as opposed to the partial view in the 2008 tests. The 2009 tests used a different type of camera to capture video underneath the panel. The “fish-eye” camera had the capability to capture a broad area at a short focal distance. Images from the 2008 and 2009 tests are shown below. The picture on the left corresponds to 2008 testing while the photograph on the right illustrates the 2009 testing.
(a) (b)
Figure 12: Comparison of 2008 and 2009 Test Underside Camera
The grid size on the laminate was the same for the 2008 and 2009 tests (1”×1”). In Figure 12(a) only 7”×5” was visible. The full panel size was 18”×18” and therefore the visible section was only a small portion at the centre of the panel. The figure to the right shows the entire underside of the 18” ×18” panel. The image was distorted because the camera used was of the fish-eye type.
There was a large difference in terms of maximum force and displacement values between the 18”×18” room temperature panel tested in the 2008 tests and the same size panel tested in the 2009 tests. However, the impact energy was similar. The force versus displacement plots for the 18”×18” panel in 2008 and 2009 testing are shown below. Notice that the maximum force encountered in the 2008 tests was between 70 kN and 80 kN. When this same panel size was tested in 2009 the maximum force was only around 30 kN. The displacement at maximum force of the 2008 test was approximately double that of the 2009 test with values of approximately 30 mm and 60 mm respectively. Despite the variation in maximum force and displacement the impact energy was similar with values of 1002 J and 1092 J for 2008 and 2009 tests respectively. This was due to the shape of the curve. The amount of deformation between force peak and ultimate panel failure was much greater for the 2009 than the 2008 test.
(a) 18" Panel - 2008 Test 0 10000 20000 30000 40000 50000 60000 70000 80000 0 10 20 30 40 50 60 70 80 9 Displacement (mm) For c e ( N ) 0 Force Peak Ultimate Failure (b) 18" Panel - 2009 Test 0 5000 10000 15000 20000 25000 30000 35000 0 10 20 30 40 50 60 70 8 Displacement (mm) F o rce ( N ) 0 Force Peak Ultimate Failure
Figure 13: Comparison of 18”×18” Panel Results
One possible explanation for the large variation in results is that the panel material for each test was different. The 2008 panels tested came from an actual lifeboat while the 2009 panels were fabricated to replicate the original panels. The replicated panel results indicate a delamination of laminate materials prior to failure. This could have been caused by inadequate cure time. Another source of discrepancy could be the variation in hydraulic ram impact heads.
7.0 CONCLUSIONS
The main findings from the analysis of the 2008 and 2009 hydraulic ram tests are outlined below. These conclusions are all related to the impact behaviour of lifeboat fibreglass.
1. The temperature of the panels did not have a significant effect on maximum force. 2. The panel tested at lower temperature had a higher maximum displacement. 3. A change in panel temperature significantly affected the impact energy relating to
ultimate failure of fibreglass.
4. An increase in panel size resulted in an increase in the maximum displacement of fibreglass prior to fracture.
5. An increase in panel size lead to a decrease in panel failure energy. 6. Panel size variation had a negligible effect on maximum force. 7. Impactor shape affected the panel deformation pattern.
8. Replicated lifeboat laminate panels differed from actual lifeboat panels in terms of maximum impact force and displacement, but were similar in terms of panel failure energy.
8.0 REFERENCES
1. International Organization for Standardization (2000) Plastics – Determination of puncture impact behaviour of rigid plastics, 6603-2.
2. Kennedy, A. (2010) The Determination of Factors Affecting the Tensile Strength of Fibreglass Using Design of Experiments, Institute for Ocean Technology (NRC/IOT) Report, TR-2010-18.