Publisher’s version / Version de l'éditeur:
Proceedings of the 17th World Congress on Ergonomics, 2009, 2009-08-14
READ THESE TERMS AND CONDITIONS CAREFULLY BEFORE USING THIS WEBSITE. https://nrc-publications.canada.ca/eng/copyright
Vous avez des questions? Nous pouvons vous aider. Pour communiquer directement avec un auteur, consultez la première page de la revue dans laquelle son article a été publié afin de trouver ses coordonnées. Si vous n’arrivez pas à les repérer, communiquez avec nous à PublicationsArchive-ArchivesPublications@nrc-cnrc.gc.ca.
Questions? Contact the NRC Publications Archive team at
PublicationsArchive-ArchivesPublications@nrc-cnrc.gc.ca. If you wish to email the authors directly, please see the first page of the publication for their contact information.
NRC Publications Archive
Archives des publications du CNRC
This publication could be one of several versions: author’s original, accepted manuscript or the publisher’s version. / La version de cette publication peut être l’une des suivantes : la version prépublication de l’auteur, la version acceptée du manuscrit ou la version de l’éditeur.
Access and use of this website and the material on it are subject to the Terms and Conditions set forth at
Geometry Processing and Statistical Shape Analysis of 3-D
Anthropometry Data
Shu, Chang; Xi, Pengcheng; Ben Azouz, Zouhour; Meunier, Pierre
https://publications-cnrc.canada.ca/fra/droits
L’accès à ce site Web et l’utilisation de son contenu sont assujettis aux conditions présentées dans le site LISEZ CES CONDITIONS ATTENTIVEMENT AVANT D’UTILISER CE SITE WEB.
NRC Publications Record / Notice d'Archives des publications de CNRC:
https://nrc-publications.canada.ca/eng/view/object/?id=a7a88009-d000-445c-928e-88d3d39b6270 https://publications-cnrc.canada.ca/fra/voir/objet/?id=a7a88009-d000-445c-928e-88d3d39b6270
Geometry Processing and Statistical Shape Analysis of
3-D Anthropometry Data
Chang Shu1 Pengcheng Xi1 Zouhour Ben Azouz1 Pierre Meunier2
1
National Research Council of Canada
2
Defence Research and Development Canada
3-D anthropometry data obtained from 3-D scanning technology provide detailed information about the human shape. However, due to the limitations of the sensors, such as field of view, lighting condition, and object self-occlusion, the raw 3-D data are usually noisy and incomplete. Much processing is necessary before they can be used for statistical analysis. In this paper, we present geometry processing tools for preparing the raw data for shape analysis. We show that these tools help extract useful information about the human shape.
INTRODUCTION
Recent 3-D anthropometry surveys, such as the CAESAR project, provide tremendous amount of information about the shape of the human body. Unlike traditional anthropometry data which consist of one-dimensional measurements, 3-D anthropometry data usually come from digitizing the surface of the human body and are typically represented as surface meshes. They are able to capture detailed shape information about the human body. However, due to the limitations of the optical sensors, for example, occlusion and lighting conditions, the raw 3-D mesh data are noisy and incomplete. Much processing is needed before any statistical analysis can be performed. In this paper, we present geometry processing tools for preparing the raw data for shape analysis. Most of these tools were developed in computer graphics, computer vision, and pattern recognition. We show here that they are effective in characterizing human shape for designing products that fit humans.
The fundamental measurements of the 3-D anthropometry are the 3-D points represented as the x, y, and z coordinates in certain coordinate frames. These points represent the shape implicitly. However, different scans have different number of points and the points are not ordered in the same way. Performing statistical analysis requires a set of consistent measurements. In other words, we need to compare likewise measurements. This means that the data models have to be parameterized such that all of the models have the same number of points and points representing the same anatomical parts correspond to each other. Once we have a parameterization, multivariate statistics is applicable (Bookstein 1997, Dryden and Mardia 1998).
An effective way of establishing a correspondence among all the models is to fit a generic surface model to each scanned model such that the key anatomical features are in correspondence. Some 3-D anthropometry surveys place landmarks on the subjects prior to the scan. These landmarks can be used to guide the deformation of the generic model to
the scan. The problem can be formulated as a large-scale nonlinear optimization problem. Modern computer hardware and numerical algorithms allow us to solve this problem efficiently.
Placing the landmarks prior to scan is a tedious and time-consuming task; not all 3-D anthropometry data contain landmarks. Fortunately, it is possible to locate the landmarks automatically. We present a method that is based on statistical learning. We use the landmark data in the CAESAR database as a training set. Local surface properties and distance between landmarks are used to learn the parameters of a probabilistic graphical model. The prediction of the landmark locations is formulated as finding the maximum likelihood configuration of the landmark labeling. An efficient technique called belief propagation is used to solve the optimization problem.
Finally, we perform principal component analysis (PCA) on the parameterized dataset. The main mode of variation of the whole body shape is analyzed. Since each model is parameterized by a template mesh, different body parts, like the head, arms, legs, and torso can be analyzed separately. We present PCA results on the segmented body parts. Through these analyses, we show that the space of the human body shape is spanned by a small number of basis vectors. Furthermore, the main mode of variations can be visualized through animating the shape changes along the PCA axes.
DATA PARAMETERIZATION
The goal of data parameterization is to establish a correspondence among the models. An early attempt to solve this problem adopts a volumetric approach (Ben Azouz et al. 2003, Ben Azouz et al. 2006). Each model is embedded in an
m x n x k regular grid. By carefully orienting and normalizing the models, a correspondence in the ambient space and thus a correspondence among the models is established. The advantage of this method is that it is landmark-free. It is also easy to implement. The drawback, however, is that the
correspondence it produces is not accurate. Holes have to be filled before a model can be embedded into a grid. This proved to be a difficult task because certain parts of the model, for example, under the arms, have large holes. In some parts, like the hands and ears, up to 50% of the information is missing.
A better approach is to fit a generic mesh model to each data scan (Allen et al. 2003, Mochimaru et al. 2000, Mochimaru et al. 2005). This model is complete and has well-shaped and well-distributed triangles. The fitting deforms the generic model to each scan such that the two models are made geometrically equivalent. When deforming the generic model, the correspondence between the anatomical parts has to be maintained. This is achieved by using landmarks, which serves as the initial conditions of the problem. When deforming the generic model, we have to be careful that the smoothness of the surface has to be maintained. Otherwise, the triangles can go into each other, causing invalid meshes and consequently leading to the failure of the deformation algorithm.
Deforming a generic mesh smoothly to a data scan can be formulated as an optimization problem. Here, the variables we need to solve are the x, y, and z coordinates of the generic model. The initial solution can be simply the generic model. Given a solution, the cost function is defined by estimating the difference between the solution and the target data model. This includes three kinds of errors: (1) the landmark error, which accounts for sum of the distances between the known corresponding landmarks; (2) the smoothness error, which quantifies the local smoothness at every mesh points; and (3) the data error, which measures the sum of the distances between every pair of corresponding points.
Figure 1. Data parameterization process. (a) generic model; (b)
original scan; (c) RBF deformation; (d) nonlinear fitting. A typical scan consists of 100,000 to 300,000 points. Thus, our optimization problem involves the solving of a large number of variables. As the problem is nonlinear, it is difficult
to find stable solutions and the algorithm tends to be stuck in the local minima. Allen et al. suggested a multi-resolution approach where low resolution meshes are deformed before the high-resolution meshes. This method improves the efficiency and resolves some of the convergence problem, but it involves the hand setting of several parameters. Xi et al (2007) improved this method by first using Radial Basis Function (RBF) to deform the generic model to approximate the data model and then bringing the two models close together by the nonlinear optimization method of Allen et al. This simplifies the process and increases the speed by 50%. Fig. 1 shows the process of fitting a generic model to a scan.
AUTOMATIC LANDMARKING
In the CAESAR dataset, each scan contains 73 anthropometric landmarks. Placing these landmarks involves palpating the subjects and requires special skills. The accuracy of the position varies between different operators. Furthermore, not all of the datasets have landmarks, and in the future, it is unlikely that a lot of 3-D anthropometry surveys will have landmarks data.
Dekker et al (2001) attempted to locate the landmarks automatically. They define a set of rules for each landmark based on its local surface properties, such as curvature or distances to certain feature points. Then locating the landmarks becomes a classification problem. The problem of this approach is that the rules are based on intuitive observations. Because of the variations among humans, there are always exceptions and therefore the number of the rules quickly becomes too large to handle. More principled ways of locating the landmarks are necessary.
Ben Azouz et al. (2006) introduced an approach that is based on statistical learning. They used a subset of the CAESAR dataset as a training set. A graphical probabilistic model is used to model the positions of the landmarks. A node of the graph represents a landmark and an edge of the graph represents the relationship between a pair of neighboring landmarks. Fig. 2 shows the graph of the landmarks. The probability of a surface point to be a particular landmark depends on the local surface properties as well as its relationships with other landmarks. These constraints are naturally modeled by Markov Random Field (MRF) or Markov network. In the training stage, the distributions of surface geometric properties such as the SPIN image (Johnson 1997), and the relative positions of landmarks are computed. In the subsequent matching stage, landmarks are located by identifying the surface points that maximizes the joint probability defined by the Markov network. The probability of placing a landmark at a particular position depends on two types of information. One is the local surface property of that landmark. Another is the relationship to its neighboring landmarks. We use distance to measure this relationship. Both kinds of the probability distributions can be learned from the training data. We may also use geodesic distance. But since the landmarks are usually placed on the joints, the geodesic distance is usually proportional to the Euclidean distance.
The probability optimization problem has a prohibitively large search space; exact computation is infeasible. An approximate method, called belief propagation, is used to solve
this problem. Belief propagation is an efficient technique for solving large probabilistic optimization problem. When the graph has no loops, that is, when it is a tree, the solution is exact. When the graph has loops, we can only have an approximate solution. Our landmark graph contains loops. But in practice it works well. Fig. 3 shows the results of the predicted landmarks. On average, the algorithm predicts the landmark locations within 2.0 cm of the experts’ locations.
Figure 2. Landmarks and landmark graph.
Figure 3. Results of automatic landmark locating. The
green dots are the predicated location and the red dots are the landmarks placed by the human operators.
PRINCIPAL COMPONENT ANALYSIS
Having established the correspondence among all the models, we can perform statistical shape analysis. At this point, we have a set of parameterized models, each has the same number of points and the same mesh topology. The variables on which we perform statistics are the coordinates of the vertices on the meshes. A shape vector can be formed for each model and the mean vector and the covariance matrix can be computed. The eigenvectors of the covariance matrix form a basis of the shape space. This is the standard Principal Component Analysis (PCA) method. It transforms the data into a new coordinate system in which the modes of variations are ordered from large to small. The absolute values of the eigenvalues determine the significance of the corresponding variations (principal components). Many of them are negligible. It turns out that for full body and head fewer than 50 principal components can explain more than 90% of the shape variability.
VISUALIZATION
One of the advantages of statistical shape analysis is that it provides intuitive visualization of the shape variation. Since we use a dense point set on the surface to perform PCA, each principal component can be visualized by an animation produced by varying the parameter of the component. Fig. 4 shows the first 2 components.
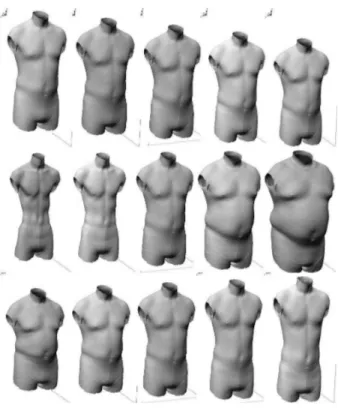
As the models are parameterized by a generic model, analysis can be performed on segments of the body. Fig. 5 shows the results of the PCA analysis of the torso.
Figure 5. First 3 components of the segmented analysis of
the torso.
CONCLUSIONS
Processing 3-D anthropometry data requires special techniques in geometry processing. We have drawn tools from computer vision and computer graphics to solve the problem of correspondence. Statistical shape analysis reveals patterns of changes in the human shape. The detailed and intuitive visualization gives designers a powerful tool for making decisions. At the same time, these new tools also pose challenges. The PCA components do not always correspond to everyday measurements of shape changes. Effective use of them remains a research problem.
A more challenging problem is analyzing human shapes in different postures. This allows the study of the human shape in dynamic environments. Again, the essential problem is establishing a correspondence among the models. Several authors have made some initial progresses in this area (Wuhrer et al. 2007, Anguelov et al. 2005, Bronstein et al. 2007)). However, much research remains to be done to find more robust and efficient algorithms.
REFERENCES
1. B. Allen, B. Curless, and Z. Popovic, “The space of human body shapes: reconstruction and parameterization from range scans,” ACM Transactions on Graphics (SIGGRAPH’03), 22(3):587-594, 2003.
2. D. Anguelov, P. Srinvasan, D. Koller, S. Thrun, J. Rodgers, and J. Davis. “SCAPE: shape completion and animation of people.” ACM Trans. Graph., 24(3):408-416, 2005.
3. Z. Ben Azouz, C. Shu, A. Mantel. “Automatic Locating of Anthropometric Landmarks on 3D Human Models,” Third International Symposium on 3D Data Processing, Visualization and Transmission (3DPVT 2006). Chapel Hill, North Carolina, USA. June 13-16, 2006
4. Z. Ben Azouz, M. Rioux, C. Shu, and R. Lepage, Characterizing Human Shape Variation Using 3-D Anthropometric Data, Visual Computer, vol. 22, pp. 302-314, 2006.
5. Z. Ben Azouz, M. Rioux, R. Lepage. “3D Description of the Human Body Shape: Application of Karhunen-Loève Expansion to the CAESAR Database,” Proceedings of the 16th International Congress and Exhibition of Computer Assisted Radiology Surgery. Paris, France. June 26-29, 2002. pp. 571-576.
6. A. M. Bronstein, M. M. Bronstein, R. Kimmel. Calculus of non-rigid surface for geometry and texture manipulation. IEEE Transactions on Visualization and Computer Graphics, 13(5):902-913, 2007.
7. F. L. Bookstein, Morphometric tools for landmark data: Geometry and biology, Cambridge University Press, 1997. 8. L. Dekker, I. Douros, B. Buxton, and P. Treleaven. “Building symbolic information for 3D human body modeling from range data,” Proceedings of the third International Conference on 3-D Digital imaging and Modeling (3DIM’99), pp. 292-298. May 2001.
9. I. L. Dryden and K. V. Mardia, Statistical Shape Analysis, Wiley, 1998
10. A. Johnson. SPIN-Images: A Representation for 3-D Surface matching. PhD thesis, Robotics Institute, Carnegie Mellon University, Pittsburgh, PA, August 1997.
11. M. Mochimaru, M. Kouchi, and M. Dohi, “Analysis of 3D human foot forms using the FFD method and its application in grading shoe last,” Ergonomics, vol. 43, pp. 1301-1313, 2000.
12. M. Mochimaru and M. Kouchi, “Statistics for 3D human body forms,” SAE Digital Human Modeling for Design and Engineering, Dearborn, MI, 2000.
13. S. Wuhrer, C. Shu, Z. Ben Azouz, P. Bose, Posture Invariant Correspondence of Incomplete Triangular Manifolds, International Journal of Shape Modeling, 13(2):139-157, 2007.
14. P. Xi, Won-Sook Lee., C. Shu. “Analysis of Segmented Human Body Scans,” Proceedings of the Graphic Interface 2007 Conference. Montréal, Québec, Canada. May 28-30, 2007.