Are Two Heads Better Than One in CAD?
A Comparison of Various CAD Working Styles.
by
Vrushank Shripad Phadnis
B.E., University of Mumbai (2010)
M.E., Massachusetts Institute of Technology (2013)
Submitted to the Department of Mechanical Engineering
in partial fulfillment of the requirements for the degree of
Doctor of Philosophy in Mechanical Engineering
at the
MASSACHUSETTS INSTITUTE OF TECHNOLOGY
September 2020
c
○ Massachusetts Institute of Technology 2020. All rights reserved.
Author . . . .
Department of Mechanical Engineering
August 15, 2020
Certified by . . . .
David R. Wallace
Professor of Mechanical Engineering
Thesis Supervisor
Accepted by . . . .
Nicolas Hadjiconstantinou
Professor of Mechanical Engineering
Graduate Officer
Are Two Heads Better Than One in CAD?
A Comparison of Various CAD Working Styles.
by
Vrushank Shripad Phadnis
Submitted to the Department of Mechanical Engineering on August 15, 2020, in partial fulfillment of the
requirements for the degree of
Doctor of Philosophy in Mechanical Engineering
Abstract
Collaboration in Computer-Aided Design (CAD) has existed since the inception of CAD tools. The established norm in multi-user CAD work has been to use top-down modeling techniques wherein a complex model is divided into sub-assemblies (or part files) for individual designers to work on separately. In this process, designers integrate their work through a check-in/check-out process. This style of collaboration does not change regardless of team sizes, product types, or over time. However, recent cloud-based CAD tools are expected to change this by offering real-time collaboration like Google Docs.
In this research, we are interested in learning the effects of real-time collaboration on designers’ work. We draw heavily from software development research where dyadic work is common and is known as ‘pair programming’. We use an experimental approach to investigate research questions pertaining to speed and quality of real-time collaboration.
We found that pair work in CAD is not summative. In other words, the work of two designers does not lead to twice the outcome of individuals. This results is contrary to previous real-time CAD collaboration research but consistent with software programming research. However, we also found that the quality of CAD increases in certain pair CAD settings. We observed that sharing control of the CAD software leads to higher quality and parallelizing work leads to worse quality. To elaborate on our results, we reveal specific patterns of participant behaviour based on audio communication and cursor activity.
In summary, we establish foundational knowledge in real-time CAD collaboration research. Through our work, we share insights which can inform practicing engineers that are interested in adopting pair CAD work.
Thesis Supervisor: David R. Wallace Title: Professor of Mechanical Engineering
Acknowledgments
Prof. David Wallace, thank you for getting the ball rolling. Your vision and experience in CAD research set me up for success. Our conversations on academia, Canada and teaching are cherished. Prof. Alison Olechowski, I am very fortunate to have started working with you when you were a grad student at MIT to now as the principal investigator (PI) of Ready Lab. Being with you through this transition has given me some of the best learning of my PhD. Thank you for taking me along on this journey. Your determination, empathy, and work ethic are inspiring and make Ready Lab the place it is.
To my committee members, our meetings were very much looked forward to. Prof. Warren Seering, thank you for encouraging me to think boldly about post-PhD life. Prof. Maria Yang, thank you for enabling the thriving design research community at MIT.
Prof. David Hardt, your mentorship has been crucial in shaping my career since I first came to MIT. From MEngM to recently working on 2.830x, you have been a role-model. Prof. Amos Winter and Prof. Sangbae Kim, thank you for including me in the fun-filled journey of 2.007. Your passion for mechanical design and care for students are an inspiration. Prof. Michael Golay, thank you for welcoming me into 22.811x, guiding my career choices and sailing. Your perspective on the world’s energy crisis is refreshing and I am privileged to be able to disseminate that.
Thank you to all the undergraduate research students that significantly con-tributed to this work. Kevin Leonardo, Cameron Arnet, Hamza Arshad, Jinxuan (Janice) Zhou, Jennifer Wu and Meaghan Vella, our meetings and conversations were instrumental in framing this research.
My peers from CADLab, Ready Lab and Ideation made enduring grad school super enjoyable. Dr. Joshua Ramos, thank you for having a solution to everything-CADLab-related. Georgia Van de Zande, Dr. Geoff Tsai, Audrey Bosquet, Dr. Larissa Nietner, Dr. Zhuoxuan (Fanny) Li and Teresa Lin, our time together de-fined my great experience in CADLab. Dr. Qifang Bao and Dr. Edward Burnell,
thank you for your companionship and enriching discussions. James Chen, Gustavo Zucco and Safa Faidi, our adventures in Myhal will be fondly remembered.
Leslie Reagan, you have always amazed me with your continued dedication in supporting MechE grad students. Kirsten, Stephan, Pablo, Ariane and Sauvanne, I could not have asked for a better home-away-from-home in Canada. Dr. Samuel Raymond, Dr. Mojtaba Forghani, Prof. Khalid Jawed, Sujay Bagi, Michael Arnold, David Wang, Shile Ding and Candy Wang, thank you for your invaluable friendship and making my time at MIT meaningful.
Lastly and most importantly, a very big thank you to my family. Baba and Aai, you have been pivotal to every success in life. Thank you for that initial nudge to apply to MIT and then seeing me through it. Sudiksha, thank you for keeping me smiling and happy, all the time. Ulhas Mama, thank you for instilling positivity during my lows at MIT. MamaAai, my success is a result of your nurturing and lessons on perseverance. I dedicate this accomplishment to you and will continue making you proud.
Raksha, thank you for bringing focus and pace to my PhD (and life). I look forward to our adventures.
Contents
1 Introduction 17
1.1 Motivation . . . 17
1.1.1 New (Virtual) Normal . . . 17
1.1.2 Challenges in Innovation of CAD Working Styles . . . 18
1.1.3 Optimistic Future for Mechanical CAD . . . 19
1.2 Thesis Outline . . . 22
1.2.1 Literature Review (Chapter 2) . . . 22
1.2.2 Methods Development (Chapter 3) . . . 23
1.2.3 Execution of Experiments (Chapter 4-5) . . . 23
2 Literature Review 25 2.1 CAD Research . . . 25
2.1.1 General Topics on Collaboration . . . 25
2.1.2 Synchronous Collaboration in CAD . . . 26
2.2 Background on Multimodal Methods . . . 28
2.2.1 Experimental Toolkits in Design Research . . . 28
2.2.2 Protocol Analysis Methods . . . 30
2.2.3 Automated Data-Capture Methods . . . 30
2.3 Pair Work . . . 31
2.3.1 Agile Methodology and Pair programming . . . 32
2.3.2 Remote Pair Programming . . . 32
3 Development of Multimodal Method And Pilot Study 35 3.1 Research Strategy . . . 35 3.2 Multimodal Toolkit . . . 36 3.2.1 Metrics of Interest . . . 36 3.2.2 Hardware . . . 36 3.2.3 Data/Information Interconnection . . . 37 3.2.4 Software . . . 39 3.2.5 Cursor Tracking . . . 42 3.2.6 Emotion Detection . . . 43 3.3 Pilot Study . . . 44 3.3.1 Nomenclature . . . 45
3.3.2 Pilot Study Facility . . . 46
3.3.3 Participants . . . 46
3.3.4 Design Task . . . 47
3.4 Pilot Study Results and Conclusions . . . 47
3.4.1 Manual Coding . . . 49
3.4.2 Cursor Tracking . . . 52
3.4.3 Emotion Detection . . . 52
3.4.4 Aggregating all Data Streams . . . 53
3.4.5 Limitations . . . 55
3.4.6 Conclusions . . . 55
4 Experiment and Results 57 4.1 Overview . . . 57
4.2 Research Framework . . . 57
4.2.1 Implementation of Pair CAD Working Styles . . . 57
4.2.2 Research Model . . . 58
4.3 Experiment Design . . . 59
4.3.1 Equipment (Hardware and Software) . . . 60
4.3.3 Operationalization Matrix . . . 64 4.3.4 Design Task . . . 66 4.3.5 Pilot Runs . . . 67 4.3.6 Participants . . . 67 4.4 Internal Validity . . . 68 4.4.1 Awareness Assumption . . . 69
4.4.2 Bias From Pre-Existing CAD Experience . . . 69
4.5 Defining Speed and Quality Metrics . . . 70
4.5.1 Variation Between Design Tasks . . . 72
4.5.2 Phase II and Phase IV Speed . . . 73
4.5.3 Phase II and Phase IV Quality . . . 73
4.6 Results . . . 75
4.6.1 Primary Research Questions . . . 75
4.6.2 Supporting Research Questions . . . 81
4.6.3 Aggregating Quantitative Findings . . . 86
4.6.4 Open-Response Survey Questions . . . 88
4.7 Summary . . . 91
5 Discussion and Conclusions 93 5.1 Discussion . . . 93
5.1.1 Reflections From Pilot Study . . . 93
5.1.2 Experiment Findings . . . 94
5.1.3 Recommendations on Pair CAD . . . 95
5.1.4 Limitations . . . 96 5.1.5 Future Work . . . 97 5.2 Conclusions . . . 98 A Design Tasks 101 B Supplementary Results 105 C Supplementary Figures 111
List of Figures
1-1 Relative mobility change in Mumbai in 2020 due to COVID-19.1 . . . 18
1-2 Illustration on top-down modelling example showing parent-child rela-tionship. CAD model adapted from the Perrinn project on Onshape.com. 19 1-3 Multiple users editing a single text document using Google Docs. 2 . 20 1-4 Comparison of cloud-based vs. traditional CAD. . . 21
1-5 Categorization of modern CAD tools.3 . . . 22
1-6 Current and future usage plans for cloud-based computer-aided design (CAD) worldwide in 2017. Adapted from [1]. . . 23
2-1 Remote pair programming styles. . . 33
2-2 Representation of various CAD working styles. . . 34
3-1 Research strategies. Adapted from [2]. . . 36
3-2 Architecture of toolkit showing metrics of interest, data types, and tools. 37 3-3 Hardware setup used in our experimental toolkit. . . 38
3-4 Work station layout and data flow diagram. . . 39
3-5 Manual coding in progress. . . 40
3-6 Screen footage divided in regions of interest (ROI). 1: Feature toolbar, 2: Communication, 3: Model tree, 4: CAD window. . . 42
3-7 Heatmap showing cursor activity for a pair participant. . . 43
3-8 Tracking points for the expression of surprise [3]. . . 43
3-9 Plot showing intensity of surprise [3]. . . 44
3-10 Naming scheme of different CAD working styles. . . 45
3-12 Initial CAD file provided to participants. . . 47
3-13 Final CAD files (Clockwise): OS Single, SW Single, OS Pairs. . . 48
3-14 (Left) Markov models of single participants and (right) pair partici-pants. Transition states: 1. Feature toolbar, 2. Model tree, 3. Com-munication, 4. CAD window. . . 52
3-15 Aggregate time metrics for emotions expressed by singles vs. pairs [3]. 53 3-16 (Top) (a) Complete dotted plot for OSP3_1 (bottom) (b) excerpts from participant dotted plot. . . 54
4-1 Illustration of pair CAD implementation. . . 59
4-2 Research model. . . 60
4-3 (Clockwise) Participant workstations, Phase I setup, Phase II setup, Phase III and IV setup. . . 62
4-4 Participant dashboard. . . 62
4-5 Phases of our experiment. . . 64
4-6 (Left) (a) Initial CAD file, (middle) (b) Final CAD file, (right) (c) Instructions (in mm). . . 66
4-7 (Left) (a) Initial CAD file, (right) (b) Final CAD file renderings. . . . 67
4-8 Awareness score vs. CAD working style. . . 70
4-9 Number of Phase II tasks completed vs. self-reported CAD experience (in months). . . 71
4-10 Variation in Phase IV task completion time vs. working styles. . . 72
4-11 (Left) Phase IV speed and (right) Phase IV quality vs. working styles. 76 4-12 Main effects for Phase IV speed. . . 78
4-13 Main effects for Phase IV quality. . . 79
4-14 Effect of interactions between Phase IV speed and working style on Phase IV quality. . . 80
4-15 Clustering of Phase IV speed vs. Phase IV quality data. . . 80
4-16 Audio activity vs. working style. . . 82
4-18 Cursor activity in regions of interest for each working style. . . 84
4-19 Satisfaction score vs. working style. . . 85
4-20 Examples of unusable web camera captures. . . 86
A-1 An instruction page from Phase I (training) demonstrating the use of "mirror" and "linear pattern" commands to participants. . . 102
A-2 Phase II design task asking participants to add two holes to their ex-iting CAD file. . . 103
A-3 Phase IV design task showing a user need; to add ventilation feature to existing CAD model. . . 104
B-1 CAD files by Individual CAD participants. . . 105
B-2 CAD files by Parallel CAD participants. . . 106
B-3 CAD files by Shared CAD participants. . . 106
C-1 One of the posters used for recruitment of participants. . . 111
C-2 Cursor activity heat-maps: (top) Shared CAD, (center) Parallel CAD and (bottom) Individual CAD. Darker color implies area with higher activity. . . 112
List of Tables
3.1 Summary of data source, post-processing tools, and data type. . . 40
3.2 Examples from change list. . . 48
3.3 Summary of overall modeling efficiency (OME) calculations. . . 51
4.1 Summary of data source, post processing tools, and data. . . 65
4.2 Summary of participants profile. . . 68
4.3 Summary of participant progress in Phase IV. . . 71
4.4 Schematic of Phase IV speed calculations. . . 74
4.5 Categories used in Phase IV quality calculations [4]. . . 75
4.6 Results from step-wise regression model with Phase IV speed as de-pendent variable. . . 77
4.7 Results from step-wise regression model with Phase IV quality as de-pendent variable. . . 78
4.8 Summary of supporting research questions. . . 81
4.9 Summary of participant responses to work equity prompt. . . 82
4.10 Summary of emotions from experiment data. . . 87
4.11 Correlation between experimental factors. . . 88
4.12 Count of some recurring themes from open response survey questions. 90 4.13 Summary of all research questions. . . 91
B.1 Individual CAD performance data. . . 108
B.2 Parallel CAD performance data. . . 109
Chapter 1
Introduction
1.1
Motivation
1.1.1
New (Virtual) Normal
At the time of writing this thesis, the world around us is going through a major trans-formation. The pandemic known as the novel coronavirus disease of 2019 (COVID-19) has had a profound impact on our lives that goes beyond the underlying health cri-sis [5]. As seen in Figure 1-1, ‘stay at home’ orders across the world have limited our ability to be in physical proximity with each other.
This warrants novel work practises, and in-person collaboration is no longer the standard. Remote work has become the new norm for many [6]. However, working together virtually is not a new concept and has long been considered as an alternative to physical offices [7]. It can be argued that the onset of the pandemic has accelerated its adoption and acceptance.
Remote work offers a number of advantages like saving in travel time, promoting diverse teams, reducing discrimination [8]. Conversely, there are disadvantages like reduced awareness of others’ work, decrease in explicit management, vulnerability to mistrust, and the need for complex technical infrastructure [9]. Teams can strive to achieve the right balance by selectively deploying remote work. This requires a thorough understanding of virtual team work and such insights are often
estab-Figure 1-1: Relative mobility change in Mumbai in 2020 due to COVID-19.1
lished in research. Through this work, we strive to draw such insights for mechanical engineering by investigating the impact of remote Computer-Aided Design (CAD) collaboration.
1.1.2
Challenges in Innovation of CAD Working Styles
Mechanical engineers may be considered as late adopters of fully virtual work. Some of the hesitation might stem from challenges in replicating the in-person interaction with physical artifacts, in an online environment. For mechanical engineers visual commu-nication and tactile feedback are essential. Recent efforts to use virtual/augmented reality (VR/AR) solutions are touted to provide an enhanced experience that comes close to working with physical objects. These techniques have received limited suc-cess in research but show future potential [10]. However, the equipment required for VR/AR applications remains fairly complex to setup and expensive to buy.
Besides tool limitations, the CAD community has to overcome inertia to change from decades of legacy in mechanical engineering. Our habits and working styles are
established from the long past era; starting with drawing on drafting boards. Some veteran engineers still prefer reviewing 2D part prints over 3D CAD models. Next, master modeling techniques and top-down assembly became popular for collaboration in early CAD tools. This is still the norm. As seen in Figure 1-2, in top-down modeling assembly files are subdivided into lower level sub-assemblies and part files. These part files are then assigned to individual designers to work on separately.
Lastly, the steep learning curve and high cost of procuring new CAD software forces enterprise customers to retain existing software. This risk averse nature of the CAD market may be a deterrent to new entrants from innovating. Conversely, CAD software are very complex and require extensive development time and domain knowledge.
Figure 1-2: Illustration on top-down modelling example showing parent-child rela-tionship. CAD model adapted from the Perrinn project on Onshape.com.
1.1.3
Optimistic Future for Mechanical CAD
We see a varying acceptance of digital technology in the past few generations of people [11]. Receptiveness to innovation in technology is much higher in newer generations. Today’s mechanical engineers use a variety of software tools like Slack, Google Docs, MATLAB Online, Asana, etc. in addition to traditional tools like CAD. These tools
differ immensely from their predecessors. For example, in Figure 1-3, we show four users collaborating on a single text document in real-time using Google Docs. This is vastly different from using email and Microsoft Word to produce the same work. This shift in working style hugely influences a writer’s ability [11,12]. In our research, we are interested in understanding the implications of such shifts in working styles; but pertaining to mechanical engineering.
Figure 1-3: Multiple users editing a single text document using Google Docs. 2
We see a recent uptick in cloud-based offerings from the CAD industry. Tools like SketchUp, Blender and Tinker CAD promise democratization of low fidelity design tools. As they are free of cost and require only a web browser to operate. However, they have limited capabilities and can not be alternatives to traditional CAD software like SOLIDWORKS and Rhinoceros (Rhino).
Cloud-based CAD tools offer an unique advantage by allowing multiple users to access the database at the same time, like in Google Docs. This functionality opens up novel working styles that were not possible in the past. A few of the benefits of using cloud-based CAD tools over traditional CAD tools are outlined in Figure 1-4. Cloud-based cloud use a centralized computing infrastructure for rendering and analysis. This means CAD users can access the CAD file in real-time using a simple web-browser. And there is no need to install a local instance of the CAD software which obviates the need for specific operating system or hardware specifications. All
files are securely stored and backed up using enterprise-level software and hardware. Cloud-based storage is also easier to scale and benefits both small and large scale organizations by allowing them to dynamically start/stop subscriptions as needed.
Figure 1-4: Comparison of cloud-based vs. traditional CAD.
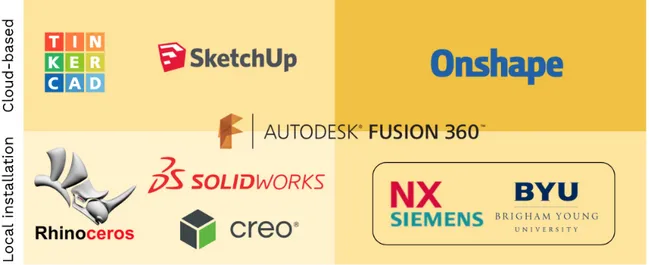
Figure 1-5 shows some of the current offerings in the CAD industry. Synchronocity in CAD (x-axis) pertains to the ability of a CAD tool to update everyones databases in real-time. In our work we use the words synchronous, cloud-based and real-time CAD interchangeably. Only a few fully-synchronous software are currently available and Onshape is one such example.
Synchronous CAD tools are still sparsely used. This could be partly because of the difficulty in using real-time collaboration. Figure 1-6 shows a summary of industry sentiments on cloud-based CAD. Note that this survey was conducted in 2017 and these sentiments might have changed. However, by 2017 cloud-based CAD tools were certainly commercially available. In the graphic, we see that 50% of the surveyed pool was aware of cloud-based CAD but did not pursue it. One can speculate that is the case because of the large investments made by companies in building their existing CAD infrastructure. However, we think some of these apprehensions might stem from not understanding the use-case for cloud-based CAD. Our investigation of the real-time collaboration features in cloud-based CAD will help designers evaluate
Figure 1-5: Categorization of modern CAD tools.3
the relevance of cloud-based CAD in their own work.
1.2
Thesis Outline
The work presented in this thesis is derived and partly reproduced from these publi-cations: [3, 4, 13–16].
Over the past few years, this research has evolved in three distinct phases: liter-ature review, methods development, and execution of experiments. This dissertation is also structured in that order.
1.2.1
Literature Review (Chapter 2)
Prior art looking into implications of real-time CAD collaboration is limited. Firstly, we survey this limited research and also outline topics on the broader theme of laboration in mechanical engineering. We then present an analogy of real-time col-laboration from software development called pair programming. Lastly, we define terminology and nomenclature that is specific to our work.
Figure 1-6: Current and future usage plans for cloud-based computer-aided design (CAD) worldwide in 2017. Adapted from [1].
1.2.2
Methods Development (Chapter 3)
Behavioral experiments are complex to set up and need a sophisticated tools. In this section, we present nuances of the hardware and software choices made to develop the experiment toolkit. To gain early insights and validate our toolkit we conducted a preliminary study and the results from the same are presented in this section.
1.2.3
Execution of Experiments (Chapter 4-5)
The final experiments were conducted at the University of Toronto (UofT). As part of this research we had the unique opportunity to set up a new lab space for Ready Lab at UofT. This section describes the final iteration of the experiment and corresponding results.
We begin Chapter 4 with a description of the logistics of running an experiment. Then we define variables of interest and present results. Lastly, in Chapter 5 we draw insights and present guidelines for future engineers interested in adopting pair CAD work.
Chapter 2
Literature Review
2.1
CAD Research
CAD, as a design tool has existed for more than half a century. Some of the foun-dational work in the field was done at MIT, at CADLab [17]. As a result, there is a rich repository of research topics on CAD tools. In the following sections, we discuss a subset of relevant research.
2.1.1
General Topics on Collaboration
Collaboration has long been a focus within the design research community [18]. Oster-gaard and Summers review the literature and put forward a taxonomy of collaborative design activities, consisting of a number of dimensions by which collaborative design is affected: team composition, communication, distribution, design approach, infor-mation and nature of the problem. Reflecting on these dimensions, we believe that fully-synchronous CAD presents an unique example of collaborative design work, in particular because of the nature of the problem, distribution of the team, and infor-mation. We posit that a new design approach may be necessary to best capture the value-add of the fully-synchronous CAD capabilities.
Another area of relevant research is that which looks at virtual teams. This literature is reviewed by Martins et al. [19]. Key implications for this work include that
type of technology used by virtual teams is an important input on team effectiveness and efficiency (varies by, for example, richness and novelty), as is task type (varies by, for example, ambiguity and complexity).
We expect that collaboration in computer-aided design could be different from other types of new product development collaboration - the nature of the collabo-ration is contingent on the work. Therefore, to understand fully synchronous CAD collaboration we need to specifically study work in this context.
2.1.2
Synchronous Collaboration in CAD
Collaboration in CAD has existed in some form since its inception. Like mentioned earlier, top-down assembly and master modeling techniques are the norm in industry and have proven to be efficient at organizing CAD work.
Recently, web-based synchronous CAD has become available commercially at scale. The ability to have multiple designers simultaneously modifying a model from their own workstations, once a dream, is now a reality through cloud-based soft-ware offerings [20, 21]. More products are being designed by global teams and high demand for anytime availability of product data is a compelling CAD software re-quirement. However, the potential collaborative features of synchronous CAD are intriguing as design is a social process that involves multiple people working towards a solution [22]. A synchronous CAD platform hypothetically offers numerous benefits such as: synchronous access, cost effectiveness, higher utilization of resources, and enhanced security [23]. However, there are still questions to be answered surrounding design in the cloud related to usability, security and computational performance.
Moreover, we have yet to understand the effect of these synchronous CAD tools on underlying design processes used at designer (user) level, or team level, and how to best make use of the provided design freedoms. It is plausible that in a fully syn-chronous collaborative CAD environment there will be an effect on key design metrics like: creativity, communication fluency, design quality, and productivity. Through our research, we aim to elucidate these relationships and present guidelines for best practices for fully-synchronous collaborative CAD work.
A few experiments have aimed to investigate collaborative CAD teams, some even using synchronous collaborative CAD tools. Eves et al. present a study of their spe-cific collaborative computer-aided design software, multi-user CAD (MUCAD) which allows synchronous design [24]. Their study is a comparison of the output of four-person teams using MUCAD and traditional CAD (sharing models through email). This study found that use of MUCAD increases the awareness of teammates’ activi-ties, and communication between team members. However no statistically significant findings were found related to model quality or team productivity, potentially due to limitations of a small sample size. It is important to note that the MUCAD software in this study was buggy, a major limitation on the industry-like setting for this work and on the quality of the collected data. The authors note anecdotally that multi-user teams appeared to have better interface management, and a better sense of current state of model and what still needed to be done.
Two studies have looked for associations between designer teams or product-type and design behaviors using full-synchronous collaborative CAD tools. Stone et al. set out to establish a method to determine the optimal number of designers on a part based on characteristics of the part itself and the architecture of its features [25]. Teams varied in size from one-to-four-person. No statistically significant trends were found. This study was also limited by buggy software. The authors do make an effort to adjust performance to compensate for the impact of bugs, but this is an important limitation of this work to consider. Another study looked at various team-member dynamics, especially communication, during a MUCAD design competition of three-person teams [26]. Teams that encouraged effective forms of communication and teams whose members scored similarly on Purdue Spatial Visualization Test (a test of spatial manipulation ability) performed better than other teams. The authors compared audio recordings and posit that patterns of communication could provide important insight. Though no statistically significant results regarding communica-tion were found, the authors note that anecdotally, high-performing teams tended to communicate less. This study was again limited by bugs in the software.
software [27]. This proposed design process provides guidance based on inputs of design specifications and task distribution (analyzed for dependence via. a design structure matrix), aiming to take advantage of the ability for multi-users to work concurrently in parallel. In particular, by analyzing the team for expertise and decision-making authority, the output of the design process is a list of tasks and corresponding personnel groups to accomplish those tasks. The authors claim that their process has the potential to reduce wait time and iterations, and therefore over-all design time. The authors present a smover-all data set comparing teams of three who follow this new process to teams of three who iterate through a design, indicating that the multi-user teams following the new process finish design tasks more quickly and with more specifications satisfied. However, these results are not statistically examined for significance, likely due to the small number of trials.
Current research specific to fully synchronous collaborative CAD, while prelimi-nary, makes important observations about trends in behavior and outcomes. These works highlight how little is known about synchronous collaborative CAD when com-pared to other forms of collaborative design and inspires potential directions for future detailed study.
2.2
Background on Multimodal Methods
Experiments provide a unique advantage to researchers by providing a higher degree of control in defining research questions [28, 29]. Exploratory experiments are espe-cially useful in emerging research fields which do not have an exhaustive pre-existing literature to draw upon; but are also challenging to set up as they need to capture a large array of variables. In Chapter 3, we present an experimental method to answer exploratory research questions about collaborative CAD.
2.2.1
Experimental Toolkits in Design Research
Our work has been influenced by previous research efforts to develop toolkits. Sivanathan et al. presented a ubiquitous data capture method for CAD work [30]. Their toolkit
facilitated real-time logging of multiple data types like CAD metadata, eye track-ing, cursor activity loggtrack-ing, Electroencephalography (EEG), and electrocardiogra-phy sensing. The benefits of real time analysis from the framework presented by Sivanathan et al. was proposed to be applicable beyond research settings. However, this setup requires a complicated sensor suite and does not lend well to designers’ nat-ural way of working. Another toolkit presented by Liu et al. used EEG, galvanic skin resistance (GSR)/electrocardiography (ECG) to capture psycho-physiological data. This dataset was used to compute designers’ emotions and compare with logs with CAD [31]. A fuzzy model was developed to derive emotions output which was val-idated in a case study. This approach, like Sivanathan et al.’s framework, relied heavily on sensor-based solutions. Nyugen et al. present an EEG based toolkit to automate the design protocol analysis methods using microstate analysis [32]. In this work, a model to map EEG signals to events of interest in design is developed. The toolkit is applied in a pilot study setting and its results are presented as a case study. Nyugen et al. present a detailed comparison between automated protocol analysis and expert human coders. This work concluded with recommendations on the choice of algorithms in automating design protocols using EEG.
Automated techniques often rely on sensor based data. Techniques like EEG and fMRI have been used in design research as tools to measure participants’ cognitive loads [33]. These heavily sensor-based techniques can be intrusive and complex to set up.
Rahman et al. present a software based approach to capture design behavioral data. A CAD platform, ENERGY3D was developed to study solar energy systems [34]. This approach is non-intrusive in nature but limited in the variety of variables captured by sensor based toolkits.
Contrary to the multimodal sensor based techniques, Ostergaard et al. present an experimental method to study collaboration patterns in design review meetings [35]. In this work, they compare groups vs. individuals working through a design review. Data is collected by evaluating participant worksheets post-experiment. The simplicity of the experiment and lack of a sophisticated toolkit limits the amount and
variety of data available.
2.2.2
Protocol Analysis Methods
Protocol analysis is an established method in design research and is used to under-stand hard-to-code designer behaviour [36]. A peculiarity of protocol analysis studies is their small sample sizes. Small data sets are common in protocol analysis because of the time consumed in coding each data set, sometimes taking 10 times longer than the footage being reviewed [36].
Researchers have investigated the effects of virtual vs. co-located design pro-cesses using protocol analysis methods [37]. Verbalization or think-aloud techniques are common in protocol analysis. For example, Anwar et al. modeled cognitive be-haviour of designers in the conceptual phase of their work using verbalization [38]. Verbalization techniques have limitations like data validity, steep learning curve, and tasks not being suitable for verbalisation [39].
Another popular protocol analysis method, known as retrospective analysis in-volves participants recollecting their experience post-experiment. Such retrospective protocol analysis methods are prone to filtering and bias by participants. It is also observed that informal reporting from researchers’ notes during the study can lead to data losses. As the research team might not have anticipated all possible events of interest beforehand [40].
2.2.3
Automated Data-Capture Methods
CAD is analogous to other graphics-based interactive software and thus, appropriate to be studied using research methods from the human computer interaction (HCI) community. Techniques like cursor tracking which are a subset of user experience (UX) data capture techniques are ubiquitous in HCI. Cursor tracking algorithms are quick to set up and track spatial location of the cursor/pointer. They can run natively on most operating systems and are less resource intensive compared to more advanced UX analytics software.
In psychology research, cursor tracking is popular and used to to ascertain user behaviour and preferences [41,42]. In design research, eye tracking is more popular [43, 44]. However, traditional eye tracking solutions lose out on UX analytics information like, clicks, scrolls and drag motions. Eye tracking solutions often require specialized hardware and need to be calibrated for each user. Although more accurate than cursor tracking, eye tracking is not perfect. Some eye tracking software triangulate the user gaze location with cursor coordinates to increase accuracy.
Self-reporting of emotions is a common measure of user satisfaction and this can be limiting. Methods like EEG and fMRI are gaining popularity and provide emotion metrics over continuous time [33,45]. But these methods are complicated to set up and require expensive equipment. In that regard, we chose a software based facial image recognition approach. Software based solutions are passive to the participants and may be run in the background. They rely on advanced algorithms to post process face recording footage and generate emotion metrics [46]. More recently, emotion tracking has been of interest within the design research community [31, 47]. Software based emotion tracking is particularly appealing because of its ease of use [14].
In our toolkit, we capture multiple data streams to analyse user behaviour. Such multimodal analysis has been successfully used to investigate human social behaviour [48]. More so, some design researchers have adopted such methods to study CAD work [30]. Multimodal methods provide a good trade off by leveraging the benefits of various data capture techniques. We rely on automated techniques for high frequency (high resolution) data like cursor movements, and emotion expression, but use manual techniques to document complex CAD activity that are hard to automate (or codify).
2.3
Pair Work
Small group work has been studied in research before [49]. Its adoption in software de-velopment, known as pair programming has shown potential benefits. In this section, we outline research on pair programming and draw parallels with our work.
2.3.1
Agile Methodology and Pair programming
Extreme programming techniques (XP) were popularized after the release of the Agile manifesto in 2001 [50]. Pair programming, a subset of XP techniques is becoming more common in software development teams. The benefits of pair (dyadic) programming have since been studied in both research and industry settings [51, 52]. The results of these works are mixed but pair programming has shown to impact the speed, quality and engagement of software developers [53]. A better understanding of pair program-ming methods helps teams to accurately deploy these techniques. For example, one of the benefits of pair programming is its ability to provide an enhanced knowledge-sharing experience [54]. This can immensely improve the on-boarding process of new team members or tasks requiring knowledge transfer between cross-functional stake-holders.
2.3.2
Remote Pair Programming
Traditionally, pair programming sessions strictly adhered to a driver-navigator style collaboration [55]. In such a pair only one participant codes at a time, allowing the second participant to review. Participants share control of a single station and switch roles as seamlessly. Typically, these sessions are held with participants being in physical proximity and sharing the same keyboard and mouse. The premise being, more eyes on the written code makes it higher quality and bug free [56].
However, an increasing number of pair programming sessions are now held re-motely. Software collaboration in virtual settings can be categorized into two broad categories, as shown in Figure 2-1. The nuances of each working style will be discussed next.
Traditionally, pair collaboration was achieved using screen sharing tools to main-tain the essence of having an increased awareness amongst users [57]. This style of collaboration was introduced in 1987 as What-You-See-Is-What-I-See (WYSIWIS) collaboration and developed as a groupware project called Colab at Xerox [58]. WYSI-WIS based tools are still prevalent today and preferred for their increased
aware-Figure 2-1: Remote pair programming styles.
ness [59–61].
Newer programming compilers can handle multiple code streams at a single time, enabling distributed programming [62, 63]. This style of working can be unstructured and breaks away from the strict driver-navigator dynamic [64]. The added editing freedom allows for parallelization of work and is touted to be faster [52]. However, possibly at the cost of reduction in quality [65]. We suspect that parallel control of the code base reduces awareness amongst participants but shortens development time. Typically, parallel coding setup necessitate advanced tools capable of integrat-ing multiple code streams without conflicts [66].
Similar to cloud-based CAD research, pair programming literature has used speed and quality as primary metrics to compare coder’s outcomes [52]. We will build our work on these same comparative metrics: speed and quality.
2.3.3
Introduction to Pair CAD
Preceding software engineering, research on mechanical engineering teams has been long ongoing and is well established [37, 67–72]. Moreso, the tools we use in practise are also mature. Product data management (PDM) is the preferred collaboration platform and is used to aggregate work of multiple individuals [67].
Mechanical design projects follow a progression similar to software development, starting from an ambiguous ideation phase and eventually leading to a structured detailed design outcome [73, 74]. Both disciplines rely on teamwork and in-depth domain knowledge for project success.
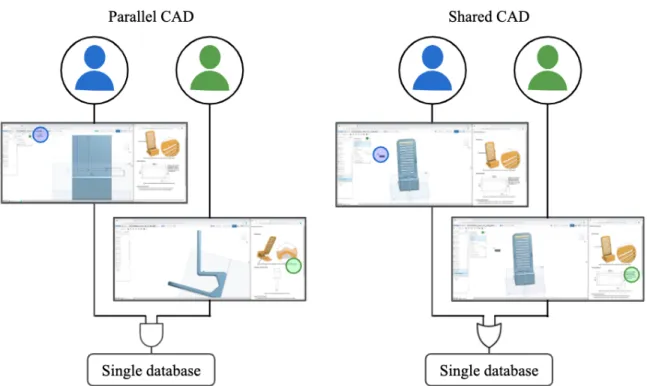
Figure 2-2 shows a visual representation of the differences in our proposed CAD working styles. In top-down modelling, multiple individual designers’ work is com-bined into a single assembly file using master modeling techniques. Note that each designer works on a mutually exclusive subset of the CAD assembly.
Cloud-based CAD tools allow multiple designers to work side by side in real-time. We call this style of work pair CAD. The first pair CAD style has both designers working on a single CAD database where they can edit the CAD file in parallel, si-multaneously. The second style is akin to screen sharing where both participants share the CAD user-interface (UI) itself but from separate terminals. Only one participant can actively navigate the CAD tool at a time.
Lastly, individual CAD work simply means one designer working on their own CAD file.
Chapter 3
Development of Multimodal Method
And Pilot Study
Our research experiments evolved in two distinct steps. First, metrics were estab-lished, measurement toolkit was developed and pilot study was conducted. Then, an improved version of the toolkit was used to carry out the second, larger, iteration of the experiment. Chapter 3 pertains to the first portion of our research experiments. And Chapter 4 presents the second portion.
3.1
Research Strategy
Research tools have evolved over the past few decades. However, the overarching types of research strategies have not changed. Figure 3-1 illustrates an array of such strategies and their inherent trade-offs. It is particularly noteworthy that none of these strategies can solely maximize all three attributes of behavioral research: precision, generalizability, and realism. In this work, we choose lab experiments as they offer most precision in defining abstract research questions. This was important as our work is early-stage and exploratory. We acknowledge the obtrusive nature of lab experiments and strive to minimize this limitation by avoiding sensor- based data generation.
Figure 3-1: Research strategies. Adapted from [2].
3.2
Multimodal Toolkit
This section describes the metrics of interst, hardware specifications, software choices and post processing methods implemented in our multimodal approach.
3.2.1
Metrics of Interest
Understanding CAD collaboration warrants an analysis of both CAD and non-CAD activities. We captured speed and quality attributes which are directly associated with the CAD activity. In addition, non-CAD related metrics like communication, user satisfaction, and user software interaction are useful in explaining the outcome of the CAD activities. A summary of all metrics of interest is seen in Figure 3-2. All metrics were mapped to quantifiable data captured using methods discussed in subsequent sections.
3.2.2
Hardware
A participant workstation in our experiment (Figure 3-3) consisted of the below hard-ware:
Figure 3-2: Architecture of toolkit showing metrics of interest, data types, and tools.
∙ Workstations: Mac-based computers running SOLIDWORKS and Onshape. These machines also captured webcamera footage and screen recording footage. Note that the webcamera was inbuilt.
∙ Monitor: 27” size, 16:9 aspect ratio monitors were used to display the CAD UI.
∙ Keyboard and mouse: Standard keyboard and mouse.
3.2.3
Data/Information Interconnection
Our toolkit was designed to handle a wide range of operating conditions imposed by the diversity of the CAD working styles. This was partly made possible by using configurable hardware/software. In this section, we provide details on how all stations were setup for the experiments.
We used cloud-based CAD on all collaborative CAD stations. The single working style stations used a local installation of SOLIDWORKS. In addition to participant stations, we used a central command station connected to external hard drives to
archive participant data. Post-experiment, ownership of all CAD files were transferred to the command center. See Figure 3-4 for an illustration of our data flow and interconnections. CAD files provided to pairs were connected online so that each participant could collaborate with their partners.
All data was stored using an anonymous coding scheme in compliance with the ethics board requirements. Video recording data was stored locally on participant stations and then archived post-experiment.
Figure 3-4: Work station layout and data flow diagram.
3.2.4
Software
All data streams captured during our pilot study are tabulated in Table 3.1. A de-scription of each data type follows. Note that some metrics are redundant/overlapping and were used to triangulate results.
Manual Coding
Protocol analysis allows us to codify information that is otherwise hard to capture using automated techniques. A coding schema is central to a protocol analysis. Frameworks like function-behaviour-structure (FBS) are popular in the design re-search community [75]. However, a CAD-specific coding schema is currently lacking in the literature. We implemented a grounded theory approach to develop a CAD collaboration specific coding schema [76].
The five tracks shown in Figure 3-5 are: geometry modification (CAD work), communication, rotate/3D spin, roll back, and help access. These were derived from watching multiple screen recording videos and identifying patterns in them. All videos
Table 3.1: Summary of data source, post-processing tools, and data type.
Name Source Post-processing Data type
Protocol analysis (manual) Screen recording V-Note Quantitative:
Time stamping events: communica-tion, CAD file rotacommunica-tion, model roll-back, help menu access
Cursor tracking (automated) Screen recording Open CV Quantitative:
2D position (X/Y location) of cursor Emotion detection (automated) Web-camera recording Affectiva Quantitative:
Percentage of total time an emotion was expressed
were annotated using a video coding software, V-Note. A detailed description of each track in our coding schema follows.
Figure 3-5: Manual coding in progress.
CAD Work
Tracking CAD completion times helped us record the time taken to complete a certain design task. Similar time based metrics have been used by other design researchers to compare different CAD working styles [26]. We included three subcategories into this
track: active/productive work, rework, and incomplete/unfinished work. The statis-tics generated from time spent in each category were used to assess the participants performance in our pilot study.
Communication
Although our setup was capable of capturing written and verbal communication, we chose to limit our participants to written communication for this work. As it is easier to decode and analyse. Communication messages were tagged and marked with time stamps using the manual coding software. We coded messages into two categories: (i) communication to plan/update and (ii) communication to help/advice. Communication between participants was restricted to the design task on hand and participants were instructed not to identify each other in their communications.
Spin/Rotate
This track captured rotating the CAD geometry to seek awareness. We recorded the frequency and time duration of each instance of spinning/rotating of the CAD geometry.
Roll-back or Suppress
Rolling back the model tree is a common strategy used in CAD and is used to tem-porarily revert CAD features in the model tree. Each roll-back was documented with the time for which it stayed active and frequency in this rolled back state.
Help Menu Access
We expected our participants to use the software’s help menu during the pilot study to assist with information on features. Time spent on referring to the help menu was catalogued in this track. Data generated from the manual coding process was aggregated for each participant and then combined on a per-working-style basis. For paired work, each participants data was calculated separately and then averaged with their partner to compute statistics for the pair.
3.2.5
Cursor Tracking
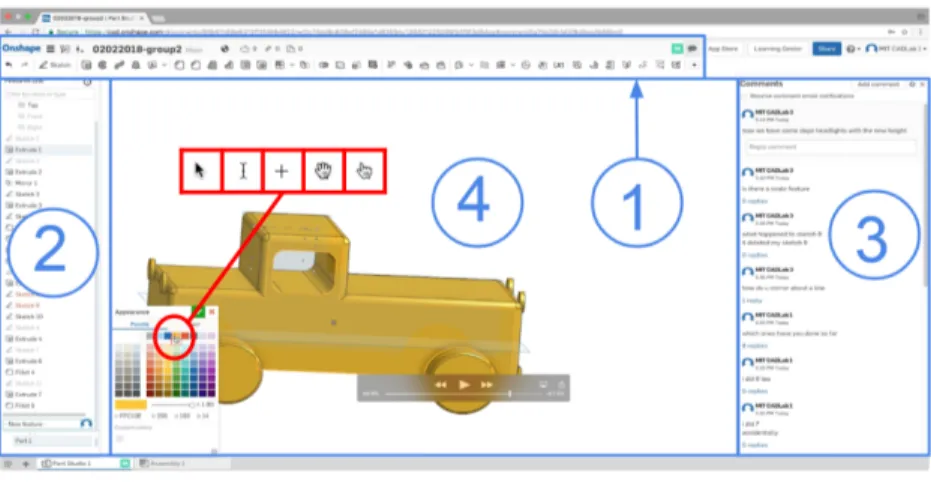
We built a post-processing object detection algorithm using template matching in OpenCV. This helped us capture cursor locations from screen recording videos. Cur-sor location data was then categorized in regions of interest as seen in Figure 3-6. The script scanned pixels of an input frame and correlated it to multiple input template images to find a match. This method obviates the need to maintain additional spe-cialized cursor-tracking software during the pilot study. High thresholds were set for the cursor-template matches, and multiple calibration tests were performed. This was an important step in mitigating false detection and ensured repeatability of our cur-sor tracking results. To further counter false detections, repeated locations for more than 10 seconds were flagged. With our current parameter settings, the algorithm was able to recover more than 85% of cursor locations.
Figure 3-6: Screen footage divided in regions of interest (ROI). 1: Feature toolbar, 2: Communication, 3: Model tree, 4: CAD window.
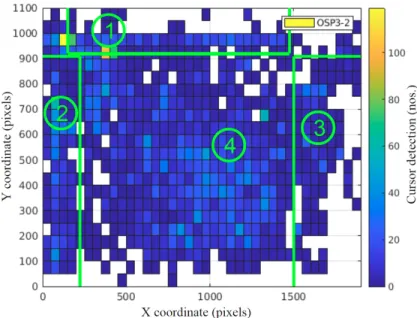
Each output log file generated at least 7,000 cursor location entries. Heatmaps were used for qualitative evaluation of cursor tracking data. An example is shown in Figure 3-7.
Figure 3-7: Heatmap showing cursor activity for a pair participant.
3.2.6
Emotion Detection
Facial expressions were tracked and processed to calculate emotion metrics for each participant. A tool using the software developer kit (SDK) within Affectiva was built to accept video uploads and generate emotion statistics [14]. The software worked by tracking facial cues and mapping landmark points as shown in Figure 3-8. These maps were then correlated to a library of seven known emotions. And in Figure 3-8 this mapped to the expression of surprise.
Figure 3-8: Tracking points for the expression of surprise [3].
expression of a given emotion. A rating of 0 meant the emotion was not present and 100 meant the emotion was fully expressed. Our code sampled data at 2 frames per second (fps) to match the frequency of other software in our toolkit. Overall, we had a 81% detection rate for facial videos processed from the pilot study. An example output corresponding to expression of surprise discussed earlier is plotted in Figure 3-9.
Figure 3-9: Plot showing intensity of surprise [3].
3.3
Pilot Study
Our pilot study goals were to validate the workings of our toolkit and to draw early insights for future work. The pilot study was designed and executed in compliance with the Committee on the Use of Humans as Experimental Subjects (COUHES) at MIT. As part of COUHES requirements, all participant names were anonymized.
3.3.1
Nomenclature
We chose three distinct CAD working styles: single person working in traditional CAD, single person working in synchronous CAD, and lastly a pair working in syn-chronous CAD. The three working styles help us test all possible modes in which our toolkit would be used in a future study. We were interested in studying pairs vs. individual CAD work and chose Onshape (OS) as it supported both working styles. We added a third working style with Solidworks (SW), a traditional CAD package, as benchmark. We adopted the following naming:SWS1 to SWSn for single SOLID-WORKS participants, OSS1 to OSSn for single Onshape participants, OSP1_1 and OSP1_2 for participants working in Onshape pair 1, upto OSPn_1 and OSPn_2 for participants working in Onshape pair n. See Figure 3-10 for a visual representation of the naming scheme.
3.3.2
Pilot Study Facility
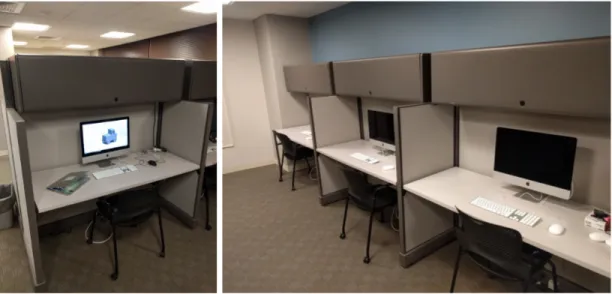
The experimental setup was built in a pre-existing facility in the MIT Behavioral Research Lab (BRL). Our focus was to be non-intrusive and maintain a design-office-like environment. We kept our setup void of any external cameras or body sensors.
It was important for us that participants were in physical and audio isolation from each other to simulate virtual collaboration. The physical space inside our lab was divided using slide-out partitions. We also added white noise in the environment to cancel out any residual audio. Figure 3-11 shows our experimental setup at the MIT BRL.
Participants were asked not to use personal electronic devices during the pilot study and adequate storage space was provided.
Figure 3-11: Pilot study setup at MIT BRL.
3.3.3
Participants
Our participant pool consisted of 12 students from MIT. It was required that all participants had taken a design class and used CAD for more than a year. A total of 16 people participated in the study but we considered 12 participants data for our analysis. Some data was discarded because of technical glitches or participants lacking prerequisites. On average, our participants had more than 2.5 years of CAD
experience. Every participant was given a demo of the unique features in synchronous CAD including its collaborative features.
3.3.4
Design Task
Participants were asked to role-play toy designers working on an early-stage concept of a toy car shown in Figure 3-12.
Figure 3-12: Initial CAD file provided to participants.
After reviewing the initial CAD file, participants were tasked with implementing a list of 42 changes that represented feedback from customer review sessions. Exam-ples changes are shown in Table 3.2. We purposely designed our change list to limit participants user-software interaction and perform drafting tasks only. This prescrip-tive nature of our change list minimized variability in interpretation of the change list and forced participants to spend the majority of their time on CAD modeling. Participants were asked to implement as many changes as possible in 60 mins, with each change awarded a score. The objective was to get the highest score and thus, make as many changes as possible.
3.4
Pilot Study Results and Conclusions
Our pilot study led to 9 CAD files, as shown in Figure 3-13. OS Single and SW single participants’ CAD files are not as elaborate as their paired counterparts. This is due
Table 3.2: Examples from change list.
# Change name Score
1 Add 3mm fillet overall on the body of the car 1 2 Increase the length of the car by 20% 1 3 Change the diameter of the wheels to 30mm 1 4 Increase width of tires by 50% 1
to fewer changes implemented and this difference is captured more quantitatively in the following sections.
3.4.1
Manual Coding
Inter rater reliability (IRR)
Manual coding of videos relies on judgement of human coders to classify objects into perceived categories. It is thus important to validate a coding schema’s repeatabil-ity by testing its interpretation by multiple people. Cohen’s Kappa is a measure of inter-rater reliability (IRR) and is often used to check the reproducibility of a manual coding schema [77, 78]. A second coder rated 99 samples from the manual coding video repository. Video samples were distributed such that we had at least one repre-sentation from each track of our coding schema. These ratings were cross referenced with their original categorization to compute IRR statistics. We achieved 85% agree-ment between ratings and our IRR assessagree-ment resulted in a high Cohen’s K statistic of 0.71 suggesting a substantial agreement between raters [79].
Performance Analysis
Participant success in our pilot study was measured by the number of changes com-pleted in 60 minutes. As seen from the first two rows of Table 3.3, paired participants were slower at implementing changes in comparison to individuals. It is noteworthy that the average time taken to complete a change is not directly indicative of the total number of changes implemented. This difference can be explained by analyzing the non-CAD activities of the protocol analysis.
Overall modeling efficiency (OME) is an aggregate metric used to compare rel-ative performance of participants. We adapted this approach from manufacturing literature, where overall equipment efficiency (OEE) is used to compare production efficiency of machines [80–82].
We defined three ratios to compute OME: availability ratio, speed ratio, and quality ratio. Availability ratio captures the total time available to participants to perform CAD related activities. Time spent towards activities like rework, failed changes, and communication were removed from total study time to calculate the available time for each working style.
Next, speed loss ratio was used to capture the relative differences in speed of executing changes. This ratio was calculated by base lining each participant with the fastest participant, SWS1.
And lastly, quality loss ratio accounts for the accuracy with which each working style implements changes. This ratio penalized participants for unfinished or incor-rectly implemented changes.
OME was calculated as a product of all ratios, as seen in Equation 3.1
𝑂𝑀 𝐸 = 𝑆 𝑆′ × 𝐴 𝐴′ × 𝑄 𝑄′ (3.1) where,
S = Total number of changes completed by participant
S’ = Maximum number of changes completed by any participant, 15 in our case
A = 3600 - time lost performing non-CAD related activities
A’ = 3600 (secs)
Q = Number of changes attempted - number of unfinished or incorrect change
Q’ = Total number of changes attempted by participant
T able 3.3: Summary of o v erall mo deling efficiency (OME) calculations. W orking st yle SWS1 SWS2 SWS3 OSS1 OSS2 OSS3 OSP1_1 OSP1_2 OSP2_1 OSP2_2 OSP3_1 OSP3_2 No. of changes 15 15 9 13 12 9 9 8.00 6 10 5 8 Ind. sp eed loss 1.00 1.00 0.60 0.87 0.80 0.60 0.60 0.53 0.40 0.67 0.33 0.53 A vg. sp eed loss 0.87 | 0.75 | 0.51 Sp eed loss SWS | Sp eed loss OSS | Sp eed loss OSP Qual. loss ti m e 977 361 326 169 336 0 853 1331 0 0 144.00 331 Comm un. time 0 0 0 0 0 0 219 156 592 541 725 311 Non-CAD time 977 361 326 169 336 0 1072 1487 592 541 869 641 Ind. a v ailabil it y 0.73 0.90 0.91 0.95 0.91 1.00 0.70 0.59 0.84 0.85 0.76 0.82 A vg. a v ail. ratio 0.85 | 0.95 | 0.76 A v ailabilit y SWS | A v ailabilit y OSS | A v ailabilit y OSP No. of qual. lo ss 4 3 2 3 3 0 3 2 0 0 2 2 Ind. qual. loss 0.79 0.83 0.82 0.81 0.80 1.00 0.75 0.80 1.00 1.00 0.71 0.80 A vg. qual. loss 0.81 | 0.87 | 0.84 Qualit y loss SWS | Qualit y loss OSS | Qualit y loss OSP Ind. OME 0.58 0.75 0.45 0.67 0.58 0.60 0.32 0.25 0.33 0.57 0.18 0.35 A vg. OME 0.6 | 0.6 | 0.3 OME SWS | OME OSS | OME OSP
3.4.2
Cursor Tracking
Modelling the cursor tracking data proved challenging, given its size and complexity. To capture the time aspect of our data, Markov chain models were built to depict transitions between regions of interest. A model was created for each participant but to simplify our analysis we chose to aggregate data for each working style. This led to two models as shown in Figure 3-14. Each transition state in the below models maps to the regions of interest identified in Figure 3-6.
Figure 3-14: (Left) Markov models of single participants and (right) pair participants. Transition states: 1. Feature toolbar, 2. Model tree, 3. Communication, 4. CAD window.
3.4.3
Emotion Detection
Similar to the cursor tracking data, emotion tracking data was computed at a high frequency and then down-sampled. All instances of sustained emotion were catalogued in one of the seven categories in Figure 3-15. Paired participants expressed more emotions than individuals. A more elaborate analysis of this emotion data can be found in Zhou et al. ’s work [14].
Figure 3-15: Aggregate time metrics for emotions expressed by singles vs. pairs [3].
3.4.4
Aggregating all Data Streams
Analysing multiple data streams together can prove challenging and makes it difficult to compare the three working styles comprehensively. In an effort to aggregate data, we created dotted plots as seen in Figure 3-16 (a). These plots show the manual protocol analysis data alongside the cursor tracking data. As the two data-sets were not mutually exclusive, it was difficult to set up a quantitative analysis. We used the dotted plots to derive qualitative understanding of our participants behaviour. For example, in Figure 3-16 (b), it is seen that OSP1_1 and OSP1_2 manipulated the geometry lot more than OSS3.
The dotted plots augment information presented by the protocol analysis and Markov models by adding a time dimension. For example, the transition probabilities shown in Figure 3-14 give us an aggregate view of the participants movement within the CAD environment. But the dotted plots in Figure 3-16 help us understand the distribution of time spent over the timeline of our pilot study. This tells us if the transitions are happening regularly or in spurts.
Figure 3-16: (Top) (a) Complete dotted plot for OSP3_1 (bottom) (b) excerpts from participant dotted plot.
3.4.5
Limitations
The small size of our participant pool reduces the confidence in our results. Using students as participants in design research has precedence in the field, but results from such work falls short in their generalisability to real world scenarios. Rigorous training of student participants can help minimize this disconnect and will be implemented in future.
We chose a design task that was drafting focused. This provided greater clarity of the design tasks to participants but limited the scope of our results.
Our toolkit heavily relied on post processing of datasets. This lent convenience in running the experiment, but at the cost of data losses from video post processing algorithms. For example: cursor tracking was implemented for OS pairs and OS single working styles only, as the SWS CAD UI was drastically different in comparison. This posed problematic for our cursor tracking script and it could not deliver consistent results. The comparison between OS pairs and OS singles was adequate to compare individual CAD work against paired work in the pilot study. However, a better coverage of all working styles can be achieved by running cursor tracking natively, a simple extension of our experimental set-up
3.4.6
Conclusions
This chapter outlined a multimodal experimental approach to study CAD work and successfully validated its working in a pilot study setting. The resulting dataset was analysed to create models and representations to study differences in paired CAD work vs. individuals.
The hardware and software tools provided consistency and standardization in running experiments. In the pilot study, it was noted that single participants were faster than pairs. This is in agreement with other literature on computer supported collaborative work [83].
More broadly, collaboration is inherent with losses and a good understanding of the underlying causes of such overhead and possible gains is paramount [49].
Chapter 4
Experiment and Results
4.1
Overview
This chapter describes the final version of the experiment which is based on learning from Chapters 1-3. All the major contributions of this research are in the following chapter. We firstly present the revised experiment setup, followed by results pertain-ing to research questions surroundpertain-ing speed, quality, communication, UI activity, and user satisfaction.
4.2
Research Framework
4.2.1
Implementation of Pair CAD Working Styles
Figure 4-1 show the two working styles chosen for the experiment. These were first introduced in Chapter 2, Figure 2-2. All participants in the experiment used Onshape as the primary CAD software. Onshape was configured differently and sometimes used alongside additional software, depending on the prescribed working style.
All participants worked on a single part file and not an assembly. This was impor-tant as we did not want to provide any spatial compartmentalization and potentially influence the collaboration strategy of pairs. For example, multiple part files in a CAD assembly might lead participants to work on individual parts separately because of
the nature of the CAD file.
Parallel CAD participants worked on the same Onshape file, wherein both partic-ipants had access to a common database. But they worked on a local instance of the database allowing them to change the CAD file, in parallel. This style of work, like mentioned in Chapeter 2, is analogous to text editing in Google Docs [84]. Parallel CAD pairs had no obvious incentive to look over each others work and this was ex-pected to reduce awareness. Note that Onshape also provides a limited screen sharing option but it is not the natural mode of work of the CAD software.
Shared CAD participants used a screen sharing tool called Use Together in addi-tion to the provided CAD model. This working style was analogous to using video conferencing software like Zoom/Skype. This meant they had to take turns at using the software to work on their CAD database. Each pair participant had their own independent keyboard/mouse control and their own cursor pointer. This style of work was expected to increase awareness amongst pairs as participants had to look over each others work throughout the experiment.
Lastly, the individual CAD working style participants worked by themselves and were representative of traditional CAD use.
4.2.2
Research Model
We compare the three working styles on the basis of speed and quality; shown as RQ1 and RQ2 in Figure 4-2. The results of this comparison were validated by assessing the influence of participants incoming skill level on their pair performance. Lastly, we use supporting questions: S1, S2, and S3 to further elaborate on our primary research questions. The architecture of our research model is based on previous work in pair programming [83].
Below is a list of all our research questions Primary research questions:
∙ RQ1: On a per person basis, is Parallel CAD faster than Shared CAD and Individual CAD work?
Figure 4-1: Illustration of pair CAD implementation.
∙ RQ2: Does Shared CAD lead to higher quality work compared to Parallel CAD and Individual CAD?
Supporting research questions:
∙ S1: Do Shared CAD participants communicate more than Parallel CAD par-ticipants?
∙ S2: Do Parallel CAD participants share work more equally compared to Shared CAD participants?
∙ S3: Are Parallel CAD and Shared CAD participants more satisfied than Indi-vidual CAD participants?
4.3
Experiment Design
As part of this research, we specified and procured new hardware. Our experiment consisted of various phases and this posed unique constraints on the hardware re-quirements.
Figure 4-2: Research model.
Before beginning our work, we obtained ethics approval from the Research Ethics Board (REB) at UofT. All participant data presented in this section was code-named to comply with REB stipulations.
4.3.1
Equipment (Hardware and Software)
We designed our lab space to mimic a typical design work environment in industry. This meant we could not use excessive audio video (AV) equipment and chose not to use body mounted sensors like skin conductance and electroencephalogram (EEG). The non-intrusive approach proved successful during our pilot study at MIT BRL and thus, was replicated at UofT. This also helped in simplifying our hardware setup and provided a natural setting for our participants. The details of our hardware are shown in Figure 4-3. All equipment shown highlighted is as below:
1. Audio communication: Over-the-ear headset with an external mic. The setup also had a remote to control volume and mute.
2. Face recording: An external web-camera was used to record participants faces. We recorded footage at 1080p x 60fps with a stable frame rate.
screen resolutions was 2560 x 1080; enabling us to show the design task and CAD UI alongside each other. See Figure 4-4 for an illustration of the participant dashboard.
4. Input: A standard QWERTY keyboard and a mouse with scroll were used as input devices. Our setup was adaptable for left-handed users.
5. Furniture: A height-adjustable chair and standard height tables were used. After Phase II, portable room dividers were used to reorganize the room into compartments.
6. Computers: Each participant station was capable of running the front end: CAD UI, design task and collaboration tool and back end: recording AV streams and performing UX analysis.
Our minimal hardware setup meant that we had to post-process all data streams to extract the necessary metrics. Below is the list of software used in our experiment.
∙ UX analytics: A python-based script collected the cursor point locations, button clicks, keyboard typing, and scroll wheel use. This script ran in the background. ∙ Video data stream: All video data was processed and archived using open
broad-caster software (OBS).
∙ Automation: It was important to maintain the time synchronicity of our data. This was done by starting all software simultaneously and keeping track of any discrepancies. We used a modified version of the cursor tracking python script to initiate all video and UX analysis software at once.
∙ CAD: A configured version of Onshape was used as our primary cloud-base CAD software. We accessed the CAD UI and all design tasks through Google Chrome. We used Windows 10 as the operating system on all of our computers.. ∙ Audio communication: Participant-to-participant communication was enabled
Figure 4-3: (Clockwise) Participant workstations, Phase I setup, Phase II setup, Phase III and IV setup.


![Figure 3-15: Aggregate time metrics for emotions expressed by singles vs. pairs [3].](https://thumb-eu.123doks.com/thumbv2/123doknet/14086179.464131/53.918.138.785.100.516/figure-aggregate-time-metrics-emotions-expressed-singles-pairs.webp)