Publisher’s version / Version de l'éditeur:
Review of progress in quantitative nondestructive evaluation: Volume 30A; Volume 30B, pp. 273-280, 2011-06-23
READ THESE TERMS AND CONDITIONS CAREFULLY BEFORE USING THIS WEBSITE.
https://nrc-publications.canada.ca/eng/copyright
Vous avez des questions? Nous pouvons vous aider. Pour communiquer directement avec un auteur, consultez la
première page de la revue dans laquelle son article a été publié afin de trouver ses coordonnées. Si vous n’arrivez pas à les repérer, communiquez avec nous à [email protected].
Questions? Contact the NRC Publications Archive team at
[email protected]. If you wish to email the authors directly, please see the first page of the publication for their contact information.
NRC Publications Archive
Archives des publications du CNRC
This publication could be one of several versions: author’s original, accepted manuscript or the publisher’s version. / La version de cette publication peut être l’une des suivantes : la version prépublication de l’auteur, la version acceptée du manuscrit ou la version de l’éditeur.
For the publisher’s version, please access the DOI link below./ Pour consulter la version de l’éditeur, utilisez le lien DOI ci-dessous.
https://doi.org/10.1063/1.3582780
Access and use of this website and the material on it are subject to the Terms and Conditions set forth at
Determination of crystallographic texture in steel plates using laser-generated surface waves
Lévesque, D.; Lim, C. S.; Padioleau, C.; Blouin, A.
https://publications-cnrc.canada.ca/fra/droits
L’accès à ce site Web et l’utilisation de son contenu sont assujettis aux conditions présentées dans le site LISEZ CES CONDITIONS ATTENTIVEMENT AVANT D’UTILISER CE SITE WEB.
NRC Publications Record / Notice d'Archives des publications de CNRC:
https://nrc-publications.canada.ca/eng/view/object/?id=5b579dd2-c91a-4e84-88ee-7d73b7898dbc https://publications-cnrc.canada.ca/fra/voir/objet/?id=5b579dd2-c91a-4e84-88ee-7d73b7898dbc
DETERMINATION OF CRYSTALLOGRAPHIC TEXTURE IN
STEEL PLATES USING LASER-GENERATED SURFACE WAVES
D. Lévesque1, C. S. Lim2, C. Padioleau1,and A. Blouin1
1Industrial Materials Institute, National Research Council Canada, Boucherville, Quebec, Canada
2Instrumentation & Control Research Group, POSCO Technical Research Laboratories, Pohang City, Gyeongbuk, Korea
ABSTRACT. A laser-ultrasonic approach based on the propagation of surface skimming longitudinal wave (P-wave) and Rayleigh wave (SAW) is investigated for the measurement of crystallographic texture in moderately thick steel plates. The angular dependence of the P-wave and SAW velocities presents different patterns, both of amplitude of a few % attributed to texture. Results obtained from fitting the angular profiles using relevant expressions for P-wave and SAW confirm that texture coefficients may accurately be measured by this approach. Moreover, the difference of the P-wave and SAW profiles is shown to be very robust against small path length changes or other detrimental effects such as surface roughness. For actual measurements on large plates, a solution based on the rotation of a generation line using an axicon lens is tested. Texture variations across the width of steel plates and the influence of residual stress are discussed.
Keywords: Crystallographic Texture, Hot Rolled Steel Plate, Laser Ultrasonics, Residual Stress PACS: 81.70.Cv, 43.35.Yb, 43.35.Zc, 43.35.Pt
INTRODUCTION
In the continuous production line for hot-rolled steel sheet, thick input material is transformed to much thinner steel sheet in the form of coil by several processes. The stresses generated during these processes are usually transformed into energy for shaping the steel strip. But practically, a small amount of stress usually remains in the steel sheet after the whole processing. Also, texture change is expected to occur for similar reasons. Therefore, the control of texture and reduction of residual stress are important and necessary for high quality steel product.
Laser ultrasonics can be a good candidate for such measurements. Successful results were obtained in recent years for residual stress in aluminum using an approach based on the laser generated surface skimming longitudinal wave (LSSLW or P-wave) [1-3]. For steel, the effect of stress on the ultrasonic velocity is small, with an acoustoelastic coefficient of about -0.1 % / 100 MPa for the P-wave, i.e. four times less than in aluminum. Also, this coefficient is only about -0.01 % / 100 MPa for the Rayleigh wave or surface acoustic wave (SAW). A through thickness polarimetric method was also considered in the past for such measurements. The method consists in measuring the
ultrasonic velocities of cross polarized shear waves propagating through the thickness of the plate. This method has been used with some success using conventional piezoelectric transducers [4, 5]. For texture measurement, the laser generation of both polarizations of shear waves has been investigated in recent years using resonance spectroscopy [6]. With moderately thick plates of steel however, the approach is not expected to work.
In this paper, a laser-ultrasonic approach based on the propagation of P-wave and SAW is described for the measurement of texture in steel plates. The angular dependence of the velocity of these modes presents different patterns of amplitude of a few %, attributed to texture. Also, the difference of the P-wave and SAW profiles is found to be very robust against small path length changes or other detrimental effects. For measurements on large plates, a solution based on the rotation of a generation line is tested. Texture variations across the width of steel plates and the influence of residual stress are discussed. Some results are also shown using bulk wave polarimetry with laser ultrasonics. LASER ULTRASONIC P-WAVE APPROACH
A laser-ultrasonic setup was assembled for precise velocity measurements of P-wave and SAW as shown in Figure 1. A pulsed frequency doubled Nd:YAG laser is employed to simultaneously generate these ultrasonic modes. For the ultrasonic detection, a long pulse Nd:YAG laser is coupled to a photorefractive interferometer by optical fibers. A line-generation and line-detection configuration is used to minimize wave spreading and average microstructure noise. Typical laser line dimensions are 6 mm x 0.2 mm at generation and 1.5 mm x 0.2 mm at detection. A scanning system is mounted to allow measurements for different separation distances between the generation and detection locations. The setup further includes a rotation stage for the analysis of the angular dependence of velocity variations due to both texture and stresses. Concurrently, a small tensile machine specially designed can be used for velocity measurements with the laser-ultrasonic system.
For signal processing, a cross-correlation method is used between the measured signal and a reference signal for each separation distance between the generation and detection. One has the simple relation between velocity and time delay variations:
(1) where V is the velocity, t is the time delay and d is the path length. Since variations are small, the index 0 (for zero stress) is unnecessary and if the change in path length (e.g. separation distance between generation and detection lines) can be neglected, one has the simple relation:
FIGURE 1. Schematic of the laser-ultrasonic setup.
Pulsed Nd:YAG Laser (1064 nm; δ = 80 μs
Translation table
Interferometer
(CFP or TWM) Pulsed Nd :YAG Laser(532 nm; δ =8 ns)
Translation table Sample Tensile machine or Rotation stage Optical fibers Translation table 0 0 0 dd tt V V = Δ −Δ Δ
(2) One improvement is to use the P-wave and SAW in combination to correct for small changes in the path length with respect to Eq. (1) and possibly other effects. Taking the difference between velocity variations of the two modes results in the relation:
(3) where the subscript denotes the wave mode. In this manner, the path length change is cancelled out.
Using the rotation stage, the angular dependence of the velocity or time delay in a sample is a combined effect of texture and stress [2, 3]. The equations for P-wave and SAW with coefficients for steel were calculated and are given by:
(4)
where θ is the angle with respect to rolling direction, W400, W420 and W440 are the texture coefficients in the Roe's notation, σm= (σ0+σ90)/2 is the mean stress and σd= (σ0-σ90)/2 is the difference (in MPa) between the rolling (0 deg) and transverse (90 deg) directions. If σ90 can be considered negligibly small, therefore σm = σd = σ0/2. Also with a reference signal at 0 deg, one should subtract terms corresponding to 0 deg from Eq. 4. When using a reference with rotation at a different location, the variation in each physical quantity with respect to the reference is obtained. Also, for the P-wave / SAW combination, the expression for the difference is easily derived from Eq. (4).
MEASUREMENT RESULTS
A series of measurements was performed using the rotation stage on samples cut across the width of a large plate 8 mm thick. It is expected that the stress should be actually zero due to the small sample dimensions. Measurements were made after slight surface polishing. The first results showed velocity variations clearly oscillating in a different manner for P-wave and SAW, with an amplitude of more than 1 % attributed to texture, which is much larger than the 0.1 % variation expected for a 100 MPa stress, for example.
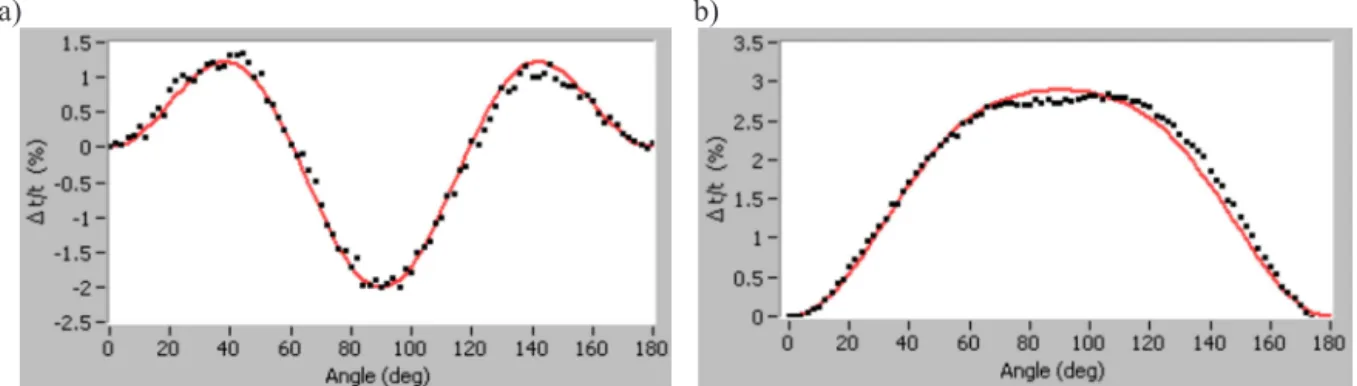
Figure 2 shows the time delays from simultaneously fitting the profiles of P-wave and SAW using Eq. (4) with parameters W420, W440 and a fixed separation distance of 14 mm. Notice that the reference is the signal in the rolling direction at 0 deg. The fit is quite good with texture coefficients W420= -3.56 x 10⁻³and W440= 3.37 x 10⁻³in the valid range, with stress values forced to zero. Figure 3 shows the results of fitting the difference profile of the P-wave / SAW combination for samples at the edge and at the center. For the edge, a very good fit is obtained with texture coefficients W420 = -3.65 x 10⁻³ and W440 = 2.91 x 10⁻³ close to the previous values obtained. For the center, a good fit is also obtained with smaller texture coefficients W420 = -1.46 x 10⁻³ and W440 = 1.80 x 10⁻³. The difference profile shows similar behavior when making measurements with a rough, as received, surface finish. ) 4 cos( 11 . 3 ) 2 cos( 35 . 2 ) 2 cos( 10 8 . 12 12 . 1 10 2 . 10 ) ( ) / ( 440 420 6 400 6 θ θ θ σ σ θ W W W V V P m d + + − − − = Δ − − ) 4 cos( 74 . 0 ) 2 cos( 17 . 4 ) 2 cos( 10 2 . 3 2 . 2 10 2 . 1 ) ( ) / ( 440 420 6 400 6 θ θ θ σ σ θ W W W V V SAW m d + − − + − = Δ − − ⎟⎟ ⎠ ⎞ ⎜⎜ ⎝ ⎛ Δ − Δ − = Δ − Δ SAW SAW P P SAW SAW P P t t t t V V V V t t V V ≈−Δ Δ
a) b)
FIGURE 2. Simultaneous fit of the profiles for a) P-wave and b) SAW on a sample near the edge.
a) b)
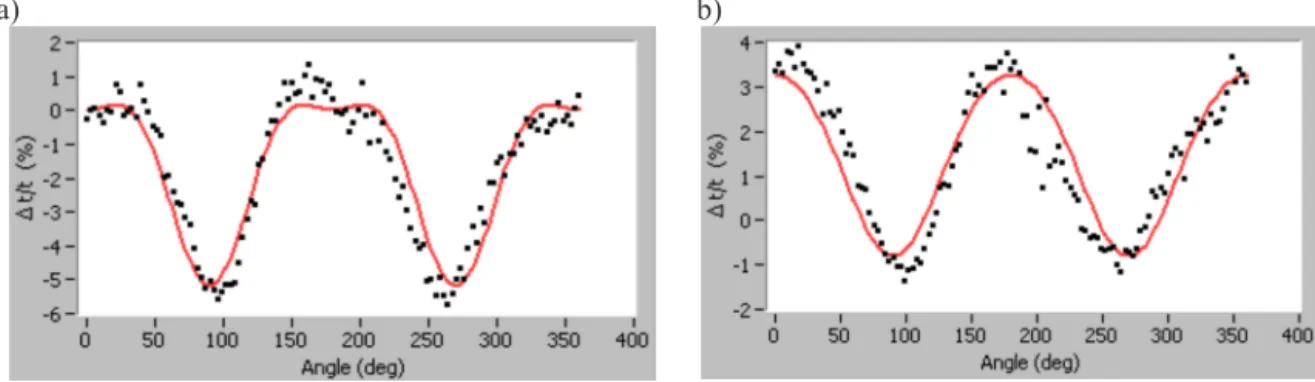
FIGURE 3. Fit of the profile of the P-wave / SAW combination for a sample a) at the edge and b) at the center.
Another analysis is to use the center as reference location and apply cross-correlation for the P-wave and SAW with corresponding signals at each angle. With this reference choice, the contribution of W400 can be obtained as well from fit. Figure 4 shows the difference profile and fit of the P-wave / SAW combination for samples from opposite edges. Such difference profiles show less scattering than separated P-wave and SAW profiles. For the same edge as before, a very good fit is obtained with texture coefficient variations ΔW400 = -0.36 x 10⁻³, ΔW420 = -2.26 x 10⁻³ and ΔW440 = 0.87 x 10⁻³. The changes in texture coefficients ΔW420, ΔW440 are quite consistent with the distinct values obtained from the two samples in Figure 3. For the other edge, the good fit is obtained with almost the same texture coefficient ΔW400 = -0.35 x 10⁻³, but smaller values of the others, ΔW420= -1.34 x 10⁻³and ΔW440= 0.79 x 10⁻³. These results indicate an asymmetry across the width of the strip.
a) b)
FIGURE 4. Fit of the profile of the P-wave / SAW combination using center as reference location for a sample a) at one edge and b) at the other edge.
a) b)
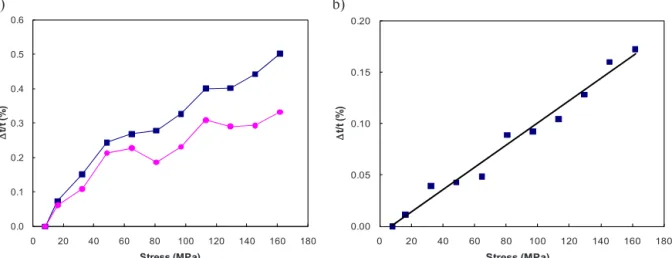
FIGURE 5. Time delay variations of a) P-wave (squares) and SAW (circles) and b) the combination as function of applied stress on a steel sample.
Measurements were also performed using the tensile machine to clearly determine the effect of stress on the above measurements. Figure 5 shows the time delay variations of the P-wave and SAW, in addition to their combination (difference), as function of the applied stress on a 5 mm thick sample machined in the usual dog bone shape. Figure 5a shows a roughly linear increase for each wave in the measured range of stresses. However, the combination in Figure 5b shows the expected linear trend with a slope of 0.109% / 100 MPa (negative sign for velocity), close to the literature value. Notice that the reference signal is chosen while applying a small load (about 10 MPa), and then the time variation is not exactly 0 for zero stress. From this figure, the effect of stress should be negligible in angular profiles where time delay variations of more than 2 % is observed.
BULK WAVE POLARIMETRIC APPROACH
A through-thickness polarimetric method may be considered as an alternative to the surface wave approach described above. The laser generation of both shear wave polarizations has been investigated in recent years using resonance spectroscopy. With thick steel plates however, a different approach has to be developed. The laser-ultrasonic setup was modified for velocity measurements of shear wave and longitudinal wave (S-wave and L-(S-wave) through the sample thickness. Line generation with a cylindrical lens is used to enhance the S-wave with a polarization perpendicular to the line axis, in particular from the thermoelastic dipole effect. The sample is rotated to scan the polarization of the S-wave that propagates through the thickness with respect to the two principal axes of birefringence, i.e. the rolling and transverse directions. Generation was tested in both the slight ablation regime and the thermoelastic regime. The detection laser beam is impinging on the opposite side of the sample. Typical laser line dimensions at generation are 6 mm x 0.2 mm and the detection is a circular spot of about 0.2 mm diameter. Full rotation was performed to get a profile and analyze the angular dependence of velocity variations due to both texture and stresses.
A model exists for the time delay or velocity changes of the through-thickness S-wave with both polarizations due to the coupled effect of texture and stress in the rolling (parallel) and transverse (perpendicular) directions. The equations for S-wave with coefficients for steel were calculated and are given by:
(5) 0.0 0.1 0.2 0.3 0.4 0.5 0.6 0 20 40 60 80 100 120 140 160 180 ΔΔt/ t(% ) Stress (MPa) 0.00 0.05 0.10 0.15 0.20 0 20 40 60 80 100 120 140 160 180 ΔΔt/ t(% ) Stress (MPa) 420 0 6 || ( / ) 5.5710 11.75 ) / (ΔV V S − ΔV V S⊥ = − σ + W
One important aspect is that the parameters W420 and σ0 cannot be obtained from this difference alone. Another equation can be obtained for the L-wave / S-wave combination, with the relation:
(6) which also identically cancels out the path length.
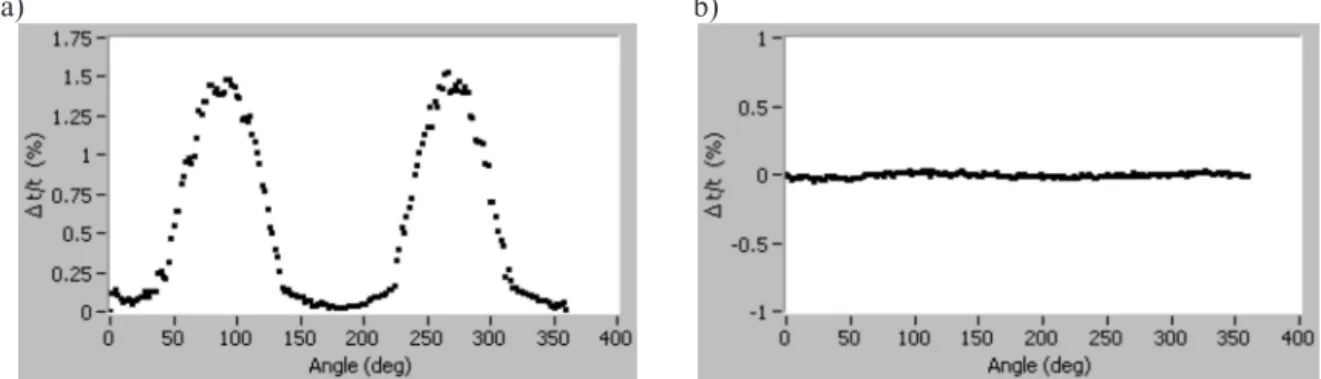
Figure 6 shows the angular dependence of time delay of the S-wave with respect to rolling direction of a 8 mm thick sample with a line generation and point generation in slight ablation. The effect of line generation to enhance shear wave with a polarization perpendicular to the line axis is quite clear as compared to the point generation of 0.2 mm diameter. From such a profile, the time delays of the S-wave with polarization along the the rolling and transverse directions (0 and 90 deg) are the basic information. It is believed that other directions represent a S-wave of mixed polarization. The observed change in the time delay of about 1% is attributed to texture.
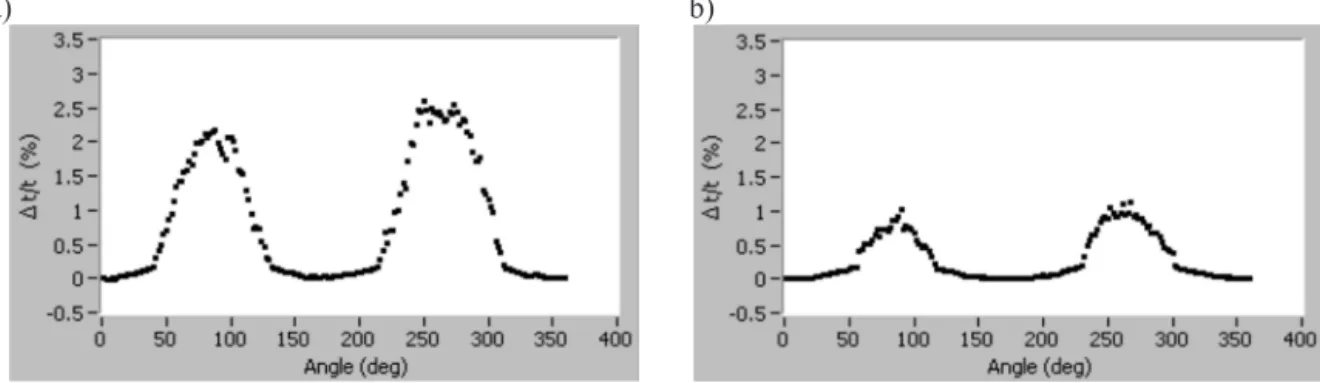
Figure 7 shows the angular dependence of time delay with respect to rolling direction for a sample at the edge and at the center using the S-wave only. The change in time delay between the rolling and transverse directions is clearly different for the two samples. Such large variations are attributed to texture change, but other factors also affect the time delay. One factor can be a small offset between generation and detection making a significant change in time delay. The pulse shape difference cannot be the reason for this since the reference signal at 0 deg is used in each case. Another factor that makes the approach difficult to use is the impact of the generation mechanism. A smaller change of time delay between rolling and transverse directions is observed for the thermoelastic regime compared to the ablation regime. It is noticed that the generation efficiency of the S-wave with given polarization is partly based on the presence of the thermoelastic dipole. Also, since velocity variations are involved instead of amplitude, it is believed that such a change is not due to surface conditions. Another difficulty regarding the approach is the time delay change observed with the frequency. Despite the apparent ease for generating a S-wave of given polarization, these factors make the polarimetric approach uncertain. Also, only a few data (at 0 and 90 deg) from these measurements can be used to evaluate texture and stress. These are sufficient reasons to adopt the surface wave approach for measurements on large samples.
a) b)
FIGURE 6. Angular dependence of time delay with respect to rolling direction of a 8 mm thick sample using the polarimetric approach with a) line generation and b) point generation.
400 0 6 || ( / ) )/2 5.0110 8.39 ) / (( ) / (ΔV V L − ΔV V S + ΔV V S⊥ =− − σ + W
a) b)
FIGURE 7. Profile of time delay for a sample a) at the edge and b) at the center using the S-wave only. MEASUREMENTS ON LARGE SAMPLES
To test the surface wave approach on large hot-rolled samples, an optical setup was developed to perform rotation of the generation line instead of the sample itself, with a point detection at the center of the circle formed. Two solutions were proposed for the rotation of the generation line to make measurements in the reflection mode. A first method uses a cylindrical lens and a rotating wedge to shift the line from the center and move it along a circle on the sample surface. The advantage of this setup is the fixed generation line width, but one major difficulty is the difficult optical alignment with many degrees of freedom. A second solution is to use an axicon lens to image the laser beam onto a circle and a moving mask to limit the image to an arc rotating on the sample surface. This setup is much easier to implement but one difficulty is that uniformity of the annular width highly depends on the lens quality. Two axicon lenses with angle of 5 and 10 deg were tested, corresponding to a circle of radius 6.35 and 16 mm respectively, as the path length between the arc at generation and detection at the center. Preliminary tests show that the profile of the P-wave / SAW combination has the same properties as before, even on a sample with rough surface.
Two large hot-rolled samples, 8 mm thick and of dimensions sufficient to sustain residual stresses across the width, were prepared by POSCO. From strain gauge measurements, it was found that one sample had residual stresses reaching -80 MPa (in compression) near the edges, compared to -20 MPa for the other sample. Figure 8a shows a profile and fit of the P-wave / SAW combination near the edge on the sample with largest stresses, using an axicon lens of 16 mm radius and the reference signal at 0 deg. The profile shape is nearly symmetric with time delay variations of about 6 %. Such large variations should be attributed to texture. To reduce the effect of texture and possibly make more emphasis on stress, a strategy discussed before is to use a reference location far enough from the edge with almost no stress. Figure 8b shows the profile of the P-wave / SAW combination using a reference location at 175 mm from the edge. The profile is nearly symmetric, but large variations are still observed. Therefore, taking a reference location far enough from the edge does not cancel out the texture effect. According to the fit, variations of the texture coefficients between the two locations are ΔW400= 4.00 x 10⁻³, ΔW420= -3.06 x 10⁻³and ΔW440= 0.56 x 10⁻³.
a) b)
FIGURE 8. Profile of the P-wave / SAW combination near the edge on a large sample a) with the reference at 0 deg and b) using a reference location at 175 mm from the edge.
CONCLUSION
A laser-ultrasonic approach based on the propagation surface waves was studied for the measurement of texture in steel plates. The difference of the P-wave and SAW profiles is shown to be very robust against small path length changes or other detrimental effects. The polarimetric method was also tested using laser ultrasonics. Despite the apparent ease for generating S-wave of given polarization, sensitivity to various factors makes the approach inadequate.
For actual measurement on large plates using the P-wave approach, a solution based on the rotation of a generation line using an axicon lens was tested. Texture variations across the width of a plate are obtained. Taking a reference far enough from the edge does not cancel out the texture effect to have variations mostly due to stress. This texture change could prevent measuring residual stress in hot-rolled steel strip with ultrasound. However, the potential of measuring the texture on-line by laser ultrasonics is demonstrated.
REFERENCES
1. C. Bescond, J.-P. Monchalin, D. Lévesque, A. Gilbert, R. Talbot and M. Ochiai, Determination of residual stresses using laser-generated surface skimming longitudinal waves, Proc. of the SPIE, Symp. on NDE for Health Monitoring and Diagnostics, 5767 (2005), pp. 175-186.
2. C. Bescond, D. Lévesque, M. Lord, J.-P. Monchalin, S. Forgues, Laser-generated surface skimming longitudinal wave measurement of residual stress in shot peened samples, Review of Progress in QNDE, 25, ed. by D.O. Thompson and D.E. Chimenti, AIP Conf. Proc., NY (2006), pp. 1426-1433.
3. A. Moreau, C.S. Man, Laser-ultrasonic measurements of residual stresses in a 7075-T651 aluminum sample surface-treated with low plasticity burnishing, Review of
Progress in QNDE, 25, ed. by D.O. Thompson and D.E. Chimenti, AIP Conf. Proc.,
NY (2006), pp. 1434-1441.
4. T. Jacquot, M. Nogues, U. Hofmann, Residual stress analysis on heavy plates by ultrasonic testing, Revue de métallurgie 10, p. 1023 (2003).
5. D.R. Allen, C.M. Sayers, Ultrasonics 22, 179-188 (1984).
6. A. Moreau, D. Lévesque, M. Lord, M. Dubois, J.-P. Monchalin, C. Padioleau and J.-F. Bussière, Ultrasonics 40, 1047-1056 (2002).