Publisher’s version / Version de l'éditeur:
Vous avez des questions? Nous pouvons vous aider. Pour communiquer directement avec un auteur, consultez la première page de la revue dans laquelle son article a été publié afin de trouver ses coordonnées. Si vous n’arrivez pas à les repérer, communiquez avec nous à PublicationsArchive-ArchivesPublications@nrc-cnrc.gc.ca.
Questions? Contact the NRC Publications Archive team at
PublicationsArchive-ArchivesPublications@nrc-cnrc.gc.ca. If you wish to email the authors directly, please see the first page of the publication for their contact information.
https://publications-cnrc.canada.ca/fra/droits
L’accès à ce site Web et l’utilisation de son contenu sont assujettis aux conditions présentées dans le site LISEZ CES CONDITIONS ATTENTIVEMENT AVANT D’UTILISER CE SITE WEB.
12th International Congress on the Chemistry of Cement [Proceedings], pp. 1-12, 2007-07-08
READ THESE TERMS AND CONDITIONS CAREFULLY BEFORE USING THIS WEBSITE.
https://nrc-publications.canada.ca/eng/copyright
NRC Publications Archive Record / Notice des Archives des publications du CNRC : https://nrc-publications.canada.ca/eng/view/object/?id=5657684b-6bda-4241-8590-93f4b782ccbb https://publications-cnrc.canada.ca/fra/voir/objet/?id=5657684b-6bda-4241-8590-93f4b782ccbb
NRC Publications Archive
Archives des publications du CNRC
This publication could be one of several versions: author’s original, accepted manuscript or the publisher’s version. / La version de cette publication peut être l’une des suivantes : la version prépublication de l’auteur, la version acceptée du manuscrit ou la version de l’éditeur.
Access and use of this website and the material on it are subject to the Terms and Conditions set forth at
The Effects of particle statistics on quantitative Rietveld analysis of cement
http://irc.nrc-cnrc.gc.ca
T h e E f f e c t s o f p a r t i c l e s t a t i s t i c s o n
q u a n t i t a t i v e R i e t v e l d a n a l y s i s o f c e m e n t
N R C C - 5 0 0 7 8
M i t c h e l l , L . D . ; W h i t f i e l d , P . S . ; B e a u d o i n , J . J .
A version of this document is published in / Une version de ce document se trouve dans: 12th International Congress on the Chemistry of Cement, Montreal, July 8-13, 2007, pp. 1-12
The material in this document is covered by the provisions of the Copyright Act, by Canadian laws, policies, regulations and international agreements. Such provisions serve to identify the information source and, in specific instances, to prohibit reproduction of materials without written permission. For more information visit http://laws.justice.gc.ca/en/showtdm/cs/C-42
Les renseignements dans ce document sont protégés par la Loi sur le droit d'auteur, par les lois, les politiques et les règlements du Canada et des accords internationaux. Ces dispositions permettent d'identifier la source de l'information et, dans certains cas, d'interdire la copie de documents sans permission écrite. Pour obtenir de plus amples renseignements : http://lois.justice.gc.ca/fr/showtdm/cs/C-42
The Effects of Particle Statistics on Quantitative Rietveld Analysis of Cement
By
L.D. Mitchell, P.S. Whitfield & J.J. Beaudoin
National Research Council Canada 1200 Montreal Road, Ottawa Canada
1.0 Abstract
Quantitative Rietveld analysis of cements is now a common tool in both industry and research. Many papers analyse cements without any additional sample preparation over and above the grinding carried out by the manufacturer. The particle sizes in cements are usually in the range of 25-40μm, which is much coarser than recommended in texts dealing with particle statistics in diffraction. Coarse particles will have an effect on the particle statistics, and consequently the reproducibility of the relative peak intensities. A systematic study has been undertaken to examine the effect of particle statistics on the results from Rietveld analysis of cements, and the influence of reducing the particle size by micronizing. In addition, the effects of changing divergence slit and use of sample rotation have been examined.
2.0 Introduction
Although it may seem obvious, one requirement for powder diffraction is that the sample is a powder. This might sound like a ridiculous statement, but the random orientation of crystallites in the sample is vital to obtain reliable relative intensities in a one dimensional 'slice' through the Debye-Scherrer cones. This begs the question "when is a powder really a powder?" This question was examined in the context of X-ray powder diffraction in an important paper by the late Deane Smith [1]. Where the sample consists of ideal spherical particles, whether a random distribution of crystallites has been achieved depends on both the particle size, and the volume of sample being sampled by the instrument. The volume can depend on both the diffractometer geometry and the absorption of the sample.
Diameter 40μm 10μm 1μm
Crystallites / 20mm3 5.97 × 10⁵ 3.82 × 10⁷ 3.82 × 10¹⁰
No. of diffracting
crystallites 12 760 38000
Table 1. Comparison of the particle statistics for samples with different crystallite sizes [2].
For a single phase sample it can be calculated that, as a general rule, the crystallites need to be 1 micron or smaller to produce a sufficient number of
diffracting crystallites (Table 1) to approximate a random powder [1]. Most samples analyzed do not meet these standards, which limits the accuracy of any quantitative analysis. Spinning the sample does not improve the statistics greatly. Achieving a 1 micron particle size requires some effort in sample preparation, with some kind of milling or grinding. Milling can damage the microstructure of some materials (clays are particularly vulnerable) so care must be taken. Workers analyzing challenging samples frequently use a special mill produced by McCrone that was designed for sample preparation. Poor particle statistics can have consequences for the relative intensities (Table 2), and can be a source of significant error [3].
Crystallite
size range 15-20μm 5-50μm 5-15μm <5μm
Intensity
reproducibility 18.2% 10.1% 2.1% 1.2%
Table 2. Reproducibility of the intensity of the quartz (113) reflection with different crystallite sizes [3].
The effects of poor particle statistics become more obvious using microdiffraction techniques. Figure 1 and Figure 2 demonstrate this, in a comparison between the data obtained from an as-received cement sample and one that was 'micronized' for 15 minutes in isopropyl alcohol. The cement shown in Figure 1 has a particle size of around 25 microns, and is obviously much coarser from the SEM micrograph. Although 20 microns (600 mesh) is often quoted as being sufficient for X-ray powder diffraction, the 2 dimensional frame shows the sample to be very grainy from the spotty nature of the Debye-Scherrer rings. The micronized sample (Figure 2) has particles of mostly 2 microns and under, and shows nice, even intensities along the Debye-Scherrer rings.
Figure 1. Two-dimensional microdiffraction from an as-received cement samples, together with SEM micrograph. The XRD data was obtained using a 1mm
Figure 2. Two-dimensional microdiffraction from a micronized cement samples, together with SEM micrograph. The XRD data was obtained using a 1mm
monocapillary optic on a Bruker GADDS system (CoKα).
It should be obvious that good particle statistics become increasingly difficult to obtain for quantitative analysis of increasingly complex mixtures, as theoretically, each component of the mixture must have sufficient crystallites to form a random powder. Cements are complex, multi-phase systems, so Figure 2 shows that satisfactory statistics are achievable from a practical viewpoint.
Quantitative X-ray analysis in any form requires reliable peak intensities to obtain accurate results. Consequently, for years it has been recommended to reduce the particle size to the order of a micron or two. Besides particle statistics, coarse particles can have adverse effects in the form of microabsorption and preferential orientation. Some efforts can be made to improve the particle statistics by varying the experimental data collection strategy. Using a larger divergence slit is an easy way to sample a larger volume of material, although care must be taken to avoid beam-overspill. Sample rotation is often used as the main method for improving sample statistics, but in the form usually present on laboratory X-ray diffractometers it is not as effective as people often believe [4]. Rietveld analysis [5] is now the most common technique for QXRD [6] of cements as the addition of a standard is not required. Crystal structures are known for the major cement phases so it is readily applied to most circumstances. Although techniques exist for reducing preferential orientation (back-loading, etc) and correcting microabsorption [7], particle statistics have to be addressed at the data collection stage. Specialised approaches such as the use of capillaries are not widely used in the laboratory despite the excellent results that can be obtained [8]. Rietveld software usually produces estimated errors in the form of ESDs, or estimated standard deviations. Although these
errors are only estimates, they are often used in the place of statistically derived errors.
This piece of work aims to gauge the effect that particle statistics have on the analysis of cements. Both micronized and raw materials were analysed. The repeatability in mounting and re-mounting samples was studied, as well as the effect of changing divergence slit size and use of rotation. The use of multiple repeats means that real errors with confidence limits can be calculated instead of using the software-derived ESDs.
3.0 Experimental
A freshly opened sample of NIST SRM 637 Pink cap Portland cement was split into two fractions, the first was used without processing. The second was processed with a McCrone micronizing mill. The cement was transferred to the milling vessel, containing corundum grinding elements, and isopropyl alcohol (IPA) was added as a liquid phase. The sample was milled for 10 minutes; after which the slurry was removed to a petri dish and allowed to dry in a fume cupboard. After drying the micronized cement was transferred to a sealed sample bottle.
Both fractions were analysed using a Bruker D8 Advance X-ray diffractometer with CuKα. The machine was configured to a Bragg-Brentano setting with a Vantec PSD detector, motorised divergence slit and a rotating sample stage. To study the reproducibility each cement sample was mounted, run (four times; see table 2) and re-mounted twice (a total of 3 mountings per sample). Four data sets per mounting were collected with varying strategies to affect the particle statistics through changing the sample volume illumination and use of sample rotation. Repeating the data collection after re-mounting allows an actual standard deviation to be calculated, in addition to the estimated standard deviations that the Rietveld software produces.
Count times were chosen such that the peak intensities were as close as possible, despite the different slit settings. Additionally all the data sets were normalised before analysis to minimise the effect of differing intensities on the final calculated errors. The intention was that the errors from the analysis would be due to the differences in particle statistics rather than other experimental factors.
Data analysis was done with a beta version of Topas 4 from Bruker-AXS. Quantitative analysis was undertaken using the standard structures of cement phases. The use of polymorphs were explored, but their use didn’t significantly affect the result, probably due to the lower resolution of laboratory versus synchrotron data. Fundamental parameters were used to derive the instrument function including the effect of the PSD. The zero point error was determined using SRM 660a (LaB6) and subsequently fixed. In line with common practice the
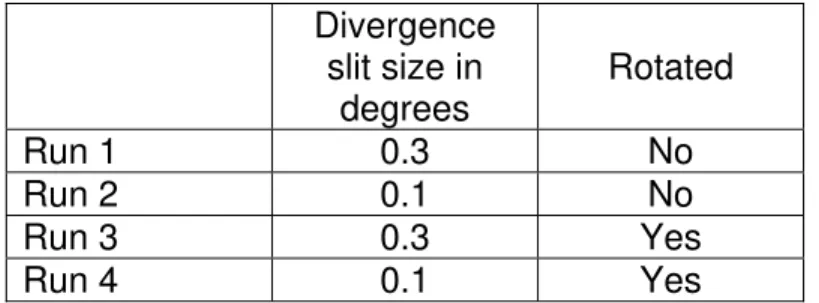
March-Dollase preferential orientation correction was used on the alite phase. Refined parameters of each phase included lattice parameters and Lorentzian size broadening. Divergence slit size in degrees Rotated Run 1 0.3 No Run 2 0.1 No Run 3 0.3 Yes Run 4 0.1 Yes
Table 3. Data collection conditions for each sample mounting
4.0 Results
Figure 3 and Figure 4 both show overlays of what in each case should be identical patterns using the same diffractometer settings, but three different sample mountings. The un-micronized sample (in Figure 3) shows significant variation in relative peak intensities. This is a matter for concern, as variability in the relative intensities will increase the errors in the derived phase fractions. However, the variability should not be surprising given the behaviour outlined in Table 2
Also note in Figure 3 that one of the repeats shows a noticeable periclase peak at 43 degrees. The relative periclase peak intensity increased greatly on decreasing the divergence slit, from 0.3 to 0.1 degrees, leading to the conclusion that a single large grain was present somewhere near the centre of the sample. Analysis of the other two repeats yielded negligible periclase. Figure 4 shows a corresponding plot for the micronized sample. There is a marked improvement in the reproducibility, with no sign of a distinct periclase reflection. Figure 5 shows the refined values for periclase for 3 repeats each for micronized and un-micronized material using the same diffractometer settings. It is immediately apparent that the micronized sample gave practically identical results in each case, whilst the un-micronized sample showed variability much greater than the calculated estimated standard deviations produced by Topas. The NIST certificate for SRM637 gives a certified periclase content of 0.6%, which is agreement with the results from the micronized material. Consequently, micronizing can have dramatic effects on the results from the minor phases.
Figure 3. Overlay of 3 patterns from un-micronized material using 0.3 degree divergence slit and no rotation. Note the presence of a noticeable periclase
reflection at about 43 degrees in only one of the patterns.
Figure 4. Overlay of 3 patterns from micronized material using 0.3º divergence slit and no rotation. The reproducibility of the whole pattern is excellent.
Dataset
1 2 3 4 5 6
MgO Phase Fract
ion (w t% ) -0.5 0.0 0.5 1.0 1.5 2.0 2.5 3.0
0.1º divergence not rotated - micronized 0.1º divergence not rotated - not micronized
Figure 5. Quantitative results for periclase. Three identical repeats of micronized and un-micronized samples. The errors shown correspond to 2σ of the ESDs. Figure 6 and Figure 7 show examples of Rietveld difference plots for micronized and un-micronized samples. Note that the Rwp residual for the micronized sample
is lower than that of the un-micronized sample.
Figure 7. Rietveld difference plot for micronized sample, Rwp = 6.6%.
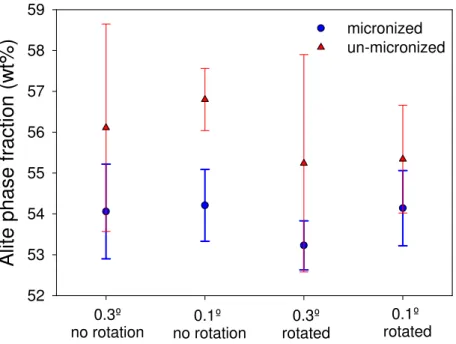
Alit
e phase f
ract
ion (w
t%
)
52 53 54 55 56 57 58 59 micronized un-micronized 0.3º no rotation 0.1º no rotation 0.3º rotated 0.1º rotatedFigure 8. Quantitative results for alite, showing the mean and 95% confidence limits for the different experimental procedures. The standard deviations are
Figure 8 shows the mean and 95% confidence limits for the alite in both the micronized and un-micronized samples. The only statistically significant difference in alite between micronized and un-micronized samples occurred in the 0.1 degree un-rotated sets, which theoretically should have the worst particle statistics. There is a distinct trend for lower alite values and reduced errors in the micronized samples. March-Dollase coefficients for the un-micronized alites were approximately 0.93 whilst those of the micronized samples were around 0.98. This is very close to a perfect powder of 1.0 [9]. Together with the peak broadening evident in the patterns from the micronized samples, it demonstrates the better quality of the powder after micronizing.
Figure 9 shows the mean and 95% confidence limits for the belite in both the micronized and un-micronized samples. There are no statistically significant differences between micronized and un-micronized samples, but in the case of the unrotated 0.1º set this is mainly due to a greatly increased error. Once again the errors are generally reduced in the micronized samples, but for belite they tend to produce higher values.
Belit
e
phase f
ract
ion (w
t%
)
24 25 26 27 28 29 30 31 micronized un-micronized 0.3º no rotation 0.1º no rotation 0.3º rotated 0.1º rotatedFigure 9. Quantitative results showing the mean and 95% confidence limits for belite using different experimental procedures. The standard deviations are
C4A
F
phase f
ract
ion (w
t%
)
3.0 3.5 4.0 4.5 5.0 5.5 6.0 micronized un-micronized 0.3º no rotation 0.1º no rotation 0.3º rotated 0.1º rotatedFigure 10. Quantitative results showing the mean and 95% confidence limits for C4AF using different experimental procedures. The standard deviations are
statistical as opposed to ESDs
C3A
phase f
ract
ion (w
t%
)
3.4 3.6 3.8 4.0 4.2 4.4 4.6 4.8 5.0 5.2 5.4 micronized un-micronized 0.3º no rotation 0.1º no rotation 0.3º rotated 0.1º rotatedFigure 11. Quantitative results showing the mean and 95% confidence limits for C3A using different experimental procedures. The standard deviations are
Figure 10 shows quantitative results for the C4AF. Although there is significantly more scatter in the mean of the un-micronized samples, the differences are not statistically significant. This is in part due to the large errors associated with the un-micronized results with a 0.1º divergence slit.
Figure 11 shows the quantitative results for the C3A. Here is the only case where the micronized and un-micronized samples show statistically different results with all of the diffractometer settings. The micronized samples consistently show approximately 0.8% lower C3A values than the un-micronized samples.
5.0 Discussion and conclusions
In terms of the major cement phases, the only one that consistently gave statistically different results was the C3A. In many instances this was only because of the large errors in the un-micronized results. The alite did yield statistically different results where a 0.1 degree divergence slit was used without rotation. This particular combination should theoretically produce the poorest statistics, so is not surprising.
For alite, the micronized samples have consistently lower mean values whilst the belite values were higher. Dramatic differences can occur in the minor phases. It appears as though large grains of periclase were present in the SRM. Micronizing successfully homogenized the sample, producing consistent results for periclase, despite its low abundance. However, the un-micronized sample have wildly varying results, depending on whether a grain was present in the area illuminated by the X-rays.
In many instances the standard deviations calculated from three repeats of the micronized sample were lower than the ESDs calculated by Topas. This suggests that ESDs are not always a good indicator of the accuracy that can be obtained using Rietveld analysis for quantification of cements.
In conclusion, it would appear as though Rietveld analysis of un-micronized cements will give results for the two major phases that are the same within 95% confidence limits of a micronized sample. However, the errors are significantly higher and the divergence slit can have an additional affect on the errors. The results for C3A show a statistically significant difference between the micronized and un-micronized sample. Micronizing can have a major affect on the results of the minor phases. The micronized sample produced consistent results, whilst the un-micronized sample produced different results when remounted. It can be noted that the calculated ESDs for the periclase in the un-micronized sample were relatively small despite the result being obviously wrong.
Acknowledgements
Dr. Arnt Kern, of Bruker-AXS, for giving us the continued opportunity to beta-test Topas.
References
1. D.K.Smith, Particle Statistics and Whole-Pattern Methods in Quantitative X-ray Powder Diffraction Analysis, Powder Diffr., 16 (4) (2001) 186-191 2. D.K.Smith, Advances in X-Ray Analysis, 35 (1992) 1-15
3. H.P.Klug & L.E.Alexander, X-ray diffraction procedures for polycrystalline and amorphous materials, Wiley, New York, 1974.
4. R.J.Hill, I.C.Madsen, Sample preparation, instrument selection and data collection, in: W.I.F.David, K.Shankland, L.B.McCusker, Ch.Baerlocher (Eds) , Structure Determination from Powder Diffraction Data, Oxford University Press, Oxford, UK, 2002, pp. 98-117
5. H.M.Rietveld, Line profiles of neutron powder-diffraction peaks for structure refinement., Acta Cryst., 22 (1967) 151-152
6. R.J.Hill, C.J.Howard, Quantitative phase analysis from neutron powder diffraction data using the Rietveld method., J.Appl.Crystallogr., 20 (1987) 467-474
7. G.W.Brindley, The Effect of Grain and Particle Size on X-ray reflections from Mixed Powders and Alloys, Considered in Relation to the Quantitative Determination of Crystalline Substances by X-ray Methods, Philos.Mag., 3 (1945) 347-369
8. L.D.Mitchell, J.Margeson, P.S.Whitfield, Quantitative Rietveld analysis of hydrated cementitious systems, Powder Diffr., 21 (2) (2006) 111-113 9. W.A.Dollase, Correction of Intensities for Preferred Orientation in Powder
Diffractometry: Application of the March Model, J.Appl.Crystallogr., 19 (1986) 267-272
![Table 1. Comparison of the particle statistics for samples with different crystallite sizes [2]](https://thumb-eu.123doks.com/thumbv2/123doknet/14171204.474623/3.918.150.785.877.1003/table-comparison-particle-statistics-samples-different-crystallite-sizes.webp)