Publisher’s version / Version de l'éditeur:
Vous avez des questions? Nous pouvons vous aider. Pour communiquer directement avec un auteur, consultez la première page de la revue dans laquelle son article a été publié afin de trouver ses coordonnées. Si vous n’arrivez Questions? Contact the NRC Publications Archive team at
PublicationsArchive-ArchivesPublications@nrc-cnrc.gc.ca. If you wish to email the authors directly, please see the first page of the publication for their contact information.
https://publications-cnrc.canada.ca/fra/droits
L’accès à ce site Web et l’utilisation de son contenu sont assujettis aux conditions présentées dans le site LISEZ CES CONDITIONS ATTENTIVEMENT AVANT D’UTILISER CE SITE WEB.
Technical Report (National Research Council of Canada. Institute for Ocean Technology); no. TR-2007-23, 2007
READ THESE TERMS AND CONDITIONS CAREFULLY BEFORE USING THIS WEBSITE.
https://nrc-publications.canada.ca/eng/copyright
NRC Publications Archive Record / Notice des Archives des publications du CNRC :
https://nrc-publications.canada.ca/eng/view/object/?id=eead3a66-5e91-46ea-bcda-9587fa9dfa31 https://publications-cnrc.canada.ca/fra/voir/objet/?id=eead3a66-5e91-46ea-bcda-9587fa9dfa31
NRC Publications Archive
Archives des publications du CNRC
For the publisher’s version, please access the DOI link below./ Pour consulter la version de l’éditeur, utilisez le lien DOI ci-dessous.
https://doi.org/10.4224/8896048
Access and use of this website and the material on it are subject to the Terms and Conditions set forth at
Assessment of the performance of 1:7 scale model liferafts under tow by a carriage and fast rescue craft
DOCUMENTATION PAGE REPORT NUMBER
TR-2007-23
NRC REPORT NUMBER DATE
August 2007 REPORT SECURITY CLASSIFICATION
Unclassified
DISTRIBUTION Unlimited TITLE
ASSESSMENT OF THE PERFORMANCE OF 1:7 SCALE MODEL LIFERAFTS UNDER TOW BY A CARRIAGE AND FAST RESCUE CRAFT
AUTHOR(S)
J. Power and A. Simões Ré
CORPORATE AUTHOR(S)/PERFORMING AGENCY(S)
Institute for Ocean Technology, National Research Council St. John’s, NL PUBLICATION
SPONSORING AGENCY(S)
Search and Rescue New Initiative Fund (SAR-NIF) IOT PROJECT NUMBER
42_2064_16
NRC FILE NUMBER KEY WORDS
Liferaft, Model, FRC, RAO Tow Force
PAGES 49 FIGS. 61 TABLES 3 SUMMARY
The purpose of this report is to examine the performance of 1:7 scale models of a commercially available 16, 42, and 150 person life raft undertow by a two carriage and model Fast Rescue Craft (FRC). The use of models allows us to test the performance of the life rafts in weather conditions that would be too extreme to test in the field. The goal for this project is to use data collected at model scale to help fill in the knowledge gaps that
currently exist in the operation of life rafts in weather conditions. This increase in knowledge would benefit marine operators, the regulatory bodies, the search and rescue planners, the training providers, and the manufactures in developing new designs.
ADDRESS National Research Council Institute for Ocean Technology Arctic Avenue, P. O. Box 12093 St. John's, NL A1B 3T5
National Research Council Conseil national de recherches Canada Canada Institute for Ocean Institut des technologies
Technology océaniques
ASSESSMENT OF THE PERFORMANCE OF 1:7 SCALE MODEL LIFERAFTS UNDER TOW BY A CARRIAGE AND FAST RESCUE CRAFT.
TR-2007-23
J. Power and A. Simões Ré August 2007
Table of Contents
Table of Contents... i
List of Figures... ii
List of Tables ... vi
1.0 Introduction... 1
2.0 Project Objectives and Scope... 2
3.0 Test Program and Test Setup ... 3
3.2 Model Life Rafts ... 3
3.3 Model FRC... 5 3.4 Sea Anchor... 6 3.5 Wind... 6 4.0 Instrumentation ... 8 4.2 Data Acquisition ... 8 4.2 Co-ordinate Systems ... 9 5.0 Test Program... 10 5.1 Test Methodology ... 14
6.0 Results and Discussion ... 17
6.1 Calm Water Tows ... 17
6.2 Tow in Regular Waves... 20
6.2.1 Heave RAO’s ... 20
6.2.2 Pitch RAO’s ... 28
6.2.3 Effects of wave slope, frequency, and towing speed on mean tow force. ... 36
6.3 Drift Tests ... 43
7.0 Conclusions... 47
List of Figures
Figure 3.1: 1 Drawing of Institute for Ocean Technology’s clear water tow tank (all
distances in meters)... 3
Figure 3.2: IOT 721, 1:7 scale model of a 16 person life raft with a wire frame and Qualysis optical markers attached. ... 4
Figure 3.3: IOT 722, a 1:7 scale model of a 42 person life raft with a wire frame and Qualysis optical markers attached ... 4
Figure 3.4: IOT 723, 1:7 scale model of a 150 person life raft with a wire frame and Qualysis optical markers attached as well as a wind anemometer ... 5
Figure 3.5: Model IOT 706; a 1:7 model scale replica of a Zodiac Hurricane 733... 6
Figure 3.6: Photo of sea anchor used on liferaft models IOT 721 and 722. ... 6
Figure 3.7: Wind fans mounted underneath the main tow carriage in the CWTT... 7
Figure 5.1 :IOT 721 model raft, layout of even ballast conditions (squares designate ballast weight position)... 11
Figure 5.2 :IOT 721 model raft, layout of uneven ballast conditions (squares designate ballast weight position)... 11
Figure 5.3: IOT 722 model raft, layout of even ballast conditions (squares designate ballast weight position)... 12
Figure 5.4: IOT 722l raft, layout of uneven ballast conditions (squares designate weight ballast position)... 12
Figure 5.5: IOT 723 model raft, layout of even ballast conditions (squares designate ballast weight position)... 13
Figure 5.6: IOT 723 model raft, layout of uneven ballast conditions (squares designate ballast weight position)... 13
Figure 5.7: Test Setup... 15
Figure 5.8: Drift Test Setup ... 16
Figure 6.1: Baseline case (Even ballast, Inflated Floor (N/A IOT 723), Drogue Deployed) resistance between the model life rafts towed by the carriage and IOT 706 (model FRC). ... 17
Figure 6.2: Effects of sea anchor deployment on model life raft tow force under tow by the carriage... 18 Figure 6.3: Effect of ballast condition on model life raft tow force under tow by the carriage... 18 Figure 6.4: Effects of floor inflation on model life raft tow force under tow by the
carriage (IOT 723 is not listed due to not having an inflatable floor). ... 19 Figure 6.5: IOT 721 Heave RAO in 1:15 slope waves under tow by the main tow carriage in varying wave frequencies. ... 22 Figure 6.6: IOT 721 Heave RAO in 1:15 slope waves under tow by IOT 706 in varying wave frequencies... 22 Figure 6.7: IOT 721Heave RAO in varying equivalent Beaufort conditions under tow by main carriage... 23 Figure 6.8: IOT 721Heave RAO in varying equivalent Beaufort conditions under tow by IOT 706... 23 Figure 6.9: IOT 722 Heave RAO in 1:15 slope waves under tow by the main tow carriage in varying wave frequencies. ... 24 Figure 6.10: IOT 722 Heave RAO in 1:15 slope waves under tow by IOT 706 in varying wave frequencies... 24 Figure 6.11: IOT 722Heave RAO in varying equivalent Beaufort conditions under tow by main carriage... 25 Figure 6.12: IOT 722Heave RAO in varying equivalent Beaufort conditions under tow by IOT 706... 25 Figure 6.13: IOT 723 Heave RAO in 1:15 slope waves under tow by the main tow
carriage in varying wave frequencies. ... 26 Figure 6.14: IOT 723 Heave RAO in 1:15 slope waves under tow by IOT 706 in varying wave frequencies... 26 Figure 6.15: IOT 723 Heave RAO in varying equivalent Beaufort conditions under tow by main carriage... 27 Figure 6.16: IOT 723 Heave RAO in varying equivalent Beaufort conditions under tow by IOT 706... 27
Figure 6.17: IOT 721 Pitch RAO in 1:15 slope waves under tow by the main tow
carriage... 30 Figure 6.18 IOT 721 Pitch RAO in 1:15 slope waves under tow by IOT 706. ... 30 Figure 6.19: IOT 721 Pitch RAO in varying equivalent Beaufort conditions under tow by main carriage... 31 Figure 6.20: IOT 721 Pitch RAO in varying equivalent Beaufort conditions under tow by IOT 706... 31 Figure 6.21: IOT 722 Pitch RAO in 1:15 slope waves under tow by the main tow
carriage... 32 Figure 6.22: IOT 722 Pitch RAO in 1:15 slope waves under tow IOT 706. ... 32 Figure 6.23: IOT 722 Pitch RAO in varying equivalent Beaufort conditions under tow by main carriage... 33 Figure 6.24: IOT 722 Pitch RAO in varying equivalent Beaufort conditions under tow by IOT 706... 33 Figure 6.25: IOT 723 Pitch RAO in 1:15 slope waves under tow by the main tow
carriage... 34 Figure 6.26: IOT 723 Pitch RAO in 1:15 slope waves under tow IOT 706. ... 34 Figure 6.27: IOT 723 Pitch RAO in varying equivalent Beaufort conditions under tow by main carriage... 35 Figure 6.28: IOT 723 Pitch RAO in varying equivalent Beaufort conditions under tow by IOT 706... 35 Figure 6.29: Mean tow force plus 2 standard deviations for IOT 721 across wave
frequency at varying tow speeds under tow by the carriage... 37 Figure 6.30: Mean tow force plus 2 standard deviations for IOT 721 across wave
frequency at varying tow speeds under tow by IOT 706. ... 37 Figure 6.31: Mean tow force plus 2 standard deviations for IOT 722 across wave
frequency at varying tow speeds under tow by the carriage... 38 Figure 6.32: Mean tow force plus 2 standard deviations for IOT 722 across wave
Figure 6.33: Mean tow force plus 2 standard deviations for IOT 723 across wave
frequency at varying tow speeds under tow by the carriage... 39 Figure 6.34: Mean tow force plus 2 standard deviations for IOT 723 across wave
frequency at varying tow speeds under tow by IOT 706. ... 39 Figure 6.35 Mean tow force plus 2 standard deviations for IOT 721 across weather
conditions at varying tow speeds under tow by the main carriage. ... 40 Figure 6.36 Mean tow force plus 2 standard deviations for IOT 721 across weather
conditions at varying tow speeds under tow by IOT 706. ... 40 Figure 6.37: Mean tow force plus 2 standard deviations for IOT 722 across weather conditions at varying tow speeds under tow by the main carriage. ... 41 Figure 6.38: Mean tow force plus 2 standard deviations for IOT 722 across weather conditions at varying tow speeds under tow by IOT 706. ... 41 Figure 6.39: Mean tow force plus 2 standard deviations for IOT 723 across weather conditions at varying tow speeds under tow by the main carriage. ... 42 Figure 6.40: Mean tow force plus 2 standard deviations for IOT 723 across weather conditions at varying tow speeds under tow by IOT 706. ... 42 Figure 6.41: IOT 721 heave RAO during drift tests from Beaufort 4-6 equivalent
conditions... 44 Figure 6.42: IOT 721 pitch RAO during drift tests from Beaufort 4-6 equivalent
conditions... 44 Figure 6.43: IOT 722 heave RAO during drift tests from Beaufort 4-6 equivalent
conditions... 45 Figure 64.4: IOT 722 pitch RAO during drift tests from Beaufort 4-6 equivalent
conditions... 45 Figure 6.45: IOT 723 heave RAO during drift tests from Beaufort 4-6 equivalent
conditions... 46 Figure 6.46: IOT 723 pitch RAO during drift tests from Beaufort 4-6 equivalent
conditions... 46
List of Tables
Table 3.1: Signal acquisition from model life rafts. ... 8 Table 4.1: Summary of raft and weather conditions tested. ... 10 Table 4.2 Full scale Beaufort wind speeds and their model scale equivalents. ... 16
1.0 Introduction
Large and small ships travelling across the open ocean can sometimes meet with disastrous results. While many large ships and vessels are designed to withstand
extremely hostile weather, they are not invincible to the elements. As a result, these ships and vessels can become compromised and the order to abandon ship can be given. In order to further increase the chance of survival, ships are equipped with inflatable liferafts that can be deployed by a variety of methods. Even though liferafts are
considered an extremely important piece of survival equipment, there currently exists a knowledge gap between regulations and the performance of these life saving appliances in rough weather. Current IMO regulations require liferafts to be certified for calm water
conditions only, which results in their weather performance being largely unknown.
It is not always possible to test full-scale life rafts in rough sea states as it can become extremely hazardous to the personnel conducting the trials, and to the equipment. In order to help determine the performance of liferafts in sea states other than calm, scaled models are tested safely in equivalent weather conditions.
The purpose of this report is to examine the operation performance of 1:7 scale models of commercially available 16, 42, 150 person life rafts, and a Fast Rescue Craft (FRC). The goal of the project is to collect data that can be used to fill in the current knowledge gap, which would benefit the marine operators, the regulatory bodies, the search and rescue planners, the training providers, and the manufactures in developing new and safer designs.
2.0 Project Objectives and Scope
The overall objectives of the experimental study are to examine the effects of environmental and raft variables on life raft motions and tow force on a 1:7 scale model of a 16, 42, 150 person life raft and a FRC. The environmental variables included regular waves with varying frequencies and slopes, irregular waves of varying spectrum, and wind speeds equivalent to Beaufort levels of 4, 5, 6, 7. The raft variables included ballast distribution, sea anchor deployment, and floor inflation. Listed below are the specific objectives tested for:
1. Examine the effects of sea anchor deployment, floor inflation, ballast distribution and tow speeds on tow force, accelerations, and motions for all life rafts in calm water conditions.
2. Examine the effects of wave frequency, wave slope, wind speed, and tow speed on tow force, accelerations, and motions for all life rafts.
3. Examine the effects of towing with the main tow carriage vs. towing with the model FRC on tow force, accelerations, and motions for all life rafts.
4. Compare the life raft RAO and tow force values between all the model rafts. The present series of tow tests were conducted using custom fabricated 1:7 scale models of typically SOLAS approved 16 (Model Number: IOT 721), 42 (Model Number: IOT 722), 150 (Model Number: IOT 723) person life raft and FRC (Model Number: IOT 706). The tests were carried out in uni-directional waves and wind with the model rafts being towed by the main carriage and IOT 706 in the Clear Water Tow Tank (CWTT) at the Institute For Ocean Technology (IOT), part of the National Research Council of Canada. The towing effects of the main carriage on the models is similar to their full scale counterparts being towed by a large vessel (an infinite mass) as opposed to a small craft, such as a rigid inflatable boat, in which case the tow load would affect the source of propulsion. The different types of tows relate to the effects on the rafts being towed by a large vessel or by a rigid hull inflatable boat (RHIB) or FRC.
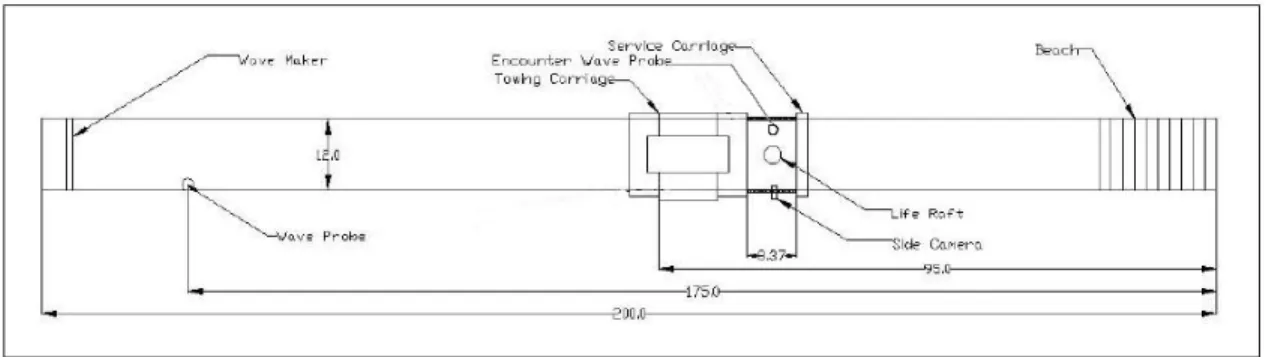
3.0 Test Program and Test Setup 3.1 Test Facility
The test program was conducted in the CWTT located at IOT. The tank itself is 200m long, 12m wide, and 7m deep. The tank is equipped with two carriages: the main towing carriage, and a smaller service carriage that can be connected to the main one. The main towing carriage is capable of travelling down the tank up to a maximum speed of 10m/s. Fans were installed underneath the main carriage to simulate the effects of wind on the models as they travelled down the tank. The main carriage itself id equipped with a VMS and Windows based distributed client/server data acquisition system. Located on the far end of the tow tank is a dual-flap wave maker that is capable of generating regular and irregular uni-directional waves from frequencies ranging from 0.1 Hz to 1.8 Hz with a maximum significant wave amplitude of 0.5m. Located on the opposite end of the tank is a parabolic beach that is used for wave absorption.
Figure 3.1: 1 Drawing of Institute for Ocean Technology’s clear water tow tank (all distances in meters).
3.2 Model Life Rafts
Model life rafts IOT 721, IOT 722, and IOT 723 were 1:7 scale models of typical SOLAS approved 16, 42, and 150 person life rafts, respectively, manufactured by
Newfoundland Marine Safety Systems and used for these series of tests. A wire frame was attached to the rafts (see diagram) to allow for placement of the optical tracking system (Qualysis) markers. Each model life raft was equipped with miniature stability pockets; 8 on IOT 721, 16 on IOT 722, 66 on IOT 723.
Figure 3.2: IOT 721, 1:7 scale model of a 16 person life raft with a wire frame and Qualysis optical markers attached.
Figure 3.3: IOT 722, a 1:7 scale model of a 42 person life raft with a wire frame and Qualysis optical markers attached
Figure 3.4: IOT 723, 1:7 scale model of a 150 person life raft with a wire frame and Qualysis optical markers attached as well as a wind anemometer
3.3 Model FRC
The model FRC, IOT 706, was a custom built 1:7 scale model of a Zodiac Hurricane 733. The hull and main body of IOT 706 was designed and fabricated at IOT. The model outboard motors used in the model were purchased from a local hobby store, with custom modifications made to extend their drive shafts. The control mechanisms for the FRC were assembled at IOT using off the shelf components. All software used to control the model was developed in house at IOT.
Figure 3.5: Model IOT 706; a 1:7 model scale replica of a Zodiac Hurricane 733.
3.4 Sea Anchor
A 1:7 scale model of a conventional drogue was used for all testing. The sea anchor’s diameter measured 5.5cm across the opening, and was 6cm long from the opening to the bottom of the cone. This sea anchor was used on both IOT 721 and IOT 722. A larger drogue was used for IOT 723. This sea anchor measured (10.2 cm in diameter and 11.3cm in lengthz).
Figure 3.6: Photo of sea anchor used on liferaft models IOT 721 and 722.
3.5 Wind
Wind was generated by two banks of six analog controlled fans mounted side by side underneath the main tow carriage. Each fan was powered by a DC motor and had a blade diameter of 530mm. Mounted on the fans were horizontal louvers that allowed the
wind flow to be directed upward or downward. The louvers were positioned at an angle of approximately 0° down from the horizontal plane. The fans were controlled by an operator on the main tow carriage and could be set to produce wind speeds up to and over 8m·s-1.
Figure 3.7: Wind fans mounted underneath the main tow carriage in the CWTT.
4.0 Instrumentation 4.2 Data Acquisition
Three data acquisition systems were used in this test program. One system was used to collected from the main tow carriage, one was used to collect signals from the rafts, while the other was used to collect signals from the FRC. The systems in the rafts and FRC used a PIC (Programmable Integrated Circuit) acquisition system that were connected to a radio transmitter. The radio transmitter allowed the signals collected from the raft and FRC to be sent wirelessly to the main tow carriage and then acquired by GDAC (GEDAP (Generalized Experimental Control and Data Acquisition Package) Data Acquisition and Control) client-server acquisition system. On the main carriage, the data acquisition system was tied directly into the GDAC client-server acquisition system.
The following table shows the signals collected on the rafts, FRC and main tow carriage:
Table 3.1: Signal acquisition from model life rafts.
Acquisition Signal Instrumentation Sample Rate
Raft surge, sway accelerations (-10g to
+10g) and heave accelerations (-8g to +8g). Yaw, pitch and roll rates
(-300 deg/s to +(-300 deg/s) Motion Pak II 6 degrees-of-freedom motion sensor 260 Hz Raft
Sea Anchor Drag Load Cell 260 Hz FRC surge, sway
accelerations (-10g to +10g) and heave accelerations (-8g to +8g). Yaw, pitch and roll rates
(-300 deg/s to +(-300 deg/s) Motion Pak II 6 degrees-of-freedom motion sensor 260 Hz FRC
Tow Force Load Cell 260 Hz Carriage Position Main Carriage
Sensors
50 Hz Carriage Speed Main Carriage
Sensors
50 Hz Encounter Wave Probe Capacitance Wave
Probe
50 Hz Upstream Wave Probe Capacitance Wave
Probe 50 Hz Main Tow
Carriage
Raft surge, sway, and heave displacements. Yaw,
pitch, and roll angles
Qualysis Optical Tracking System
50 Hz Wind Drive Volt Meter 50 Hz Wind Speed Wind anemometers
(6) 50 Hz
4.2 Co-ordinate Systems
Two co-ordinate systems were used for this experiment. The first was a right hand global co-ordinate system relative to the main towing carriage used for Qualysis. The positive x-axis is defined as parallel to the tow direction, down the tank towards the wave makers. The positive y-axis is defined as directly to port of the tow direction by 90° counter clockwise. The positive z-axis is defined as pointing up. The second co-ordinate system was a local right hand co-ordinate system within the raft with its origin located directly in the geometric center of the model used to place instrumentation and ballast. The x, y, and z were defined the same as that used for the global Qualysis system.
5.0 Test Program
The test program was divided into 4 main components:
1. Tow tests with the main carriage for all the model rafts in calm water with varying configurations.
2. Tow tests with the main carriage for all the rafts in regular and irregular waves of varying frequency and slope, and in varying Beaufort equivalent
conditions.
3. Un-tethered drift tests for all the model rafts in irregular waves, and in Beaufort equivalent wind force of 4, 5, and 6.
4. Tow test with the model FRC on all the rafts in regular and irregular waves, and Beaufort equivalent levels of 4, 5, and 6.
For the regular wave conditions, the wave frequencies varied from 0.45 to 1.15 Hz in intervals of 0.1 Hz, at slopes of 1:10, 1:15, and 1:20. The wind speed ranged from Beaufort 4 to 6 wind force.
Table 4.1: Summary of raft and weather conditions tested.
Weight Distribution Floor Inflation (IOT 721 and 722 only)
Sea Anchor Calm Water
Regular Waves
Drift Test
Even Inflated Yes Y Y Y
Even Inflated No Y
Even Un-inflated Yes Y Even Un-inflated No Y Uneven Inflated Yes Y Uneven Inflated No Y Uneven Un-inflated Yes Y Uneven Un-inflated No Y
All model rafts were tested at all wave frequencies and slopes for regular waves, in both tow conditions; the carriage and the FRC. The only modifications made to the waves were in Beaufort 6 conditions, which had the wave maker board span decreased from 100% to 87%. The wave heights at Beaufort 6 were too high to clear the fans underneath the tow carriage, and as a result had to have their height decreased.
Small lead weights weighing about 142g each were used as ballast for IOT 721 and IOT 722. Each weight had Velcro on its underside that allowed for easy and secure attachment to the raft. For IOT 723, similar lead weights, each weighing about 220g, were used. The model rafts were ballasted to 75% capacity of the total compliment : 12
occupants, weighing 75kg each, in IOT 721, 31 in IOT 722, and 113 in IOT 723. The ballast weights were simply repositioned in the rafts to switch from “even ballast’ to “uneven ballast’ conditions.
Direction of Tow
Figure 5.1 :IOT 721 model raft, layout of even ballast conditions (squares designate ballast weight position)
Direction of Tow
Figure 5.2 :IOT 721 model raft, layout of uneven ballast conditions (squares designate ballast weight position)
Direction of Tow
Figure 5.3: IOT 722 model raft, layout of even ballast conditions (squares designate ballast weight position)
Direction of Tow
Figure 5.4: IOT 722l raft, layout of uneven ballast conditions (squares designate weight ballast position)
Figure 5.5: IOT 723 model raft, layout of even ballast conditions (squares designate ballast weight position)
Figure 5.6: IOT 723 model raft, layout of uneven ballast conditions (squares designate ballast weight position)
5.1 Test Methodology
After completion of the standard Institute for Ocean Technology wind and wave calibration procedures, the investigation of the performance of the model life rafts began.
Prior to the start of any testing in the morning, each raft would have all of its chambers inflated to 1.0 PSI. For IOT 721 and IOT 722, the floor was inflated to 0.5 psi. IOT 723 did not have an inflatable floor. A new battery was placed in the Motion Pak unit each morning as well. The raft models were then secured to both its tow line (connected to the main tow carriage by a post), and its tag line (connected to the service carriage). The tag line on the models remained slack during all tow tests up the tank. Tests were then performed according to the test matrix. Once a run was completed up the tank, the main carriage would travel back down the tank to its home position. A 10-15 minute wait period was established in between each test run to allow the tank to “settle” and have any remaining waves dissipate.
For FRC tow tests, the tow post on the main tow carriage was removed, and the raft attached via the tow line to the free running FRC model. The raft itself was still attached to the tag line connected to the service carriage, which remained slack during runs up the tank. The purpose of the tag line in the FRC tow tests was a safety measure in order to ensure the FRC and model did not go to far ahead and hit the bank of wind fans underneath the main tow carriage
Two wave proves were utilized during the testing phase. One was located at a fixed position 175m down the tow tank while the other was attached to the service carriage roughly in the same transverse plane as that of the centre of the life raft.
Two banks of six wind fans were installed underneath the main tow carriage. The positioning of the fans allowed them to generate wind directly onto the rafts. A bank of wind anemometers were connected to the service carriage and placed in the same horizontal plane as the model life raft.
During the testing programs, aluminium frames, used as spacing bars, connected the main tow carriage and the service carriage to each other. This allowed the carriage to move together up and down the tank. This also ensured that the wave probe mounted on the service carriage stayed in the same transverse plane as the model life raft during testing. A 4.29m tow line (30m full scale) was used in the tows. When each experimental run was concluded, the main marriage would move back down (from the wave maker end) towards the beach to initiate another run after allowing the water in the tank to settle for about 10-15 minutes. Four different video views were used to record video of the models during each run. One camera was mounted on the side of the tank on one of the spacer bars in the horizontal plane of the life raft. Another video camera was mounted directly in front of the raft high on the main tow carriage looking down. The third and fourth cameras were mounted to the left and right of the center line camera.
Figure 5.7: Test Setup
Drift tests on the model life rafts commenced at the end of the tank closest to the wave makers. As the raft would drift down the tank, the operator of the main tow carriage used the side and forward cameras to adjust the speed of the carriage to match the raft drift. This ensured that the raft remained in the area between the two carriages at all times and stayed in the field of view of the Qualysis optical tracking system. The raft models were attached to both spacer bars using a series of light tag lines that were left slack during the tests. These tag lines allowed for the raft to be pulled back towards the center of the tank if it drifted over out of the view of Qualysis. While this method of positional re-adjustment is obviously not a “true” drift per se, the method allowed for the drift test trials to have a longer duration and be able to see the performance of the raft over a greater time period.
Figure 5.8: Drift Test Setup
Table 4.2 Full scale Beaufort wind speeds and their model scale equivalents.
Beaufort Level Wind Speed m/s (Full Scale)
Wind Speed m/s (Model Scale)
4 7.14 2.72
5 9.69 3.69
6.0 Results and Discussion
All speeds results presented in this section are given in meters per second (m/s).
6.1 Calm Water Tows
0.00 2.00 4.00 6.00 8.00 10.00 12.00 14.00 16.00 0.00 0.10 0.20 0.30 0.40 0.50 0.60 0.70 Speed (m/s) Tow Force (N)
IOT 721 Carriage Tow IOT 722 Carriage Tow IOT 723 Carriage Tow IOT 721 IOT 706 Tow IOT 722 IOT 706 Tow IOT 723 IOT 706 Tow
Figure 6.1: Baseline case (Even ballast, Inflated Floor (N/A IOT 723), Drogue Deployed) resistance between the model life rafts towed by the carriage and IOT 706 (model FRC).
0.00 2.00 4.00 6.00 8.00 10.00 12.00 14.00 16.00 0.00 0.10 0.20 0.30 0.40 0.50 0.60 0.70 Speed (m/s) Tow Forc e (N)
IOT 721 No Sea Anchor IOT 721 Sea Anchor IOT 722 No Sea Anchor IOT 722 Sea Anchor IOT 723 No Sea Anchor IOT 723 Sea Anchor
Figure 6.2: Effects of sea anchor deployment on model life raft tow force under tow by the carriage. 0.00 2.00 4.00 6.00 8.00 10.00 12.00 14.00 16.00 0.00 0.10 0.20 0.30 0.40 0.50 0.60 0.70 Speed (m/s) Tow Force (N)
IOT 721 Even Ballast IOT 721 Uneven Ballast IOT 722 Even Ballast IOT 722 Uneven Ballast IOT 723 Even Ballast IOT 723 Uneven Ballast
Figure 6.3: Effect of ballast condition on model life raft tow force under tow by the carriage.
0.00 2.00 4.00 6.00 8.00 10.00 12.00 14.00 16.00 0.00 0.10 0.20 0.30 0.40 0.50 0.60 0.70 Speed (m/s) Tow Force (N) IOT 721 Inflated IOT 721 Uninflated IOT 722 Inflated IOT 722 Uninflated
Figure 6.4: Effects of floor inflation on model life raft tow force under tow by the carriage (IOT 723 is not listed due to not having an inflatable floor).
As to be expected, IOT 723 produced the greatest tow force of all the model life rafts when towed in the baseline case. IOT 723 had ~4 times the tow force as IOT 721 at a speed of 0.58 m·s-1 for the carriage tows. Tows with IOT 706 produced different results, for IOT 721 and IOT 722, compared to runs with the carriage. IOT 721 had increased tow force resistance at 3 knots while under tow by IOT 706 compared to the carriage tows. IOT 722 had double the tow force for the FRC model.
The effect of drogue deployment on all the model life rafts was most pronounced at the higher tow speeds. At the 0.19 m·s-1 tow speed, the effect of sea anchor deployment
is negligible for all rafts. At the top tow speed of 0.58 m·s-1, the effect is much more evident, with IOT 722 and IOT 723 showing the greatest increases in tow force when the sea anchor is deployed. For IOT 721 and IOT 722, the uneven ballast condition produced more tow force when compared to the even condition across all speeds. This trend does not hold true for IOT 723, as at the tow speeds of 0.19 and 0.38 m·s-1, the even ballast condition produces more tow force. However at the top speed of 0.58 m·s-1, the uneven ballast condition produces more tow force than the even condition. The floor inflation condition for IOT 721 and IOT 722 had a minimal effect on tow load. The effect of having the floor inflated is negligible at the lowest tow speed, while at the top speed, the effect is seen as being ~ 1N difference in force for both rafts.
The small differences observed in the tow loads (<1N) may be the result of experimental uncertainty. As a result, the changing of the ballast conditions and floor inflation states have negligible effects on the tow loads generated by the rafts. These loads reported were at the lower range for the loads cells, which contribute to the
uncertainty in the results. The models themselves were also not completely air tight, and lose inflation pressure during the testing program, which may have affected the tow loads.
6.2 Tow in Regular Waves
All rafts were towed in unidirectional regular waves with frequencies ranging from 0.45 to 1.15 Hz. The rafts were also towed in simulated sea states equivalent to Beaufort 4, 5, and 6 with slopes of 1:10, 1:15, and 1:20. All tests in regular waves were performed towed with both the main tow carriage and the model FRC.
6.2.1 Heave RAO’s
The heave response amplitude operator (RAO) is a non-dimensionalised value obtained by dividing the amplitude of the model by the amplitude of the encounter wave plotted as a function of encounter frequency. Heave RAO’s were calculated using the following formula:
Heave RAO = Heave/ζ0
Where:
Heave= Linear motion amplitude of the raft (m) ζ0 = Wave amplitude (m)
The encounter frequency is defined as the frequency at which the model
encounters the waves. Since the model is travelling in head seas (relative to the waves), the encounter frequency will be higher than the wave frequency generated by the wave makers. Therefore:
ωe = ω – ((ω2·U)/g)·cos µ
fe = 1/(2π/ωe)
Where: ωe = Encounter Frequency (rad/sec)
ω = Wave Frequency (rad/sec)
U = Model speed (m·s-1)
µ = Heading angle (180° for head seas)
g = Acceleration due to gravity (9.81 m·s-2)
In the varying wave frequency tows, IOT 721’s heave RAO values decreased when under tow by both the carriage and IOT 706, however the decrease was much larger when towed by the former as compared to the latter. In the varying weather conditions, carriage tows of IOT 721 resulted in a fairly consistent heave RAO values for all the tests. Towing speed did not seem to affect the heave RAO values. Not all weather
conditions could be safely completed when towing IOT 721 with IOT 706 at low speeds, as a result there are some Beaufort conditions for which data was not acquired. At low tow speeds, there was not enough power being generated by IOT 706 to safely control the tow. For the conditions that do have data, the heave RAO values increases to
approximately 1 as the Beaufort conditions increase. Speed again does not seem to affect the heave RAO values.
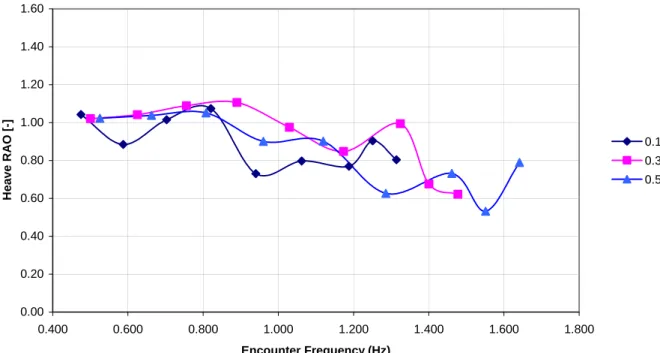
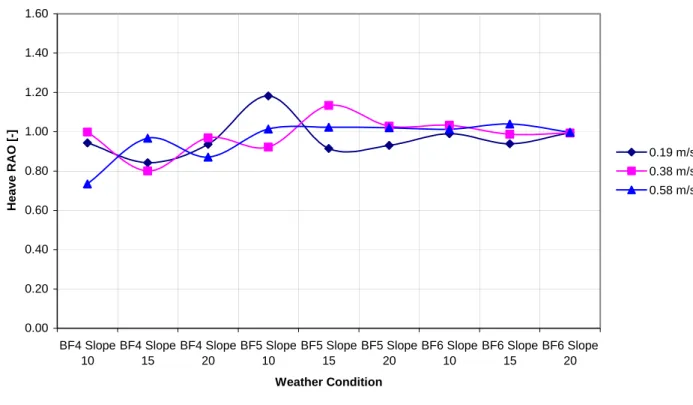
IOT 722 responded in a similar fashion as IOT 721. As the encounter frequency of the waves increased, the heave RAO values for IOT 722 decreased, ranging from 1.0 at the lowest frequency, to ~0.8 at the highest frequencies during carriage tows. The same trend in heave RAO values was seen when IOT 706 is towing IOT 722 as well. Again, speed does not appear to affect the trend seen in decreasing RAO values as encounter frequency increases. For the weather limit series, IOT 722’s heave RAO values remain fairly consistent across all conditions and speeds while under tow by the carriage. There is more variation in the heave RAO when IOT 706 tows IOT 722, especially at the Beaufort 4 weather levels. Again, some weather levels (i.e. Beaufort 6) where not safe to test IOT 706 at, which resulted in missing data points at the lower speed setting.
For the varying wave frequencies conditions, IOT 723 responded in a similar fashion as compared to the previous two rafts. While under tow by the main carriage, IOT 723’s heave RAO values decreased as the encounter wave frequency increased. Towing speed did not affect this trend. While under tow by IOT 706, IOT 723 did
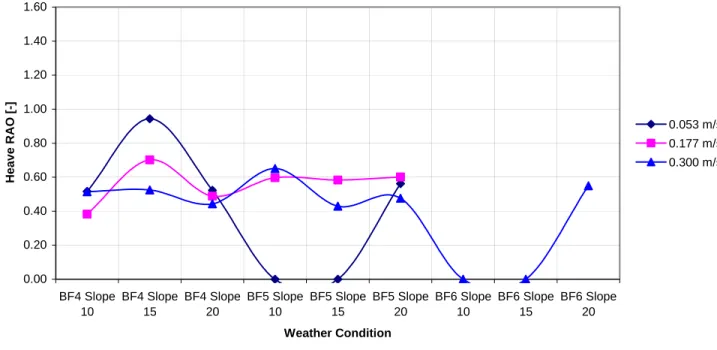
experience a similar decrease in heave RAO values as when it was under tow by the main carriage, but to a smaller degree. For the varying Beaufort levels, IOT 723 performed differently than the other two liferafts. At the Beaufort 4 levels, IOT 723 had small heave RAO values (< 0.5), but as the levels increased, the heave RAO values increased as well up to almost 1.0. Speed did not seem to affect heave RAO values greatly except for the last weather condition (Beaufort 6 slope 20) where a higher speed resulted in a lower value.
0.00 0.20 0.40 0.60 0.80 1.00 1.20 1.40 1.60 0.400 0.600 0.800 1.000 1.200 1.400 1.600 1.800 Encounter Frequency (Hz) Heave RAO [-] 0.19 m/s 0.38 m/s 0.58 m/s
Figure 6.5: IOT 721 Heave RAO in 1:15 slope waves under tow by the main tow carriage in varying wave frequencies.
0.00 0.20 0.40 0.60 0.80 1.00 1.20 1.40 1.60 0.400 0.600 0.800 1.000 1.200 1.400 1.600 1.800 Encounter Frequency (Hz) Heave RAO [-] 0.02 m/s 0.21 m/s 0.41 m/s
Figure 6.6: IOT 721 Heave RAO in 1:15 slope waves under tow by IOT 706 in varying wave frequencies.
0.00 0.20 0.40 0.60 0.80 1.00 1.20 1.40 1.60 BF4 Slope 10 BF4 Slope 15 BF4 Slope 20 BF5 Slope 10 BF5 Slope 15 BF5 Slope 20 BF6 Slope 10 BF6 Slope 15 BF6 Slope 20 Weather Condition Heave RAO [-] 0.19 m/s 0.38 m/s 0.58 m/s
Figure 6.7: IOT 721Heave RAO in varying equivalent Beaufort conditions under tow by main carriage. 0.00 0.20 0.40 0.60 0.80 1.00 1.20 1.40 1.60 BF4 Slope 10 BF4 Slope 15 BF4 Slope 20 BF5 Slope 10 BF5 Slope 15 BF5 Slope 20 BF6 Slope 10 BF6 Slope 15 BF6 Slope 20 Weather Condition Heave RAO [-] 0.085 m/s 0.141 m/s 0.368 m/s
Figure 6.8: IOT 721Heave RAO in varying equivalent Beaufort conditions under tow by IOT 706.
0.00 0.20 0.40 0.60 0.80 1.00 1.20 1.40 1.60 0.400 0.600 0.800 1.000 1.200 1.400 1.600 1.800 Encounter Frequency (Hz) H eave R A O [ -] 0.19 m/s 0.38 m/s 0.58 m/s
Figure 6.9: IOT 722 Heave RAO in 1:15 slope waves under tow by the main tow carriage in varying wave frequencies.
0.00 0.20 0.40 0.60 0.80 1.00 1.20 1.40 1.60 0.400 0.600 0.800 1.000 1.200 1.400 1.600 1.800 Encounter Frequency (Hz) Heave RAO [-] 0.08 m/s 0.24 m/s 0.47 m/s
Figure 6.10: IOT 722 Heave RAO in 1:15 slope waves under tow by IOT 706 in varying wave frequencies.
0.00 0.20 0.40 0.60 0.80 1.00 1.20 1.40 1.60 BF4 Slope 10 BF4 Slope 15 BF4 Slope 20 BF5 Slope 10 BF5 Slope 15 BF5 Slope 20 BF6 Slope 10 BF6 Slope 15 BF6 Slope 20 Weather Condition Heave RAO [-] 0.19 m/s 0.38 m/s 0.58 m/s
Figure 6.11: IOT 722Heave RAO in varying equivalent Beaufort conditions under tow by main carriage
igure 6.12: IOT 722Heave RAO in varying equivalent Beaufort conditions under tow by F 0.00 0.20 0.40 0.60 0.80 1.00 1.20 1.40 1.60 BF4 Slope 10 BF4 Slope 15 BF4 Slope 20 BF5 Slope 10 BF5 Slope 15 BF5 Slope 20 BF6 Slope 10 BF6 Slope 15 BF6 Slope 20 Weather Condition Heave RAO [-] 0.106 m/s 0.318 m/s 0.524 m/s IOT 706. 25
0.00 0.20 0.40 0.60 0.80 1.00 1.20 1.40 1.60 0.400 0.600 0.800 1.000 1.200 1.400 1.600 1.800 Encounter Frequency (Hz) Heave RAO [-] 0.19 m/s 0.38 m/s 0.58 m/s
Figure 6.13: IOT 723 Heave RAO in 1:15 slope waves under tow by the main tow carriage in varying wave frequencies.
0.00 0.20 0.40 0.60 0.80 1.00 1.20 1.40 1.60 0.400 0.600 0.800 1.000 1.200 1.400 1.600 1.800 Encounter Frequency (Hz) Heave RAO [-] 0.08 m/s 0.28 m/s 0.34 m/s
Figure 6.14: IOT 723 Heave RAO in 1:15 slope waves under tow by IOT 706 in varying wave frequencies.
0.00 0.20 0.40 0.60 0.80 1.00 1.20 1.40 1.60 BF4 Slope 10 BF4 Slope 15 BF4 Slope 20 BF5 Slope 10 BF5 Slope 15 BF5 Slope 20 BF6 Slope 10 BF6 Slope 15 BF6 Slope 20 Weather Condition Heave RAO [-] 0.19 m/s 0.38 m/s 0.58 m/s
Figure 6.15: IOT 723 Heave RAO in varying equivalent Beaufort conditions under tow by main carriage 0.00 0.20 0.40 0.60 0.80 1.00 1.20 1.40 1.60 BF4 Slope 10 BF4 Slope 15 BF4 Slope 20 BF5 Slope 10 BF5 Slope 15 BF5 Slope 20 BF6 Slope 10 BF6 Slope 15 BF6 Slope 20 Weather Condition Heave RAO [-] 0.053 m/s 0.177 m/s 0.300 m/s
Figure 6.16: IOT 723 Heave RAO in varying equivalent Beaufort conditions under tow by IOT 706.
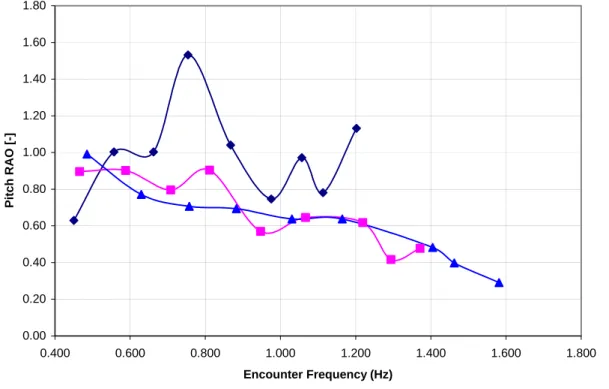
6.2.2 Pitch RAO’s
Pitch RAO’s are defined as the angular amplitudes of the model
non-dimensionalized by the wave slope amplitude. For all model life rafts, the optical systems was setup to measure pitch, roll, and yaw motion. Pitch RAO’s were calculated by
dividing pitch by the wave slope amplitude. They were calculated using the following equation:
Pitch RAO = pitch/ ((2π/λ)·ζ0)
Where:
pitch = Pitch angular motion (in radians) π = Pi
λ = Wavelength for given wave frequency (m) ζ0 = Wave amplitude (m)
In the varying wave frequency test series with carriage tows, IOT 721 had decreasing pitch RAO values with increasing encounter frequencies and was unaffected by towing speed. When IOT 706 towed IOT 721 in the same wave frequencies, a
decrease was seen in pitch RAO values with increasing encounter frequencies in only the two highest tow speeds. For the varying weather limit series, speed did seem to affect pitch RAO values for IOT 721. The lower the tow speeds, the higher the RAO values. As the weather limits increased, for all speeds, the pitch RAO values increased slightly and then tapered off.
IOT 722 followed a trend similar to IOT 721. When towed by the carriage in the varying wave frequency series, an increase in encounter frequency resulted in a decrease in pitch RAO values. This effect was seen across all speeds. While under tow by IOT 706, the pitch RAO values of IOT 722 were much lower compared to those in which the carriage towed IOT 721, but decreased in a similar fashion. In the varying Beaufort level series, the pitch RAO value for IOT 722 remains fairly consistent across all tows by the carriage. At the lowest tow speed in the Beaufort 4 equivalent weather limits, the pitch RAO values for IOT 722 are higher compared to the other tow speeds. However, at the higher Beaufort levels, the pitch RAO values for all three speeds seem to be somewhat similar. When under tow by IOT 706 in the varying Beaufort conditions series the pitch RAO values for IOT 722 gradually rise as the weather levels increase. There does not seem to be an effect of speed on RAO values.
The pitch RAO values for IOT 723 decreased as the encounter frequency increased when under tow by the carriage. Again, speed did not seem to affect the RAO values. During tows with IOT 706, at the top two tow speeds, the pitch RAO values decreased with increasing wave frequencies. This trend was not seen at the lowest tow speed. During the varying weather conditions series, the pitch RAO value increased for IOT 723 as the
Beaufort level increased while under tow by the carriage. During tows with IOT 706 in the same weather limit conditions, a similar trend is seen with pitch RAO values increasing as Beaufort levels increase. However, no data is available at the higher
weather limit series to test if this trend continues past Beaufort 5. The reason for this was that due to the large difference in displacement between IOT 723 and IOT 706, it was not safe to perform tow tests at Beaufort 6 due to the possibility of damage to the latter.
0.00 0.20 0.40 0.60 0.80 1.00 1.20 1.40 1.60 0.400 0.600 0.800 1.000 1.200 1.400 1.600 1.800 Encounter Frequency (Hz) P itch RAO [-] 0.19 m/s 0.38 m/s 0.58 m/s
Figure 6.17: IOT 721 Pitch RAO in 1:15 slope waves under tow by the main tow carriage. 0.00 0.20 0.40 0.60 0.80 1.00 1.20 1.40 1.60 1.80 0.400 0.600 0.800 1.000 1.200 1.400 1.600 1.800 Encounter Frequency (Hz) P itch RAO [-] 0.02 m/s 0.2 m/s 0.41 m/s
0.00 0.20 0.40 0.60 0.80 1.00 1.20 1.40 1.60 BF4 Slope 10 BF4 Slope 15 BF4 Slope 20 BF5 Slope 10 BF5 Slope 15 BF5 Slope 20 BF6 Slope 10 BF6 Slope 15 BF6 Slope 20 Weather Condition P itch RAO [-] 0.19 m/s 0.38 m/s 0.58 m/s
Figure 6.19: IOT 721 Pitch RAO in varying equivalent Beaufort conditions under tow by main carriage. 0.00 0.20 0.40 0.60 0.80 1.00 1.20 1.40 1.60 BF4 Slope 10 BF4 Slope 15 BF4 Slope 20 BF5 Slope 10 BF5 Slope 15 BF5 Slope 20 BF6 Slope 10 BF6 Slope 15 Weather Condition P itch RAO [-] 0.085 m/s 0.141 m/s 0.368 m/s
Figure 6.20: IOT 721 Pitch RAO in varying equivalent Beaufort conditions under tow by IOT 706.
0.00 0.20 0.40 0.60 0.80 1.00 1.20 1.40 1.60 0.400 0.600 0.800 1.000 1.200 1.400 1.600 1.800 Encounter Frequency (Hz) P itch RAO [-] 0.19 m/s 0.38 m/s 0.58 m/s
Figure 6.21: IOT 722 Pitch RAO in 1:15 slope waves under tow by the main tow carriage. 0.000 0.200 0.400 0.600 0.800 1.000 1.200 1.400 1.600 0.400 0.600 0.800 1.000 1.200 1.400 1.600 1.800 Encounter Frequency (Hz) P itch RAO [-] 0.08 m/s 0.24 m/s 0.48 m/s
Figure 6.23: IOT 722 Pitch RAO in varying equivalent Beaufort conditions under tow by main carriage
Figure 6.24: IOT 722 Pitch RAO in varying equivalent Beaufort conditions under tow by IOT 706. 0.00 0.20 0.40 0.60 0.80 1.00 1.20 BF4 Slope 10 BF4 Slope 15 BF4 Slope 20 BF5 Slope 10 BF5 Slope 15 BF5 Slope 20 BF6 Slope 10 BF6 Slope 15 BF6 Slope 20 Weather Condition P itch RAO [-] 1.40 1.60 0.19 m/s 0.38 m/s 0.58 m/s 0.00 0.20 0.40 0.60 0.80 1.00 1.20 1.40 BF4 Slope 10 BF4 Slope 15 BF4 Slope 20 BF5 Slope 10 BF5 Slope 15 BF5 Slope 20 BF6 Slope 10 BF6 Slope 15 BF6 Slope 20 Weather Condition P itch RAO [-] 1.60 0.106 m/s 0.318 m/s 0.524 m/s 33
0.000 0.200 0.400 0.600 0.800 1.000 1.200 1.400 1.600 0.400 0.600 0.800 1.000 1.200 1.400 1.600 1.800 Encounter Frequency (Hz) P itch RAO [-] 0.8 m/s 0.28 m/s 0.34 m/s
Figure 6.25: IOT 723 Pitch RAO in 1:15 slope waves under tow by the main tow carriage. 0.000 0.200 0.400 0.600 0.800 1.000 1.200 1.400 1.600 0.400 0.600 0.800 1.000 1.200 1.400 1.600 1.800 Encounter Frequency (Hz) P itch RAO [-] 0.19 m/s 0.38 m/s 0.58 m/s
Figure 6.27: IOT 723 Pitch RAO in varying equivalent Beaufort conditions under main carri r main carri tow by age.
Figure 6.28: IOT 723 Pitch RAO in varying equivalent Beaufort conditions under tow by tow by age.
Figure 6.28: IOT 723 Pitch RAO in varying equivalent Beaufort conditions under tow by
0.00 0.20 0.40 0.60 0.80 1.00 1.20 1.40 1.60 BF4 Slope 10 BF4 Slope 15 BF4 Slope 20 BF5 Slope 10 BF5 Slope 15 BF5 Slope 20 BF6 Slope 10 BF6 Slope 15 BF6 Slope 20 Weather Condition P itch RAO [-] 0.19 m/s 0.38 m/s 0.58 m/s 0.00 0.20 0.40 0.60 0.80 1.00 1.20 1.40 1.60 BF4 Slope 10 BF4 Slope 15 BF4 Slope 20 BF5 Slope 10 BF5 Slope 15 BF5 Slope 20 BF6 Slope 10 BF6 Slope 15 BF6 Slope 20 Weather Condition P itch RAO [-] 0.053 m/s 0.178 m/s 0.300 m/s IOT 706. IOT 706. 35
6.2.3 Effects of wave slope, frequency, and towing speed on mean tow force.
The following graphs depict the effect of varying wave frequency, slope, wind speed, and tow speed on the tow force. The carriage and IOT 706 towed all rafts. The tow values are reported as the mean measured tow load, plus two times the standard
deviation.
The mean combined with two times the standard deviation was used to report the tow force in order to give a more realistic representation of the maximum loads
experienced by the rafts. Since the load cell experienced both periods of loading and unloading as the rafts traveled up and down the waves, reporting only the mean would not have been an appropriate representation of the forces experienced by the two. By adding two times the standard deviation to the mean value observed for the tow force, we are able to report mean maximal tow loads experienced by the rafts while also omitting noise from the measuring device which may produce un-realistically high tow load values that could be interpreted by statistical analysis software as the actual maximum tow load. For all model life rafts, there are 3 variables that will affect tow loads. Increasing the speed of the tow will result in higher tow loads. Decreasing the wave frequency will also result in higher tow loads for all rafts. Also, carriage tows will generate a higher tow load
afts are able to influence the forward motion of IOT 706 due to their similar displacements. The main tow carriage, by comparison, is not affected at all by the displacement of the model liferaft. With the liferaft’s displacement having no effect on the carriage, the speed of the tow is unaffected.
compared to tows with IOT 706 for any given environmental condition. This is because the model life r
0 10 20 30 40 0.45 0.55 0.65 0.75 0.85 0.95 1.05 1.10 1.15 Encounter Frequency (Hz) 50 90 Tow Load (N) 60 70 80 100 0.58 m/s 0.38 m/s 0.19 m/s
Figure 6.29: Mean tow force plus 2 standard deviations for IOT 721 across wave frequency at varying tow speeds under tow by the carriage.
0 10 20 30 40 50 60 70 80 90 100 0.45 0.55 0.65 0.75 0.85 0.95 1.05 1.10 1.15 Encounter Frequency (Hz) Tow Load (N) 0.41 m/s 0.21 m/s 0.02 m/s 37
Figure 6.30: Mean tow force plus 2 standard deviations for IOT 721 across wave frequency at varying tow speeds under tow by IOT 706.
0 10 20 30 40 50 60 70 80 90 100 0.45 0.55 0.65 0.75 0.85 0.95 1.05 1.10 1.15 Encounter Frequency (Hz) Tow Load (N) 0.58 m/s 0.38 m/s 0.19 m/s
Figure 6.31: Mean tow force plus 2 standard deviations for IOT 722 across wave frequency at varying tow speeds under tow by the carriage
0 10 20 30 40 50 60 70 80 90 100 0.45 0.55 0.65 0.75 0.85 0.95 1.05 1.10 1.15 Encounter Frequency (Hz) Tow Load (N) 0.47 m/s 0.23 m/s 0.08 m/s
Figure 6.32: Mean tow force plus 2 standard deviations for IOT 722 across wave frequency at varying tow speeds under tow by IOT 706.
0 10 20 30 40 50 60 70 80 90 100 0.45 0.55 0.65 0.75 0.85 0.95 1.05 1.10 1.15 NominalFrequency (Hz)
Figure 6.34: Mean tow force plus 2 standard deviations for IOT 723 across wave frequency at varying tow speeds under tow by IOT 706.
Figure 6.33: Mean tow force plus 2 standard deviations for IOT 723 across wave frequency at varying tow speeds under tow by the carriage.
Tow Load (N) 0.58 m/s 0.38 m/s 0.19 m/s 0 10 20 30 40 50 60 70 80 90 100 Tow Load (N) 0.34 m/s 0.25 m/s 0.08 m/s 0.45 0.55 0.65 0.75 0.85 0.95 1.05 1.10 1.15 Encounter Frequency (Hz) 39
0 10 20 30 40 50 60 70 80 90 100 BF4 Slope 10 BF4 Slope 15 BF4 Slope 20 BF5 Slope 10 BF5 Slope 15 BF5 Slope 20 BF6 Slope 10 BF6 Slope 15 BF6 Slope 20 Weather Condition Tow Load (N) 0.58 m/s 0.38 m/s 0.19 m/s
Figure 6.35 Mean tow force plus 2 standard deviations for IOT 721 across weathe conditions at varying tow speeds under tow by the main carriage. 21 across weathe conditions at varying tow speeds under tow by the main carriage. r
r r r 0 10 20 30 40 50 60 70 80 90 100 BF4 Slope 10 BF4 Slope 15 BF4 Slope 20 BF5 Slope 10 BF5 Slope 15 BF5 Slope 20 BF6 Slope 10 BF6 Slope 15 BF6 Slope 20 Weather Condition Tow Load (N) 0.368 m/s 0.141 m/s 0.085 m/s
Figure 6.36 Mean tow force plus 2 standard deviations for IOT 721 across weathe conditions at varying tow speeds under tow by IOT 706.
Figure 6.36 Mean tow force plus 2 standard deviations for IOT 721 across weathe conditions at varying tow speeds under tow by IOT 706.
0 10 20 30 40 50 60 70 80 90 100 BF4 Slope 10 BF4 Slope 15 BF4 Slope 20 BF5 Slope 10 BF5 Slope 15 BF5 Slope 20 BF6 Slope 10 BF6 Slope 15 BF6 Slope 20 Weather Condition Tow Load (N) 0.58 m/s 0.38 m/s 0.19 m/s
Figure 6.37: Mean tow force plus 2 standard deviations for IOT 722 across weather conditions at varying tow speeds under tow by the main carriage.
22 across weather conditions at varying tow speeds under tow by the main carriage.
0 10 20 30 40 50 60 70 80 90 100 BF4 Slope 10 BF4 Slope 15 BF4 Slope 20 BF5 Slope 10 BF5 Slope 15 BF5 Slope 20 BF6 Slope 10 BF6 Slope 15 BF6 Slope 20 Weather Condition Tow Load (N) 0.524 m/s 0.318 m/s 0.106 m/s
r IOT 722 across weather conditions at varying tow speeds under tow by IOT 706. r IOT 722 across weather conditions at varying tow speeds under tow by IOT 706.
Figure 6.38: Mean tow force plus 2 standard deviations fo Figure 6.38: Mean tow force plus 2 standard deviations fo
0 10 20 30 40 50 60 70 80 90 100 BF4 Slope 10 BF4 Slope 15 BF4 Slope 20 BF5 Slope 10 BF5 Slope 15 BF5 Slope 20 BF6 Slope 10 BF6 Slope 15 BF6 Slope 20 Weather Condition Tow Load (N) 0.58 m/s 0.38 m/s 0.19 m/s
Figure 6.39: Mean tow force plus 2 standard deviations for IOT 723 across weather conditions at varying tow speeds under tow by the main carriage.
0.300 m/s 0.177 m/s 0.052 m/s 100 0 10 20 30 40 50 60 70 80 90 BF4 Slope 10 BF4 Slope 15 BF4 Slope 20 BF5 Slope 10 BF5 Slope 15 BF5 Slope 20 BF6 Slope 10 BF6 Slope 15 BF6 Slope 20 Weather Condition Tow Load (N)
Figure 6.40: Mean tow force plus 2 standard deviations for IOT 723 across weather conditions at varying tow speeds under tow by IOT 706.
6.3 Drift Tests
A series of un-tethered drift tests were performed on all the rafts. The tests were carried out on uni-directional waves in Beaufort conditions of 4, 5, and 6. Each Beaufort equivalent condition was run with wave slopes of 1:10, 1:15, and 1:20. Wind speeds were 2.72 m·s-1 for Beaufort 4, 3.69 m·s-1 for Beaufort 5, and 4.76 m·s-1 for Beaufort 6. All rafts were run in both a waves only condition, as well as a wind and waves condition. The setup for the rafts was: floor inflated, even ballast, and sea anchor deployed. Drift heave and pitch RAO calculations were performed the same way as in regular waves.
For IOT 721, heave RAO remained similar across the waves, and wind and waves conditions. As the weather conditions increased, heave RAO values approached 1.0 and remained consistent. A similar trend was seen for pitch RAO values. Wind conditions did not influence the pitch RAO values, which approached values of just above 1.0 as the Beaufort conditions increased.
IOT 722 did not experience the same trend for heave RAO values as IOT 721 did. In the waves only condition, heave RAO values rose at the Beaufort 5 equivalent with wave slope 15 condition and continued to climb up to 1.05 at Beaufort 6 equivalent wave
tch RAO values followed a similar trend to IOT 721. As the Beaufort level increases, the RAO values increases to approximately 1 and remain fairly consistent.
IOT 723 did not follow the same trend for heave RAO values as the previous two models did. For both the waves only, and wind and waves conditions, heave RAO values rose sharply at Beaufort 4 slope 20 to approximately 1.0 and gradually decreased as the Beaufort levels increased. IOT 723’s pitch RAO values are very different from the previous two models. For both waves only, and wind and waves conditions, the pitch RAO values are very low (< 0.5). A possible explanation is that as the drift tests proceeded, IOT 723 would turn 90 degrees causing it to become perpendicular to the wave field along the model’s X-axis. This resulted in the model doing more rolling than pitching. The one exception to this is the Beaufort 5 slope 20 waves only condition. In this particular condition, the model did not turn and remained parallel to the wave field along its X-axis (see Tape 8 from test series, 06:34 time mark). This caused the model to do more pitching than rolling for that particular test condition, resulting in a much higher RAO value for the condition than any other. When the model performed the same test in both wind and waves, it is likely that the force of the wind caused the model to turn 90 degrees, producing a pitch RAO value that is similar to the other environmental
conditions.
slope 15. For the wind and waves condition, the heave RAO values dropped after Beaufort 4 equivalent wave slope 20 condition, rising briefly to 0.8 at Beaufort 6 equivalent wave slope 10, then dropping back down. IOT 722’s pi
0.00 BF4 Slope 10 BF4 Slope 15 BF4 Slope 20 BF5 Slope 10 BF5 Slope 15 BF5 Slope 20 BF6 Slope 10 BF6 Slope 15 BF6 Slope 20 Weather Condition 0.20 0.40 0.60 0.80 00 Heave RAO [-] 1. 1.40 1.20
IOT 721 pitch RAO during drift tests from Beaufort 4-6 equivalent conditions.
Figure 6.41: IOT 721 heave RAO during drift tests from Beaufort 4-6 equivalent conditions.
Figure 6.42:
Wind and Waves Waves Only 0.00 0.20 0.40 0.60 0.80 1.00 BF4 Slope 10 BF4 Slope 15 BF4 Slope 20 BF5 Slope 10 BF5 Slope 15 BF5 Slope 20 BF6 Slope 10 BF6 Slope 15 BF6 Slope 20 Weather Condition P itch RAO [-] 1.20 1.40
Wind and Waves Waves Only
0.00 0.20 0.40 0.60 0.80 1.00 1.20 1.40 BF4 Slope 10 BF4 Slope 15 BF4 Slope 20 BF5 Slope 10 BF5 Slope 15 BF5 Slope 20 BF6 Slope 10 BF6 Slope 15 BF6 Slope 20 Weather Condition Heave RAO [-]
Wind and Waves Waves Only
Figure 6.43: IOT 722 heave RAO during drift tests from Beaufort 4-6 equivalent conditions. 0.00 0.20 0.40 0.60 0.80 1.00 1.20 1.40 BF4 Slope 10 BF4 Slope 15 BF4 Slope 20 BF5 Slope 10 BF5 Slope 15 BF5 Slope 20 BF6 Slope 10 BF6 Slope 15 BF6 Slope 20 P itch RAO [-]
Wind and Waves Waves Only
Weather Condition
Figure 64.4: IOT 722 pitch RAO during drift tests from Beaufort 4-6 equivalent conditions.
0.00 0.20 0.40 0.60 0.80 1.00 1.20 1.40 BF4 Slope 10 BF4 Slope 15 BF4 Slope 20 BF5 Slope 10 BF5 Slope 15 BF5 Slope 20 BF6 Slope 10 BF6 Slope 15 BF6 Slope 20 Weather Condition
Figure 6.45: IOT 723 heave RAO during drift tests from Beaufort 4-6 equivalent conditions.
Heave RAO
[-]
Wind and Waves Waves Only 0.00 0.20 0.40 0.60 0.80 1.00 1.20 1.40 BF4 Slope 10 BF4 Slope 15 BF4 Slope 20 BF5 Slope 10 BF5 Slope 15 BF5 Slope 20 BF6 Slope 10 BF6 Slope 15 BF6 Slope 20 Weather Condition P itch RAO [-]
Wind and Waves Waves Only
Figure 6.46: IOT 723 pitch RAO during drift tests from Beaufort 4-6 equivalent conditions.
7.0 Conclusions
1. Calm Water Tows: There was minimal difference measured in tow force with varying the raft setup conditions. The differences observed for all the rafts were in the range of 1-2N. Increasing the speed of the tow had the greatest impact on the tow force for each of the model life rafts. The results from the calm water tows of IOT 721 and IOT 722 with the carriage closely match those observed during previous tests (TR-2006-09)
2. Heave RAO’s: For the carriage tows in varying wave frequencies, Heave RAO values showed a trend of decreasing in value as the wave frequency increased. This was consistent across all rafts and tow speeds. A similar trend was seen for tows with IOT 706. There was no observable difference in Heave RAO values across speed. There were varying trends seen in the Heave RAO values in the varying, equivalent Beaufort conditions. For the carriage tows, IOT 721 and IOT 722 had consistent Heave RAO values across all weather conditions and speeds. The heave RAO values for IOT 723 increase as the weather conditions increases, but then levels off after the Beaufort 5, slope 20 sea state. For tows by IOT 706, the heave RAO values remain fairly consistent through all the weather conditions for all rafts at all speeds.
RAO’s: A similar trend seen with the heave RAO values are seen with the
pitch RAO values as well. For carriage tows in the varying wave frequencies, the pitch RAO values of the rafts decreased as the wave frequencies increased across all rafts and speeds. For tows with IOT 706, the pitch RAO values shows similar trends as per carriage, with the exception of the lowest tow speed with IOT 721. For this speed pitch RAO values remain close to 1.0 across all the frequencies. In the equivalent Beaufort conditions for carriage tows, all rafts show an increase in pitch RAO values as the weather condition increases. IOT 721 shows the least amount of increase. IOT 723 values increased steadily as the equivalent Beaufort conditions increased as well. For tows with IOT 706 the trends are similar to those observed in carriage tows. At the two highest speeds IOT 721 pitch RAO values correlate with increased weather levels, i.e. an increase in weather resulted in an increase in pitch RAO values. The pitch values for IOT 723 rose sharply for the top two speeds as the weather level increased.
4. Tow Force: For all carriage tows with the model life rafts, the tow force increases as the wave frequency decreases. This effect is seen across all speeds, with higher speeds generating larger tow force values than the lower ones. This same trend is repeated when the model liferafts are under tow by IOT 706. When the life rafts are towed in the Beaufort equivalent conditions, lower wave slopes and higher Beaufort levels result in higher tow load, for all rafts across all speeds.
3. Pitch
5. Drift Tests: Heave RAO’s for IOT 721 remained fairly consistent around a value f 1.0 across all the weather conditions, and were not affected by the addition of
resulted in the heave RAO values decreasing as the weather levels increased for IOT 722. IOT 723 had a large increase in heave RAO values for
eather levels increased. Again, the two different environmental conditions did not create an observable difference in pitch RAO o
wind. Wind
weather limits above Beaufort 4, slope 15 conditions. The wind and waves conditions produced larger heave RAO values for IOT 723, then the waves only condition. Pitch RAO values for IOT 721 were consistently around 1.10 across all the weather conditions, with little difference observed between the waves only, and wind and waves conditions. IOT 722’s pitch values rose from ~ 0.6 to a constant level of ~1.0 as the w
8.0 We wo r their fi knowle o extend fabrica especia suppor Acknowledgements
uld like to express our gratitude to the New Search and Rescue Initiative Fund fo nancial support. We would like to thank the staff of the CWTT at IOT for their
dgeable help and assistance during these experimental trials. We also want t our thanks to all the individuals in the electronics, software engineering group and
tion for their support through the duration of the trials. We would also like to lly thank Edward Kennedy for the amazing amount of extra work, effort, and t he provided through these experimental trials.