arXiv:1605.04285v2 [hep-ex] 10 Nov 2016
EUROPEAN ORGANISATION FOR NUCLEAR RESEARCH (CERN)
Eur. Phys. J. C 76 (2016) 565
DOI:10.1140/epjc/s10052-016-4397-x
CERN-EP-2016-037 11th November 2016
Search for gluinos in events with an isolated lepton, jets and
missing transverse momentum at
√ s = 13 TeV with the ATLAS
detector
The ATLAS Collaboration
Abstract
The results of a search for gluinos in final states with an isolated electron or muon, multiple jets and large missing transverse momentum using proton–proton collision data at a centre-of-mass energy of √s = 13 TeV are presented. The dataset used was recorded in 2015 by the ATLAS experiment at the Large Hadron Collider and corresponds to an integrated luminos-ity of 3.2 fb−1. Six signal selections are defined that best exploit the signal characteristics. The data agree with the Standard Model background expectation in all six signal selections, and the largest deviation is a 2.1 standard deviation excess. The results are interpreted in a simplified model where pair-produced gluinos decay via the lightest chargino to the lightest neutralino. In this model, gluinos are excluded up to masses of approximately 1.6 TeV de-pending on the mass spectrum of the simplified model, thus surpassing the limits of previous searches.
c
2016 CERN for the benefit of the ATLAS Collaboration.
1 Introduction
Supersymmetry (SUSY) [1–6] is a theoretical framework of physics beyond the Standard Model (SM) that predicts for each SM particle the existence of a supersymmetric partner differing by half a unit of spin. The partner particles of the SM fermions (quarks and leptons) are the scalar squarks ( ˜q) and sleptons ( ˜ℓ). In the boson sector, the supersymmetric partner of the gluon is the fermionic gluino (˜g), whereas the supersymmetric partners of the Higgs (higgsinos) and the electro-weak gauge bosons (winos and bino) mix to form charged and neutral mass eigenstates called charginos ( ˜χ±1,2) and neutralinos ( ˜χ01,2,3,4). In the Minimal Supersymmetric extension of the Standard Model (MSSM) [7,8] two scalar Higgs doublets along with their Higgsino partners are predicted. SUSY addresses the SM hierarchy problem [9–12] provided that the masses of at least some of the supersymmetric particles (most notably the higgsinos, the top squarks and the gluinos) are near the TeV scale.
In R-parity-conserving SUSY [13], gluinos might be pair-produced at the Large Hadron Collider (LHC) via the strong interaction and decay either directly or via intermediate states to the lightest supersymmetric particle (LSP). The LSP is stable and is assumed to be only weakly interacting, making it a candidate for dark matter [14,15].
This paper considers a SUSY-inspired model where pair-produced gluinos decay via the lightest char-gino ( ˜χ±1) to the LSP, which is assumed to be the lightest neutralino ( ˜χ01). The three-body decay of the gluino to the chargino proceeds via ˜g → q ¯q′χ˜±1. The chargino decays to the LSP by emitting an on- or off-shell W boson, depending on the available phase space. In the MSSM this decay chain is realised when the gluino decays via a virtual squark that is the partner of the left-handed SM quark, to the chargino with a dominant wino component. In the MSSM the mass of the chargino is independent of the mass of the gluino.
The experimental signature characterising this search consists of a lepton (electron or muon), several jets, and missing transverse momentum ( pmissT with magnitude ETmiss) from the undetectable neutralinos and neutrino(s). The analysis is based on two complementary sets of search channels. The first set requires a low transverse momentum (pT) lepton (7/6 < pT(e/µ) < 35 GeV), and is referred to as the soft-lepton channel, while the second set requires a high-pTlepton (pT(e/µ) > 35 GeV) and is referred to as the hard-lepton channel. The two sets target SUSY models with small and large mass differences between the predicted supersymmetric particles, respectively. The search uses the ATLAS data collected in proton– proton LHC collisions in 2015 corresponding to an integrated luminosity of 3.2 fb−1at a centre-of-mass energy of 13 TeV.
The analysis extends previous ATLAS searches with similar event selections [16] which were performed with data collected during the first data-taking campaign between 2010 and 2012 (LHC Run 1) at a centre-of-mass energy of up to 8 TeV. The results of all Run 1 ATLAS searches targeting squark and gluino pair-production are summarised in Ref. [17]. The CMS Collaboration has performed similar searches for gluinos with decays via intermediate supersymmetric particles in Run 1 [18,19] and Run 2 [20].
This paper is structured as follows. After a brief description of the ATLAS detector in Section2, the simulated data samples for the background and signal processes used in the analysis as well as the dataset and the trigger strategy are detailed in Section3. The reconstructed objects and quantities used in the analysis are described in Section4 and the event selection is presented in Section 5. The background estimation and the systematic uncertainties associated with the expected event yields are discussed in
Sections6and7, respectively, while details of the statistical interpretation are given in Section8. Finally, the results of the analysis are presented in Section9and are followed by a conclusion.
2 ATLAS detector
ATLAS [21] is a generpurpose detector with a forward-backward symmetric design that provides al-most full solid angle coverage around the interaction point.1 The main components of ATLAS are the inner detector (ID), which is surrounded by a superconducting solenoid providing a 2 T axial magnetic field, the calorimeter system, and the muon spectrometer (MS), which is immersed in a magnetic field generated by three large superconducting toroidal magnets. The ID provides track reconstruction within
|η| < 2.5, employing pixel detectors close to the beam pipe, silicon microstrip detectors at intermediate
radii, and a straw-tube tracker with particle identification capabilities based on transition radiation at radii up to 1080 mm. The innermost pixel detector layer, the insertable B-layer [22], was added during the shutdown between LHC Run 1 and Run 2, at a radius of 33 mm around a new, narrower, beam pipe. The calorimeters cover |η| < 4.9, the forward region (3.2 < |η| < 4.9) being instrumented with a liquid-argon (LAr) calorimeter for both the electromagnetic and hadronic measurements. In the central region, a lead/LAr electromagnetic calorimeter covers |η| < 3.2, while the hadronic calorimeter uses two different detector technologies, with scintillator tiles (|η| < 1.7) or LAr (1.5 < |η| < 3.2) as the active medium. The MS consists of three layers of precision tracking chambers providing coverage over |η| < 2.7, while dedicated fast chambers allow triggering over |η| < 2.4. The ATLAS trigger system (developed from Ref. [23]) consists of a hardware-based first-level trigger and a software based high-level trigger.
3 Simulated event samples and data samples
The signal model considered in this search is a simplified model [24–26] that has been used in previous similar ATLAS searches [16]. In this model, exclusive pair-production of gluinos is assumed. The glui-nos decay via an intermediate chargino, here the lightest chargino ˜χ±1, into the lightest supersymmetric particle, the lightest neutralino ˜χ01. The branching ratio of each supersymmetric particle decay considered is assumed to be 100%. Other supersymmetric particles not entering the decay chain described are not considered in this simplified model and their masses are set to high values. The gluino decay is assumed to proceed only via virtual first- and second- generation quarks, hence no bottom or top quarks are pro-duced in the simplified model. The free parameters of the model are the masses of the gluino (m˜g), the chargino (mχ˜±
1), and the neutralino (mχ˜01). Two types of scenarios are considered: in the first type, the mass of the neutralino is fixed to 60 GeV, and the sensitivity is assessed as a function of the gluino mass and a mass-ratio parameter defined as x = (mχ˜±
1 − mχ˜01)/(m˜g− mχ˜
0
1). In the second type, m˜gand mχ˜ 0
1 are
free parameters, while mχ˜±
1 is set to mχ˜±1 = (m˜g+ mχ˜01)/2. The decay topology of the simplified model is illustrated in Fig.1.
1ATLAS uses a right-handed coordinate system with its origin at the nominal interaction point (IP) in the centre of the detector
and the z-axis along the beam pipe. The x-axis points from the IP to the centre of the LHC ring, and the y-axis points upward. Cylindrical coordinates (r, φ) are used in the transverse plane, φ being the azimuthal angle around the z-axis. The pseudorapidity is defined in terms of the polar angle θ as η = − ln tan(θ/2) and the rapidity is defined as y = 0.5 ln[(E +
Figure 1: The decay topology of the signal model considered in this search.
The signal samples are generated using MG5_aMC@NLO 2.2.2 [27] with up to two extra partons in the matrix element, interfaced to Pythia 8.186 [28] for parton showers and hadronisation. For the combina-tion of the matrix element and the parton shower the CKKW-L matching scheme [29] is applied with a scale parameter that is set to a quarter of the mass of the gluino. The ATLAS A14 [30] set of tuned para-meters (tune) for the underlying event is used together with the NNPDF2.3 LO [31] parton distribution function (PDF) set. The EvtGen v1.2.0 program [32] is used to describe the properties of the bottom and charm hadron decays in the signal samples.
The signal cross-sections are calculated at next-to-leading order (NLO) in the strong coupling constant, adding the resummation of soft gluon emission at next-to-leading-logarithmic accuracy (NLL) [33–37]. The nominal cross-section and its uncertainty are taken from an envelope of cross-section predictions using different PDF sets and factorisation and renormalisation scales [38,39].
Table 1: Simulated background event samples: the corresponding generator, parton shower, cross-section normal-isation, PDF set and underlying-event tune are shown.
Physics process Generator Parton shower Cross-section PDF set Tune
normalisation
W(→ ℓν) + jets Sherpa 2.1.1 [40] Sherpa 2.1.1 NNLO NLO CT10 Sherpa default
Z/γ∗(→ ℓℓ) + jets Sherpa 2.1.1 Sherpa 2.1.1 NNLO NLO CT10 Sherpa default
t¯t powheg-box v2 Pythia 6.428 [41] NNLO+NNLL NLO CT10 Perugia2012 [42]
Single-top
(t-channel) powheg-box v1 Pythia 6.428 NLO NLO CT10f4 Perugia2012
Single-top
(s- and Wt-channel) powheg-box v2 Pythia 6.428 NLO NLO CT10 Perugia2012
t¯t + W/Z/WW MG5_aMC@NLO 2.2.2 Pythia 8.186 NLO NNPDF2.3LO A14
WW, WZ and ZZ Sherpa 2.1.1 Sherpa 2.1.1 NLO NLO CT10 Sherpa default
The simulated event samples for the SM backgrounds are summarised in Table1, along with the PDFs and tunes used. Further samples are also used to assess systematic uncertainties, as explained in Section7. For the production of t¯t and single top quarks in the Wt and s-channel [43] the powheg-box v2 [44] gen-erator with the CT10 [45] PDF sets in the matrix-element calculations is used. Electroweak t-channel
single-top-quark events are generated using the powheg-box v1 generator. This generator uses the four-flavour scheme for the NLO matrix-element calculations together with the fixed four-four-flavour PDF set CT10f4. For all top-quark processes, top-quark spin correlations are preserved (for the single-top t-channel, top quarks are decayed using MadSpin [46]). The parton shower, fragmentation, and the un-derlying event are simulated using Pythia 6.428 with the CTEQ6L1 [47] PDF set and the corresponding Perugia2012 tune (P2012) [42]. The top-quark mass is assumed to be 172.5 GeV. The t¯t events are nor-malised to the NNLO+NNLL cross-sections. The single-top-quark events are nornor-malised to the NLO cross-sections.
Events containing W or Z bosons with associated jets (W/Z+jets) [48] are simulated using the Sherpa 2.1.1 generator with massive b/c-quarks. Matrix elements are calculated for up to two partons at NLO and four partons at leading order (LO). The matrix elements are calculated using the Comix [49] and Open-Loops [50] generators and merged with the Sherpa 2.1.1 parton shower [51] using the ME+PS@NLO prescription [52]. The CT10 PDF set is used in conjunction with a dedicated parton-shower tuning de-veloped by the Sherpa authors. The W/Z+jets events are normalised to their NNLO cross-sections [53]. The diboson samples [54] are generated with the same generator and PDF setup as the W/Z+jets samples described above. The diboson processes are simulated including final states with four charged leptons, three charged leptons and one neutrino, two charged leptons and two neutrinos, and one charged lepton and three neutrinos. The matrix elements contain all diagrams with four electroweak vertices. They are calculated for up to one parton (4ℓ, 2ℓ+2ν) or no additional partons (3ℓ+1ν, 1ℓ+3ν) at NLO and up to three partons at LO. The diboson cross-sections are taken from the NLO generator used.
For the t¯t + W/Z/WW processes [55], all events are simulated using MG5_aMC@NLO 2.2.2 at LO interfaced to the Pythia 8.186 parton shower model, with up to two (t¯t+ W), one (t¯t+ Z) or no (t¯t+ WW) extra partons included in the matrix element. The ATLAS underlying-event tune A14 is used together with the NNPDF2.3 LO PDF set. The events are normalised to their respective NLO cross-sections [56,
57].
The response of the detector to particles is modelled with a full ATLAS detector simulation [58] using Geant4 [59], or using a fast simulation [60] based on a parameterisation of the performance of the elec-tromagnetic and hadronic calorimeters and on Geant4 elsewhere. All background (signal) samples are prepared using the full (fast) detector simulation.
All simulated samples are generated with a varying number of minimum-bias interactions (simulated us-ing Pythia 8 with the MSTW2008LO PDF set [61] and the A2 tune [62]) overlaid on the hard-scattering event to model the multiple proton–proton interactions in the same and the nearby bunch crossings. Cor-rections are applied to the simulated samples to account for differences between data and simulation for trigger, identification and reconstruction efficiencies.
The proton–proton data analysed in this paper were collected by ATLAS in 2015 at a centre-of-mass en-ergy of 13 TeV. During this period the instantaneous luminosity of the LHC reached 5.0 × 1033cm−2s−1 with a mean number of additional pp interactions per bunch crossing of approximately 14. After ap-plication of data-quality requirements related to the beam and detector conditions, the total integrated luminosity amounts to 3.2 fb−1, with an associated uncertainty of ±5%. These values are derived follow-ing the same methodology as the one detailed in Ref. [63].
The data are collected using an EmissT trigger with a threshold of 70 GeV. This trigger is close to fully efficient after applying the requirement on the offline ETmissto be larger than 200 GeV.
4 Object reconstruction and identification
The reconstructed primary vertex of an event is required to be consistent with the interaction region and to have at least two associated tracks with pT >400 MeV. When more than one such vertex is found, the vertex with the largestP p2
Tof the associated tracks is chosen.
In the analysis, a distinction is made between preselected reconstructed objects, which fulfil a set of basic criteria and are used in the Emiss
T computation, and signal objects that enter the various control, validation and signal regions and are subject to more stringent requirements.
Jets are reconstructed from topological clusters in the calorimeters using the anti-kt algorithm with a radius parameter R = 0.4 [64,65]. Prior to jet reconstruction, clusters are calibrated to the electromagnetic scale response. Additional correction factors derived from simulation and data are applied to the measured jet energy to calibrate it to the particle level [65]. To mitigate the contributions from pile-up, the median energy density of all the jets in the event, multiplied by the jet area, is subtracted from the reconstructed jet energy [66,67]. Preselected jets are required to have pT >20 GeV and |η| < 4.5. The contamination from
cosmic rays, other sources of non-collision background and detector noise is suppressed using dedicated jet-quality criteria [68]: when such criteria are not fulfilled, the event is rejected.
Electron candidates are reconstructed using ID tracks matched to energy clusters in the electromagnetic calorimeter. They are identified according to the likelihood-based loose criteria [69]. Preselected electrons in the soft-lepton (hard-lepton) channel must satisfy pT > 7(10) GeV and |η| < 2.47. When the angular
separation ∆R = p(∆y)2+ (∆φ)2 between an electron candidate and a preselected jet amounts to 0.2 <
∆R(e, jet) < 0.4, the jet is retained and the electron is rejected to remove electrons originating from
b-hadron decays. Since all electrons are also reconstructed as jets, if ∆R(e, jet) < 0.2 the electron is kept and the jet is discarded. Finally, electron candidates with a ∆R(e, µ) < 0.01 with respect to a preselected muon (defined below) are rejected and the muon is kept to suppress the contribution of electron candidates from muon bremsstrahlung and subsequent photon conversion.
Muon candidates are reconstructed by combining tracks formed in the ID and the MS sub-systems. The Medium identification criteria are applied, which offer good efficiency and purity for the selected muons [70]. Preselected muons in the soft-lepton (hard-lepton) channel are required to have pT>6(10) GeV and
|η| < 2.4. Muons with an angular separation of ∆R(µ, jet) < 0.4 with respect to the closest preselected
jet are rejected, after the electron–jet overlap ambiguities are resolved. However, if the number of tracks with pT >500 MeV associated with the jet is less than three the jet is discarded and the muon kept. The EmissT is calculated as the magnitude of the negative vector sum of the transverse momenta of identified and calibrated muons, electrons, jets and photons, in addition to the soft-track term. The soft-track term is defined as the vectorial sum of the pTof all reconstructed tracks associated with the primary vertex that are not associated with the identified objects entering explicitly the EmissT computation [71,72].
Signal jets are required to have pT > 25 GeV and |η| < 2.8. A likelihood discriminant, the jet-vertex
tagger (JVT), is used to remove the residual contamination of pile-up jets. The JVT is constructed from track-based variables that are sensitive to the vertex of origin of the jet [73]. Jets with pT < 50 GeV,
|η| < 2.4, and JVT score less than 0.64 are rejected.
Signal jets containing b-hadrons are identified using the MV2c20 algorithm [74] and are hereafter referred to as b-tagged jets. The MV2c20 algorithm uses as input the impact parameters of all associated tracks and any reconstructed secondary vertex. The requirement chosen in the analysis provides an inclusive
b-tagging efficiency of 77% in simulated t¯t events, along with a rejection factor of 140 for gluon and light-quark jets and of 4.5 for charm jets [74,75].
Signal muons and electrons in the soft-lepton and hard-lepton channels are subject to an additional pT <35 GeV or pT ≥ 35 GeV requirement, respectively. Electrons must satisfy likelihood-based tight cri-teria which are defined in Ref. [69]. In both channels, signal leptons must satisfy the GradientLoose [70] isolation requirements, which rely on the use of tracking-based and calorimeter-based variables and im-plement a set of η- and pT-dependent criteria. The efficiency for prompt leptons with transverse mo-mentum < 40 GeV to satisfy the GradientLoose requirements is measured to be about 95% in Z → ℓℓ events, progressively rising up to 99% at 100 GeV [70].
To enforce compatibility with the primary vertex, the distance |z0·sin(θ)| is required to be less than 0.5 mm for signal lepton tracks, where z0is the longitudinal impact parameter with respect to the primary-vertex position. Moreover, in the transverse plane the distance of closest approach of the lepton track to the proton beam line, divided by the corresponding uncertainty, must be less than three for muons and less than five for electrons.
Reconstruction, identification and isolation efficiencies in simulation, when applicable, are calibrated to data for all reconstructed objects.
5 Event selection
Events selected by the trigger are further required to have a reconstructed primary vertex. An event is rejected if it contains a preselected jet which fails to satisfy the quality criteria designed to suppress non-collision backgrounds and detector noise [68]. Exactly one signal lepton is required in both the soft- and hard-lepton channels. Any event with additional preselected leptons is vetoed to suppress the dilepton t¯t, single-top (Wt-channel) and diboson backgrounds.
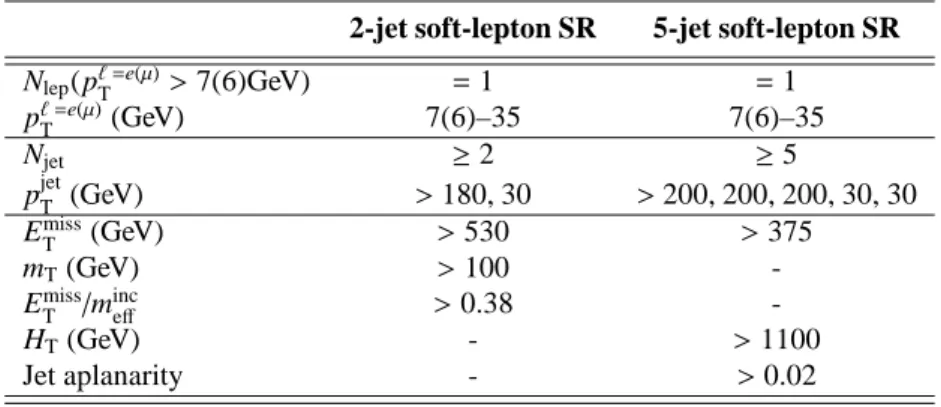
A dedicated optimisation study was performed to design signal region (SR) selection criteria and to maximise the signal sensitivity. Four hard-lepton signal regions and two soft-lepton signal regions are defined, targeting different mass hierarchy scenarios in the simplified model. The selection criteria used to define the signal regions are summarised in Table2for the soft-lepton channel and in Table3for the hard-lepton channel.
Table 2: Overview of the selection criteria for the soft-lepton signal regions. The symbol pℓ
Trefers to signal leptons.
2-jet soft-lepton SR 5-jet soft-lepton SR
Nlep(pℓT=e(µ)>7(6)GeV) = 1 = 1
pℓ T =e(µ)(GeV) 7(6)–35 7(6)–35 Njet ≥ 2 ≥ 5 pjetT (GeV) >180, 30 >200, 200, 200, 30, 30 Emiss T (GeV) >530 >375 mT(GeV) >100 -Emiss T /m inc eff >0.38 -HT(GeV) - >1100 Jet aplanarity - >0.02
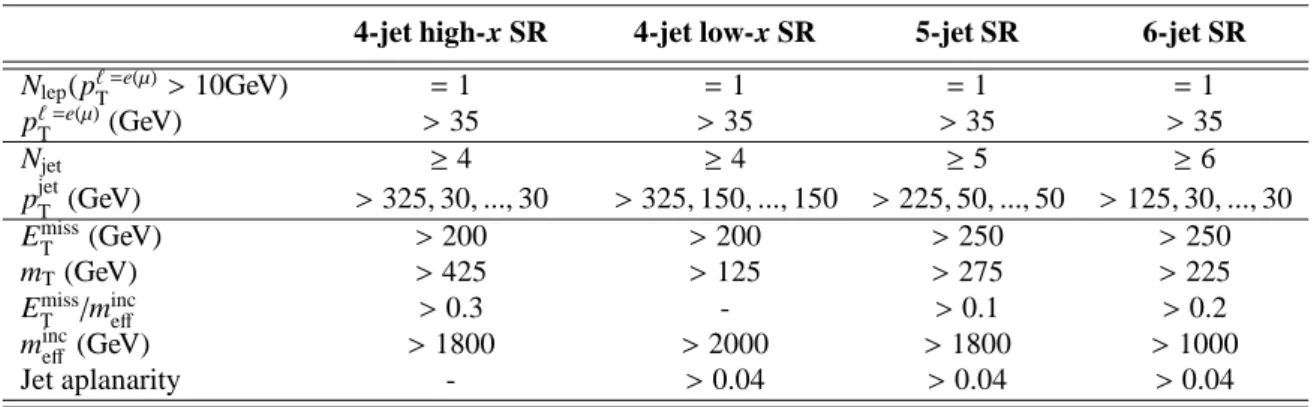
Table 3: Overview of the selection criteria for the hard-lepton signal regions. The symbol pℓ
Trefers to signal leptons.
The mass-ratio parameter x used in the signal region labels is defined in Section3.
4-jet high-x SR 4-jet low-x SR 5-jet SR 6-jet SR
Nlep(pℓT=e(µ)>10GeV) = 1 = 1 = 1 = 1
pℓT=e(µ)(GeV) >35 >35 >35 >35
Njet ≥ 4 ≥ 4 ≥ 5 ≥ 6
pjetT (GeV) >325, 30, ..., 30 >325, 150, ..., 150 >225, 50, ..., 50 >125, 30, ..., 30
ETmiss(GeV) >200 >200 >250 >250
mT(GeV) >425 >125 >275 >225
ETmiss/minceff >0.3 - >0.1 >0.2
minceff (GeV) >1800 >2000 >1800 >1000
Jet aplanarity - >0.04 >0.04 >0.04
The observables defined below are used in the event selection. The transverse mass (mT) of the lepton and the pmissT is defined as
mT=
q
2pℓTEmissT (1 − cos[∆φ(pℓT,pmissT )]), (1) where ∆φ( pℓT,pmissT ) is the azimuthal angle between the lepton and the missing transverse momentum. This is used in the soft-lepton 2-jet signal region and all hard-lepton signal regions to reject W+jets and semileptonic t¯t events.
The inclusive effective mass (minceff) is the scalar sum of the pTof the signal lepton and jets and the EmissT :
minceff = pℓT+
Njet X
j=1
pT, j+ EmissT , (2)
where the index j runs over all the signal jets in the event with pT >30 GeV. The inclusive effective mass provides good discrimination against SM backgrounds, without being too sensitive to the details of the SUSY cascade decay chain.
The transverse momentum scalar sum (HT) is defined as
HT= pℓT+ Njet X
j=1
pT, j, (3)
where the index j runs over all the signal jets in the event. The HTvariable is used to define the soft-lepton 5-jet signal region, as the many energetic jets in the signal model render this variable useful to separate signal from background.
The ratio ETmiss/minceff is used in both the soft- and hard-lepton channels; it provides good discrimination power between signal and background with fake EmissT due to instrumental effects.
Additional suppression of background processes is based on the aplanarity variable, which is defined as A = 32 λ3, where λ3 is the smallest eigenvalue of the normalised momentum tensor of the jets [76].
Typical measured values lie in the range 0 6 A < 0.3, with values near zero indicating relatively planar background-like events.
The hard-lepton 5-jet region targets scenarios with high gluino masses and low ˜χ01masses in models with the chargino mass mχ˜±
1 chosen such that the mass-ratio parameter x = 1/2. Tight requirements on mTand
minceff are applied. For the same set of models, the hard-lepton 6-jet region is designed to provide sensitivity to scenarios where the mass separation between the gluino and the neutralino is smaller. For this reason, the requirements on mT and minceff are relaxed with respect to the hard-lepton 5-jet region. Two distinct hard-lepton 4-jet regions are used, both designed to target models where the neutralino mass is fixed to 60 GeV, while the gluino mass and the mass-ratio x vary. The 4-jet high-x region is designed for regions of the parameter space where the W boson produced in the chargino decay is significantly boosted, leading to high-pTleptons. The main characteristics of signal events in the phase-space of this model are large mT values and relatively soft jets emitted from the gluino decays. In the 4-jet low-x region, the W boson tends to be virtual while the jets from the gluino decays tend to have high pTdue to the large gluino–chargino mass difference. Therefore, the mT requirement is relaxed and more stringent jet pT requirements are imposed.
The soft-lepton channels focus on models with compressed mass spectra. The soft-lepton 2-jet region provides sensitivity to scenarios characterised by a relatively heavy neutralino and a small mass separation between the gluino, the chargino, and the neutralino. Due to the small mass separation, most of the decay products tend to be low pT, or soft. Thus, a high-pT initial-state radiation (ISR) jet recoiling against the rest of the event is required, in order to enhance the kinematic properties of the signal and to provide separation with respect to the backgrounds. The soft-lepton 5-jet region is designed to be sensitive to the configurations in parameter space with a large mass gap between the gluino and chargino and a small separation between mχ˜±
1 and mχ˜01. As a consequence, several energetic jets from the decay of the two gluinos to the charginos are expected, while the virtual W bosons produced in the decay of the charginos result in low-pTjets and leptons.
6 Background estimation
The two dominant background processes in final states with one isolated lepton, multiple jets and large missing transverse momentum are t¯t and W+jets. The differential distributions arising from these two background processes as predicted from simulation are simultaneously normalised to the number of data events observed in dedicated control regions (CR), through the fitting procedure explained in Section8. The simulation is then used to extrapolate the measured background rates to the corresponding signal region.
The control regions are designed to have high purity in the process of interest, a small contamination from the signal model and enough events to result in a small statistical uncertainty in the background prediction. Moreover, they are designed to have kinematic properties resembling as closely as possible those of the signal regions, in order to provide good estimates of the kinematics of background processes there. This procedure limits the impact of potentially large systematic uncertainties in the expected yields.
Additional sources of background events are single-top events (s-channel, t-channel and associated pro-duction with a W boson), Z+jets and diboson processes (WW, WZ, ZZ, Wγ, Zγ), and t¯t propro-duction in association with a W or a Z boson. Their contributions are estimated entirely using simulated event samples normalised to the most accurate theoretical cross-sections available.
The contribution from multi-jet processes with a misidentified lepton is found to be negligible once lepton isolation criteria and a stringent EmissT requirement are imposed. A data-driven matrix method, follow-ing the implementation described in Ref. [16], confirms this background is consistent with zero. This is mainly a result of the improved lepton reconstruction and identification and the higher threshold on ETmisswith respect to the previous searches performed in this final state [16]. As this background is found to be negligible it is ignored in all aspects of the analysis.
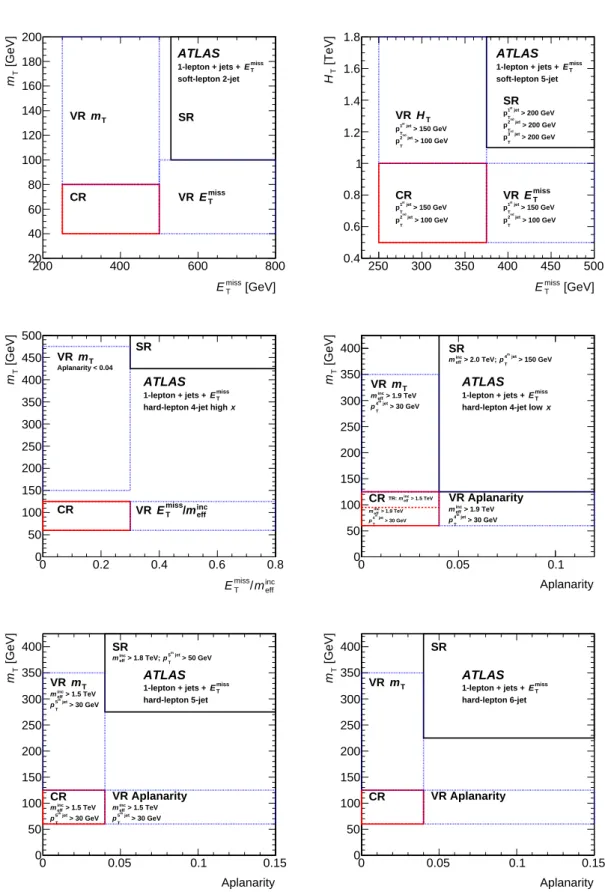
Figure2visualises the criteria that define the control regions in the soft-lepton and hard-lepton channels. Based on these, separate control regions are defined to extract the normalisation factors for t¯t and W+jets by requiring at least one, or no, b-tagged signal jets, respectively. The cross-contamination between these two types of control regions is accounted for in the fit.
Figure3shows the EmissT distribution in selected soft-lepton and hard-lepton control regions. The norm-alisation of the W+jets and t¯t simulations are adjusted to match the observed number of data events in the control region, so that the plots illustrate the modelling of the shape of each variable’s distribution. In general, good agreement between data and background simulations is found within the uncertainties in all the control regions used in the analysis.
To gain confidence in the extrapolation from control to signal regions using simulated event samples, the results of the simultaneous fit are cross-checked in validation regions which are disjoint with both the control and signal regions. The validation regions are designed to be kinematically close to the signal regions, as shown in Fig.2, while expecting only a small contamination from the signal in the models considered in this search. The validation regions are not used to constrain parameters in the fit, but provide a statistically independent cross-check of the extrapolation.
This analysis uses two validation regions per signal region. In the hard-lepton channel, one of the valid-ation regions is used to test the extrapolvalid-ation to larger mT values, while the other validation region tests the extrapolation to larger aplanarity values or, in the case of the 4-jet high-x selection, to larger values in ETmiss/mincleff . In the soft-lepton channel, the validation regions are used to test the extrapolation to larger ETmiss, mTor HTvalues.
7 Systematic uncertainties
Two categories of systematic uncertainties have an impact on the results presented here: uncertainties arising from experimental effects, and uncertainties associated with theoretical predictions and modelling. Their effects are evaluated for all signal samples and background processes. Since the normalisation of the dominant background processes is extracted in dedicated control regions, the systematic uncertainties only affect the extrapolation to the signal regions in these cases.
Among the dominant experimental systematic uncertainties are the jet energy scale (JES) and resolution (JER) and the muon momentum resolution. The jet uncertainties are derived as a function of pTand η of the jet, as well as of the pile-up conditions and the jet flavour composition of the selected jet sample. They are determined using a combination of simulated samples and studies of data, such as measurements of the jet balance in dijet, Z+jet and γ+jet events [77]. The J/ψ → ℓ+ℓ−, W±→ ℓ±νand Z → ℓ+ℓ−decays in data and simulation are exploited to estimate the uncertainties in lepton reconstruction, identification, momentum/energy scale and resolution, and isolation criteria [69, 70]. In particular, muon momentum resolution and scale calibrations are derived for simulation from a template fit that compares the invariant
[GeV] miss T E 200 400 600 800 [GeV] T m 20 40 60 80 100 120 140 160 180 200 SR CR T m VR miss T E VR ATLAS miss T E 1-lepton + jets + soft-lepton 2-jet [GeV] miss T E 250 300 350 400 450 500 [TeV]T H 0.4 0.6 0.8 1 1.2 1.4 1.6 1.8 SR > 200 GeV jet st 1 T p > 200 GeV jet nd 2 T p > 200 GeV jet rd 3 T p CR > 150 GeV jet st 1 T p > 100 GeV jet nd 2 T p T H VR > 150 GeV jet st 1 T p > 100 GeV jet nd 2 T p miss T E VR > 150 GeV jet st 1 T p > 100 GeV jet nd 2 T p ATLAS miss T E 1-lepton + jets + soft-lepton 5-jet inc eff m / miss T E 0 0.2 0.4 0.6 0.8 [GeV] T m 0 50 100 150 200 250 300 350 400 450 500 SR CR T m VR Aplanarity < 0.04 inc eff m / miss T E VR ATLAS miss T E 1-lepton + jets + x
hard-lepton 4-jet high
Aplanarity 0 0.05 0.1 [GeV] T m 0 50 100 150 200 250 300 350 400 SR > 150 GeV jet th 4 T p > 2.0 TeV; inc eff m CR > 1.9 TeV inc eff m > 30 GeV jet th 4 T p > 1.5 TeV inc eff m TR: T m VR > 1.9 TeV inc eff m > 30 GeV jet th 4 T p VR Aplanarity > 1.9 TeV inc eff m > 30 GeV jet th 4 T p ATLAS miss T E 1-lepton + jets + x
hard-lepton 4-jet low
Aplanarity 0 0.05 0.1 0.15 [GeV]T m 0 50 100 150 200 250 300 350 400 SR > 50 GeV jet th 5 T p > 1.8 TeV; inc eff m CR > 1.5 TeV inc eff m > 30 GeV jet th 5 T p T m VR > 1.5 TeV inc eff m > 30 GeV jet th 5 T p VR Aplanarity > 1.5 TeV inc eff m > 30 GeV jet th 5 T p ATLAS miss T E 1-lepton + jets + hard-lepton 5-jet Aplanarity 0 0.05 0.1 0.15 [GeV]T m 0 50 100 150 200 250 300 350 400 SR CR T m VR VR Aplanarity ATLAS miss T E 1-lepton + jets + hard-lepton 6-jet
Figure 2: Graphical illustration of the soft-lepton 2-jet (top left), soft-lepton 5-jet (top right), hard-lepton 4-jet
high-x (middle left), 4-jet low-high-x (middle right), 5-jet (bottom left) and 6-jet (bottom right) signal (SR), control (CR) and
validation (VR) regions. In addition to the two variables shown on the x and y axes, labels indicate other event selections that differ between the corresponding control regions, validation regions, and signal regions. The control regions exist in two variants: the t¯t control regions require at least one b-tagged jet, while no b-tagged jets are required in the W+jets control regions.
Events / 50 GeV 1 − 10 1 10 2 10 3 10 s = 13 TeV, 3.2 fb-1 ATLAS Hard-lepton 6-jet CR t t Data Total SM t t W+jets Diboson Single top Others [GeV] miss T E 250 300 350 400 450 500 550 600 Data / SM 0 1 2 Events / 50 GeV 1 − 10 1 10 2 10 3 10 -1 = 13 TeV, 3.2 fb s ATLAS Hard-lepton 6-jet W+jets CR Data Total SM t t W+jets Diboson Single top Others [GeV] miss T E 250 300 350 400 450 500 550 600 Data / SM 0 1 2 Events / 90 GeV 1 − 10 1 10 2 10 3 10 4 10 5 10 6 10 -1 = 13 TeV, 3.2 fb s ATLAS Soft-lepton 2-jet CR t t Data Total SM t t W+jets Diboson Single top Others [GeV] miss T E 250 300 350 400 450 500 550 600 650 700 Data / SM 0 1 2 Events / 90 GeV 1 − 10 1 10 2 10 3 10 4 10 5 10 6 10 7 10 -1 = 13 TeV, 3.2 fb s ATLAS Soft-lepton 2-jet W+jets CR Data Total SM t t W+jets Diboson Single top Others [GeV] miss T E 250 300 350 400 450 500 550 600 650 700 Data / SM 0 1 2
Figure 3: The distribution of the missing transverse momentum is shown in hard-lepton 6-jet t¯t (top left) and W+jets (top right) and in the soft-lepton 2-jet t¯t (bottom left) and W+jets (bottom right) control regions after normalising the t¯t and W+jets background processes in the simultaneous fit. In the soft-lepton 2-jet plots, the upper bound on
Emiss
T defining the control region is not applied. The lower panels of the plots show the ratio of the observed data
to the total SM background expected from simulations scaled to the number of events observed in the data. The
uncertainty bands include all statistical and systematic uncertainties on simulation, as discussed in Section7. The
mass of Z → µµ and J/ψ → µµ candidates in data and simulation. The corresponding uncertainties are computed from variations of several fit parameters, following the procedure described in Ref. [78]. The simulation is reweighted to match the distribution of the average number of proton-proton interactions per bunch crossing observed in data. In the signal regions characterised by a higher jet multiplicity, the uncertainty arising from this reweighting also becomes relevant.
The systematic uncertainties related to the modelling of EmissT in the simulation are estimated by propagat-ing the uncertainties on the energy and momentum scale of each of the objects enterpropagat-ing the calculation, as well as the uncertainties on the soft term resolution and scale.
Different uncertainties in the theoretical modelling of the SM production processes are considered, as described in the following.
For t¯t, single-top and W/Z+jets samples, the uncertainties related to the choice of QCD renormalisation and factorisation scales are assessed by varying the corresponding generator parameters up and down by a factor of two around their nominal values. Uncertainties in the resummation scale and the matching scale between matrix elements and parton shower are evaluated for the W+jets samples by varying up and down by a factor of two the corresponding parameters in Sherpa .
For t¯t and single-top production, specific samples with an increased and decreased amount of initial-and final-state radiation are compared to the nominal sample. The relative difference in the extrapola-tion factors (t¯t) or expected rates (single-top) is assigned as an uncertainty. Moreover, the uncertainty associated with the parton shower modelling is assessed as the difference between the predictions from
powheg+Pythia and powheg+Herwig++2[79].
An uncertainty arising from the choice of parton level generator is estimated for t¯t, diboson and W/Z+jets processes. In the former case, the predictions from powheg-box are compared to aMc@NLO3 [80]; for dibosons, Sherpa is compared to powheg-box; for W/Z+jets, Sherpa is compared to Madgraph [81]. An uncertainty of 5% in the inclusive Z+jets cross-section is assumed [82]. Uncertainties in the inclusive single-top cross-sections are assigned as 3.7% (s-channel, top), 4.7% (s-channel, anti-top), 4% (t-channel, top), 5% (t-channel, anti-top) and 5.3% (Wt-channel) [83]. Samples using diagram subtraction and dia-gram removal schemes are compared for assessing the sensitivity to the treatment of interference effects between single-top and t¯t production at NLO.
An overall systematic uncertainty of 6% in the inclusive cross-section is assigned to the small contribution from WW, WZ, ZZ, Wγ and Zγ processes, which are estimated entirely from simulation. The uncertainty accounts for missing higher-order corrections, for the uncertainty in the value of the strong coupling constant, and for the uncertainties on the PDF sets. The uncertainties associated with the resummation, factorisation and renormalisation scales are computed by varying the corresponding Sherpa parameters. For the very small contributions of t¯t + W/Z/WW, an uncertainty of 30% is assigned.
Among the main systematic uncertainties on the total background predictions in the various signal regions are the ones associated with the finite size of the MC samples, which range from 11% in the hard-lepton 6-jet SR to 33% in the hard-hard-lepton 4-jet high-x SR. Moreover, the uncertanties associated with the normalisation of the t¯t background, ranging from 7% in the soft-lepton 5-jet SR to 21% in the hard-lepton 4-jet low-x SR. Further important uncertainties are the theoretical uncertainties associated with the
2The Herwig++ version 2.7.1 used.
single-top background in the hard-lepton regions, which amount to 3% in the 4-jet high-x signal region and increase to as much as 34% in the 4-jet low-x signal region, and the theoretical uncertainties on the W+jets background in the soft-lepton regions (up to 11%).
The theoretical systematic uncertainty affecting the modelling of ISR can become sizeable in the sim-plified signal models used in this analysis, especially when the SUSY particles’ mass splitting becomes small. Variations of a factor of two in the following Madgraph and Pythia parameters are used to estimate these uncertainties: the renormalisation and factorisation scales, the initial- and the final-state radiation scales, as well as the Madgraph jet matching scale. The overall uncertainties range from about 5% for signal models with large mass differences between the gluino, the chargino, and the neutralino, to 25% for models with very compressed mass spectra.
8 Statistical analysis
The final results are based on a profile likelihood method [84] using the HistFitter framework [85]. To obtain a set of background predictions that is independent of the observation in the signal regions, the fit can be configured to use only the control regions to constrain the fit parameters; this is referred to as the background-only fit. For each signal region a background-only fit is performed, based on the following inputs:
• the observed number of events in each of the control regions associated with the signal region,
together with the number of events expected from simulation;
• the extrapolation factors, including uncertainties, from control regions to the signal region, as
ob-tained from simulation, for the W+jets and the t¯t backgrounds;
• the yields of the smaller backgrounds such as the single-top, t¯t+V, Z+jets and diboson backgrounds
as obtained from simulation, including uncertainties.
Using this information a likelihood is constructed for every background-only fit. It consists of a product of Poisson probability density functions for every region and of constraint terms for systematic uncertainties as described below.
Multiple parameters are included in each likelihood: two normalisation parameters describing the nor-malisation of the W+jets and t¯t backgrounds and nuisance parameters associated with the systematic uncertainties (as described in Section 7) or the statistical uncertainties in simulated event yields. The nuisance parameters associated with the systematic uncertainties are constrained by Gaussian functions with their widths corresponding to the size of the uncertainty, while the statistical uncertainties are con-strained by Poisson functions. The parameters are correlated between the control regions and the signal region.
In the fit, the likelihood is maximised by adjusting normalisation and nuisance parameters. The nor-malisation scale factor of the t¯t background is fitted to values between 0.34+0.28−0.25 (4-jet high-x control regions) and 0.92+0.14−0.12 (5-jet soft-lepton control regions), the normalisation of the W+jets background to values between 0.72+0.31−0.33(6-jet control regions) and 1.00 ± 0.04 (2-jet soft-lepton control regions). Previ-ous analyses [16] also found normalisation factors considerably smaller than unity for these background processes in similarly extreme regions of phase space. The fit introduces correlations between the nor-malisation parameters associated with the t¯t and the W+jets backgrounds and the nuisance parameters
Table 4: Background fit results for the hard-lepton and soft-lepton signal regions, for an integrated luminosity of
3.2 fb−1. Uncertainties in the fitted background estimates combine statistical (in the simulated event yields) and
systematic uncertainties. The uncertainties in this table are symmetrised for propagation purposes but truncated at zero to remain within the physical boundaries.
Hard-lepton Soft-lepton
4-jet low x 4-jet high x 5-jet 6-jet 2-jet 5-jet
Observed events 1 0 0 10 2 9
Fitted background events 1.3 ± 0.5 0.9 ± 0.5 1.3 ± 0.6 4.4 ± 1.0 3.6 ± 0.7 7.7 ± 1.9
t¯t 0.40 ± 0.31 0.08 ± 0.07 0.40 ± 0.24 2.5 ± 0.9 0.64 ± 0.33 3.6 ± 1.2 W+jets 0.19 ± 0.12 0.8 ± 0.5 0.16 ± 0.12 0.23 ± 0.16 1.9 ± 0.5 2.5 ± 1.3 Z+jets 0.045 ± 0.023 0.028 ± 0.027 0.073 ± 0.035 0.08 ± 0.08 0.47 ± 0.12 0.09 ± 0.04 Single-top 0.5 ± 0.5 0.04+0.10 −0.04 0.21 +0.22 −0.21 0.4 ± 0.4 0.16 ± 0.14 0.42 ± 0.33 Diboson 0.06+0.20 −0.06 0.002 +0.014 −0.002 0.37 ± 0.23 0.9 ± 0.5 0.38 ± 0.16 0.9 ± 0.6 t¯t+V 0.048 ± 0.021 0.024 ± 0.012 0.059 ± 0.029 0.23 ± 0.08 0.085 ± 0.028 0.065 ± 0.024
associated with systematic uncertainties. The uncertainty in the total background estimate may thus be smaller or larger than the sum in quadrature of the individual uncertainties.
9 Results
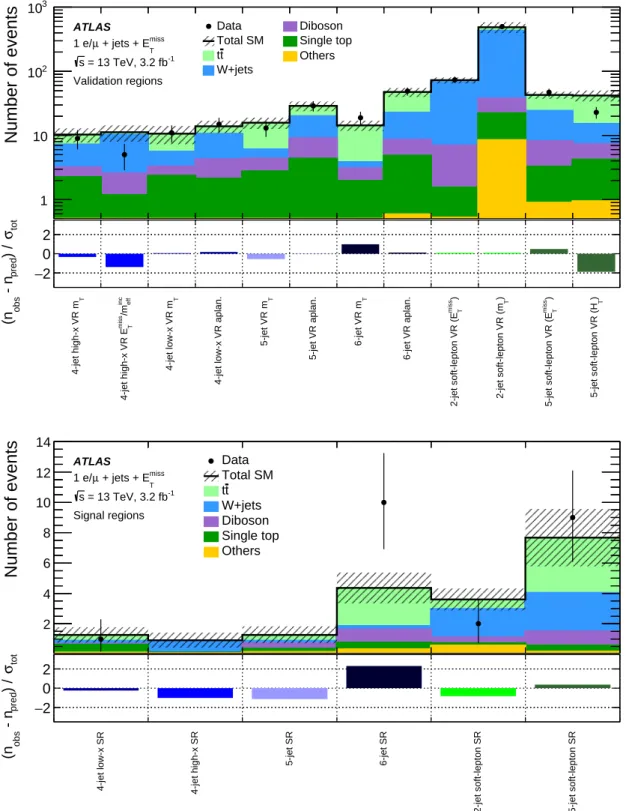
The results of the background-only fit described in Section8in the validation and signal regions are shown in Fig.4and are further detailed for the signal regions in Table4. Good agreement between predicted and observed event yields is seen in all validation regions.
Figure5shows the mT, ETmissand EmissT /mincleff distributions before applying the requirement on the plotted variable in the signal regions.
The predicted background yields and the observed number of events agree in all signal regions. The largest deviation, 2.1 standard deviations, is observed in the 6-jet hard-lepton signal region. This excess arises only from the muon channel, in which 8 events are observed, while 2.5 ± 0.7 events are predicted (local significance of 2.6 standard deviations). The electron channel shows good agreement, with 2 events observed and 1.9 ± 0.6 predicted.
Model-independent upper limits and discovery p-values [85] in the signal regions are calculated in a modified fit configuration with respect to the background-only fit. The only region considered in these fits is the respective signal region. Control regions are not explicitly included and thus any signal con-tamination in the control regions is not taken into account, thus giving conservative limits. These fits use the background estimates as derived in the background-only fits as input and allow for a non-negative signal contribution in the signal region. An additional normalisation parameter for the signal contribution is included.
Observed and expected upper limits at 95% confidence level (CL) on the number of events signifying new phenomena beyond the SM (S95obsand S95
exp, respectively) are derived based on the CLsprescription [86] and are shown in Table5together with the upper limits on the visible beyond the SM cross-section (σvis,
VR4Jhighx_mtEM_cutsVR4Jhighx_meffEM_cutsVR4Jlowx_mtEM_cutsVR4Jlowx_aplanarityEM_cutsVR5J_mtEM_cutsVR5J_aplanarityEM_cutsVR6J_mtEM_cutsVR6J_aplanarityEM_cuts2-jet soft-lepton VR (E2-jet soft-lepton VR (m5-jet soft-lepton VR (E5-jet soft-lepton VR (H Number of events 1 10 2 10 3 10 Data Total SM t t W+jets Diboson Single top Others ATLAS miss T + jets + E µ 1 e/ -1 = 13 TeV, 3.2 fb s Validation regions T 4-jet high-x VR m inc eff /m miss T 4-jet high-x VR E T 4-jet low-x VR m
4-jet low-x VR aplan.
T 5-jet VR m 5-jet VR aplan. T 6-jet VR m 6-jet VR aplan. ) miss T 2-jet soft-lepton VR (E ) T 2-jet soft-lepton VR (m ) miss T 5-jet soft-lepton VR (E ) T 5-jet soft-lepton VR (H tot σ ) / pred - n obs (n 2 − 0 2
SR4JlowxEM_cuts SR4JhighxEM_cutsSR5JEM_cuts SR6JEM_cuts 2-jet soft-lepton SR5-jet soft-lepton SR
Number of events 2 4 6 8 10 12 14 Data Total SM t t W+jets Diboson Single top Others ATLAS miss T + jets + E µ 1 e/ -1 = 13 TeV, 3.2 fb s Signal regions
4-jet low-x SR 4-jet high-x SR
5-jet SR 6-jet SR
2-jet soft-lepton SR 5-jet soft-lepton SR
tot σ ) / pred - n obs (n 2 − 0 2
Figure 4: Expected background yields as obtained in the background-only fits in all hard-lepton and soft-lepton validation (top plot) and signal (bottom plot) regions together with observed data are given in the top parts of the plots. Uncertainties in the fitted background estimates combine statistical (in the simulated event yields) and
Events / 60 GeV 1 − 10 1 10 2 10 -1 = 13 TeV, 3.2 fb s ATLAS Hard lepton 4-jet low-x Data Total SM t t W+jets Diboson Single top Others )=(1400,160,60) GeV 1 0 χ∼ , 1 ± χ∼ , g ~ m( [GeV] T m 100 150 200 250 300 350 400 450 Data / SM 0 1 2 Events / 0.1 1 − 10 1 10 2 10 -1 = 13 TeV, 3.2 fb s ATLAS Hard lepton 4-jet high-x Data Total SM t t W+jets Diboson Single top Others )=(1400,1300,60) GeV 1 0 χ∼ , 1 ± χ∼ , g ~ m( inc eff / m miss T E 0.1 0.15 0.2 0.25 0.3 0.35 0.4 0.45 0.5 Data / SM 0 1 2 Events / 50 GeV 1 − 10 1 10 2 10 -1 = 13 TeV, 3.2 fb s ATLAS
Hard lepton 5-jet
Data Total SM t t W+jets Diboson Single top Others )=(1385,705,25) GeV 1 0 χ∼ , 1 ± χ∼ , g ~ m( [GeV] T m 50 100 150 200 250 300 350 400 450 Data / SM 0 1 2 Events / 80 GeV 1 − 10 1 10 2 10 3 10 -1 = 13 TeV, 3.2 fb s ATLAS
Hard lepton 6-jet
Data Total SM t t W+jets Diboson Single top Others )=(1105,865,625) GeV 1 0 χ∼ , 1 ± χ∼ , g ~ m( [GeV] T m 100 150 200 250 300 350 400 450 500 Data / SM 0 1 2 Events / 100 GeV 1 − 10 1 10 2 10 3 10 s = 13 TeV, 3.2 fb-1 ATLAS
Soft lepton 2-jets
Data Total SM t t W+jets Diboson Single top Others )=(785,705,625) GeV 1 0 χ∼ , 1 ± χ∼ , g ~ m( [GeV] miss T E 350 400 450 500 550 600 Data / SM 0 1 2 Events / 60 GeV 1 − 10 1 10 2 10 3 10 -1 = 13 TeV, 3.2 fb s ATLAS
Soft lepton 5-jets
Data Total SM t t W+jets Diboson Single top Others )=(1000,110,60) GeV 1 0 χ∼ , 1 ± χ∼ , g ~ m( [GeV] miss T E 350 400 450 500 550 600 Data / SM 0 1 2
Figure 5: Distributions of mT for the hard-lepton 4-jet low-x (top left), 5-jet (middle left), 6-jet (middle right)
signal regions, of Emiss
T /m incl
eff for the 4-jet high-x signal region (top right) and of E
miss
T for the soft-lepton 2-jet
(bottom left) and soft-lepton 5-jet (bottom right) signal regions. The requirement on the variable plotted is removed from the definitions of the signal regions, where the arrow indicates the position of the cut in the signal region. The lower panels of the plots show the ratio of the observed data to the total background prediction as derived in the background-only fit. The uncertainty bands plotted include all statistical and systematic uncertainties as discussed
Table 5: The columns show from left to right: the name of the respective signal region; the 95% confidence level
(CL) upper limits on the visible cross-section (hǫσi95
obs) and on the number of signal events (S
95
obs); the 95% CL upper
limit on the number of signal events (S95
exp), given the expected number (and ±1σ variations on the expectation) of
background events; the two-sided CLbvalue, i.e. the confidence level observed for the background-only hypothesis
and the one-sided discovery p-value (p(s = 0)). The discovery p-values are capped to 0.5 in the case of observing less events than the fitted background estimates.
Signal region hǫσi95obs[fb] S95obs S95exp CLb p(s = 0)
Hard-lepton 4-jet low-x 1.23 3.9 4.1+1.5−0.9 0.46 0.50 4-jet high-x 0.87 2.8 2.9+1.3−0.2 0.27 0.50 5-jet 0.87 2.8 3.5+1.4−0.7 0.19 0.50 6-jet 3.90 12.5 6.5+2.6−1.6 0.98 0.02 Soft-lepton 2-jet 1.33 4.3 5.3+2.2−1.3 0.23 0.50 5-jet 2.87 9.2 8.1+2.9−2.1 0.68 0.34
defined as the product of acceptance, selection efficiency and production cross-section). The latter is calculated by dividing the observed upper limit on the beyond-SM events by the integrated luminosity of 3.2 fb−1. The table also gives the background-only confidence level CLb.
Table5also shows the discovery p-values, giving the probability for the background-only assumption to produce event yields greater or equal to the observed data. The CLband p-values use different definitions of test statistics in their calculation, the former with the signal-strength parameter set to one and the latter to zero.
Model-dependent limits are calculated in a modified fit configuration with respect to the background-only fit. A signal contribution is allowed and considered in all control and signal regions, with a non-negative signal-strength normalisation parameter included. For the signal processes, uncertainties due to detector effects and theoretical modelling are considered. The signal regions are explicitly used in the fit to constrain the likelihood parameters. Figure6shows the combined 95% CL exclusion limits in the simplified models with gluino production using for each model point the signal region with the best expected sensitivity. Gluino masses up to 1.6 TeV are excluded for scenarios with large mass differences between the gluino and the neutralino and x = (mχ˜±1 − mχ˜0
1)/(m˜g− mχ˜ 0
1) = 1/2. In the same scenario and for models with a small mass difference between the gluino and the neutralino, gluino masses up to 870 GeV are excluded. The signal regions address very different sets of models and are complementary to each other. In the case of the hard-lepton 6-jet signal region (covering the central part in the (m˜g,mχ˜0
1)
mass plane in Fig.6), the observed exclusion limit is considerably weaker than the expected one due to the excess seen in this region.
[GeV] g ~ m 400 600 800 1000 1200 1400 1600 1800 2000 [GeV]0 1 χ∼ m 200 400 600 800 1000 1200 1400 ) ) = 1/2 1 0 χ∼ ) - m( g ~ ) ) / ( m( 1 0 χ∼ ) - m( 1 ± χ∼ , x = (m( 0 1 χ∼ 0 1 χ∼ qqqqWW → g ~ -g ~ ) theory SUSY σ 1 ± Observed limit ( ) exp σ 1 ± Expected limit ( -1 =13 TeV, 3.2 fb s miss T + jets + E µ 1 e/ 1 0 χ ∼ < m g ~ m -1 ATLAS 8 TeV, 20.3 fb observed expected All limits at 95% CL
ATLAS
[GeV] g ~ m 1000 1200 1400 1600 1800 2000 ) 0 1 χ∼ - m g~ ) / ( m0 1 χ∼ - m± χ∼ 1 x = ( m 0 0.2 0.4 0.6 0.8 1 1.2 1.4 ) = 60 GeV 0 1 χ∼ , m( 0 1 χ∼ 0 1 χ∼ qqqqWW → g ~ -g ~ -1 =13 TeV, 3.2 fb s ) theory SUSY σ 1 ± Observed limit ( ) exp σ 1 ± Expected limit ( miss T + jets + E µ 1 e/ -1 ATLAS 8 TeV, 20.3 fb observed expected All limits at 95% CLATLAS
Figure 6: Combined 95% CL exclusion limits in the two gluino simplified models using for each model point the
signal region with the best expected sensitivity. The limits are presented in the (m˜g,mχ˜0
1) mass plane (top) for the
scenario where the mass of the chargino ˜χ±1 is fixed to x = (mχ˜±
1 − mχ˜01)/(m˜g− mχ˜
0
1) = 1/2 and in the (m˜g,x) plane
(bottom) for the mχ˜0
1 = 60 GeV models. The red solid line corresponds to the observed limit with the red dotted
lines indicating the ±1σ variation of this limit due to the effect of theoretical scale and PDF uncertainties in the signal cross-section. The dark grey dashed line indicates the expected limit with the yellow band representing the
±1σ variation of the median expected limit due to the experimental and theoretical uncertainties. The exclusion
10 Conclusion
A search for gluinos in events with one isolated lepton, jets, and missing transverse momentum is presen-ted. The analysis uses 3.2 fb−1 of proton–proton collision data collected by the ATLAS experiment in 2015 at √s = 13 TeV at the LHC. Six signal regions requiring at least two to six jets are used to cover a broad spectrum of the targeted SUSY model parameter space. While four signal regions are based on high-pT lepton selections and target models with large mass differences between the supersymmetric particles, two dedicated low-pT lepton regions are designed to enhance the sensitivity to models with compressed mass spectra.
The observed data agree with the Standard Model background prediction in the signal regions. The largest deviation is a 2.1 standard deviation excess in a channel requiring a high-pT lepton and six jets. For all signal regions, limits on the visible cross-section are derived in models of new physics within the kinematic requirements of this search. In addition, exclusion limits are placed on models with gluino production and subsequent decays via an intermediate chargino to the lightest neutralino. The exclusion limits of previous searches conducted in LHC Run 1 are significantly extended. Gluino masses up to 1.6 TeV are excluded for low neutralino masses (. 300 GeV) and chargino masses of ∼ 850 GeV.
Acknowledgements
We thank CERN for the very successful operation of the LHC, as well as the support staff from our institutions without whom ATLAS could not be operated efficiently.
We acknowledge the support of ANPCyT, Argentina; YerPhI, Armenia; ARC, Australia; BMWFW and FWF, Austria; ANAS, Azerbaijan; SSTC, Belarus; CNPq and FAPESP, Brazil; NSERC, NRC and CFI, Canada; CERN; CONICYT, Chile; CAS, MOST and NSFC, China; COLCIENCIAS, Colombia; MSMT CR, MPO CR and VSC CR, Czech Republic; DNRF and DNSRC, Denmark; IN2P3-CNRS, CEA-DSM/IRFU, France; GNSF, Georgia; BMBF, HGF, and MPG, Germany; GSRT, Greece; RGC, Hong Kong SAR, China; ISF, I-CORE and Benoziyo Center, Israel; INFN, Italy; MEXT and JSPS, Japan; CNRST, Morocco; FOM and NWO, Netherlands; RCN, Norway; MNiSW and NCN, Poland; FCT, Por-tugal; MNE/IFA, Romania; MES of Russia and NRC KI, Russian Federation; JINR; MESTD, Serbia; MSSR, Slovakia; ARRS and MIZŠ, Slovenia; DST/NRF, South Africa; MINECO, Spain; SRC and Wallenberg Foundation, Sweden; SERI, SNSF and Cantons of Bern and Geneva, Switzerland; MOST, Taiwan; TAEK, Turkey; STFC, United Kingdom; DOE and NSF, United States of America. In addition, individual groups and members have received support from BCKDF, the Canada Council, CANARIE, CRC, Compute Canada, FQRNT, and the Ontario Innovation Trust, Canada; EPLANET, ERC, FP7, Ho-rizon 2020 and Marie Skłodowska-Curie Actions, European Union; Investissements d’Avenir Labex and Idex, ANR, Région Auvergne and Fondation Partager le Savoir, France; DFG and AvH Foundation, Ger-many; Herakleitos, Thales and Aristeia programmes co-financed by EU-ESF and the Greek NSRF; BSF, GIF and Minerva, Israel; BRF, Norway; Generalitat de Catalunya, Generalitat Valenciana, Spain; the Royal Society and Leverhulme Trust, United Kingdom.
The crucial computing support from all WLCG partners is acknowledged gratefully, in particular from CERN, the ATLAS Tier-1 facilities at TRIUMF (Canada), NDGF (Denmark, Norway, Sweden), CC-IN2P3 (France), KIT/GridKA (Germany), INFN-CNAF (Italy), NL-T1 (Netherlands), PIC (Spain), ASGC
(Taiwan), RAL (UK) and BNL (USA), the Tier-2 facilities worldwide and large non-WLCG resource pro-viders. Major contributors of computing resources are listed in Ref. [87].
References
[1] Yu. A. Golfand and E. P. Likhtman,
Extension of the Algebra of Poincare Group Generators and Violation of p Invariance, JETP Lett. 13 (1971) 323–326, [Pisma Zh. Eksp. Teor. Fiz.13,452(1971)].
[2] D. V. Volkov and V. P. Akulov, Is the Neutrino a Goldstone Particle?,
Phys. Lett. B 46 (1973) 109–110.
[3] J. Wess and B. Zumino, Supergauge Transformations in Four-Dimensions,
Nucl. Phys. B 70 (1974) 39–50.
[4] J. Wess and B. Zumino, Supergauge Invariant Extension of Quantum Electrodynamics,
Nucl. Phys. B 78 (1974) 1.
[5] S. Ferrara and B. Zumino, Supergauge Invariant Yang-Mills Theories,
Nucl. Phys. B 79 (1974) 413.
[6] A. Salam and J. A. Strathdee, Supersymmetry and Nonabelian Gauges,
Phys. Lett. B 51 (1974) 353–355.
[7] P. Fayet, Supersymmetry and Weak, Electromagnetic and Strong Interactions,
Phys. Lett. B 64 (1976) 159.
[8] P. Fayet, Spontaneously Broken Supersymmetric Theories of Weak, Electromagnetic and Strong Interactions,Phys. Lett. B 69 (1977) 489.
[9] N. Sakai, Naturalness in Supersymmetric Guts,Z. Phys. C 11 (1981) 153.
[10] S. Dimopoulos, S. Raby and F. Wilczek, Supersymmetry and the Scale of Unification,
Phys. Rev. D 24 (1981) 1681–1683.
[11] L. E. Ibañez and G. G. Ross, Low-Energy Predictions in Supersymmetric Grand Unified Theories,
Phys. Lett. B 105 (1981) 439.
[12] S. Dimopoulos and H. Georgi, Softly Broken Supersymmetry and SU(5),
Nucl. Phys. B 193 (1981) 150.
[13] G. R. Farrar and P. Fayet, Phenomenology of the Production, Decay, and Detection of New Hadronic States Associated with Supersymmetry,Phys. Lett. B 76 (1978) 575–579. [14] H. Goldberg, Constraint on the Photino Mass from Cosmology,
Phys. Rev. Lett. 50 (1983) 1419, [Erratum: Phys. Rev. Lett.103,099905(2009)].
[15] J. R. Ellis et al., Supersymmetric Relics from the Big Bang,Nucl. Phys. B 238 (1984) 453–476. [16] ATLAS Collaboration, Search for squarks and gluinos in events with isolated leptons, jets and
missing transverse momentum at √s = 8 TeV with the ATLAS detector,JHEP 04 (2015) 116, arXiv:1501.03555 [hep-ex].
[17] ATLAS Collaboration, Summary of the searches for squarks and gluinos using √s = 8 TeV pp collisions with the ATLAS experiment at the LHC,JHEP 10 (2015) 054,
[18] CMS Collaboration,
Search for new physics in events with same-sign dileptons and jets in pp collisions at √s = 8 TeV,
JHEP 01 (2014) 163, [Erratum: JHEP01,014(2015)], arXiv:1311.6736.
[19] CMS Collaboration, Search for new physics in the multijet and missing transverse momentum final state in proton-proton collisions at √s= 8 TeV,JHEP 06 (2014) 055,
arXiv:1402.4770 [hep-ex].
[20] CMS Collaboration, Search for supersymmetry in events with one lepton in proton-proton collisions at √s=13 TeV with the CMS experiment, (2016),
url:https://cds.cern.ch/record/2140638.
[21] ATLAS Collaboration, The ATLAS Experiment at the CERN Large Hadron Collider,
JINST 3 (2008) S08003.
[22] ATLAS Collaboration, ATLAS Insertable B-Layer Technical Design Report, ATLAS-TDR-19 (2010), url:http://cds.cern.ch/record/1291633. [23] ATLAS Collaboration, Performance of the ATLAS Trigger System in 2010,
Eur. Phys. J. C 72 (2012) 1849, arXiv:1110.1530 [hep-ex].
[24] J. Alwall et al., Searching for Directly Decaying Gluinos at the Tevatron,
Phys. Lett. B 666 (2008) 34–37, arXiv:0803.0019 [hep-ph]. [25] J. Alwall, P. Schuster and N. Toro,
Simplified Models for a First Characterization of New Physics at the LHC,
Phys. Rev. D 79 (2009) 075020, arXiv:0810.3921 [hep-ph]. [26] D. Alves et al., Simplified Models for LHC New Physics Searches,
J. Phys. G: Nucl. Part. Phys. 39 (2012) 105005, arXiv:1105.2838 [hep-ph].
[27] J. Alwall et al., The automated computation of tree-level and next-to-leading order differential cross sections, and their matching to parton shower simulations,JHEP 07 (2014) 079,
arXiv:1405.0301 [hep-ph].
[28] T. Sjöstrand, S. Mrenna and P. Z. Skands, A Brief Introduction to PYTHIA 8.1,
Comput.Phys.Commun. 178 (2008) 852–867, arXiv:0710.3820 [hep-ph].
[29] L. Lönnblad and S. Prestel, Matching Tree-Level Matrix Elements with Interleaved Showers,
JHEP 03 (2012) 019, arXiv:1109.4829 [hep-ph].
[30] ATLAS Collaboration, ATLAS Pythia 8 tunes to 7 TeV data, ATL-PHYS-PUB-2014-021, 2014,
url:http://cdsweb.cern.ch/record/1966419.
[31] R. D. Ball et al., Parton distributions with LHC data,Nucl. Phys. B 867 (2013) 244–289, arXiv:1207.1303 [hep-ph].
[32] D. J. Lange, The EvtGen particle decay simulation package,
Nucl. Instrum. Meth. A 462 (2001) 152.
[33] W. Beenakker et al., Squark and gluino production at hadron colliders,
Nucl. Phys. B 492 (1997) 51–103, arXiv:hep-ph/9610490 [hep-ph]. [34] A. Kulesza and L. Motyka,
Threshold resummation for squark-antisquark and gluino-pair production at the LHC,
[35] A. Kulesza and L. Motyka, Soft gluon resummation for the production of gluino-gluino and squark-antisquark pairs at the LHC,Phys. Rev. D 80 (2009) 095004,
arXiv:0905.4749 [hep-ph].
[36] W. Beenakker et al., Soft-gluon resummation for squark and gluino hadroproduction,
JHEP 12 (2009) 041, arXiv:0909.4418 [hep-ph]. [37] W. Beenakker et al., Squark and gluino hadroproduction,
Int. J. Mod. Phys. A 26 (2011) 2637–2664, arXiv:1105.1110 [hep-ph].
[38] M. Krämer et al., Supersymmetry production cross sections in pp collisions at √s = 7 TeV, (2012), arXiv:1206.2892 [hep-ph].
[39] C. Borschensky et al.,
Squark and gluino production cross sections in pp collisions at √s = 13, 14, 33 and 100 TeV,
Eur. Phys. J. C 74 (2014) 3174, arXiv:1407.5066 [hep-ph].
[40] T. Gleisberg et al., Event generation with SHERPA 1.1,JHEP 02 (2009) 007, arXiv:0811.4622 [hep-ph].
[41] T. Sjöstrand, S. Mrenna and P. Z. Skands, PYTHIA 6.4 Physics and Manual,JHEP 05 (2006) 026, arXiv:hep-ph/0603175.
[42] P. Z. Skands, Tuning Monte Carlo Generators: The Perugia Tunes,
Phys. Rev. D 82 (2010) 074018, arXiv:1005.3457 [hep-ph]. [43] ATLAS Collaboration,
Simulation of top quark production for the ATLAS experiment at √s = 13 TeV, (2016),
url:http://cds.cern.ch/record/2120417.
[44] S. Alioli et al., A general framework for implementing NLO calculations in shower Monte Carlo programs: the POWHEG BOX,JHEP 06 (2010) 043, arXiv:1002.2581 [hep-ph].
[45] H.-L. Lai et al., New parton distributions for collider physics,Phys. Rev. D 82 (2010) 074024, arXiv:1007.2241 [hep-ph].
[46] P. Artoisenet et al.,
Automatic spin-entangled decays of heavy resonances in Monte Carlo simulations,
JHEP 03 (2013) 015, arXiv:1212.3460 [hep-ph]. [47] J. Pumplin et al.,
New generation of parton distributions with uncertainties from global QCD analysis, JHEP 07 (2002) 012, arXiv:hep-ph/0201195 [hep-ph].
[48] ATLAS Collaboration, Monte Carlo Generators for the Production of a W or Z/γ∗Boson in Association with Jets at ATLAS in Run 2, (2016),
url:http://cds.cern.ch/record/2120133.
[49] T. Gleisberg and S. Höche, Comix, a new matrix element generator,JHEP 12 (2008) 039, arXiv:0808.3674 [hep-ph].
[50] F. Cascioli, P. Maierhofer and S. Pozzorini, Scattering Amplitudes with Open Loops,
Phys. Rev. Lett. 108 (2012) 111601, arXiv:1111.5206 [hep-ph]. [51] S. Schumann and F. Krauss,
A Parton shower algorithm based on Catani-Seymour dipole factorisation,JHEP 03 (2008) 038, arXiv:0709.1027 [hep-ph].