HAL Id: hal-00299022
https://hal.archives-ouvertes.fr/hal-00299022
Submitted on 1 Jan 2003
HAL is a multi-disciplinary open access
archive for the deposit and dissemination of
sci-entific research documents, whether they are
pub-lished or not. The documents may come from
teaching and research institutions in France or
abroad, or from public or private research centers.
L’archive ouverte pluridisciplinaire HAL, est
destinée au dépôt et à la diffusion de documents
scientifiques de niveau recherche, publiés ou non,
émanant des établissements d’enseignement et de
recherche français ou étrangers, des laboratoires
publics ou privés.
Variations of phase velocity and gradient values of ULF
geomagnetic disturbances connected with the Izu strong
earthquakes
V. S. Ismaguilov, Yu. A. Kopytenko, K. Hattori, M. Hayakawa
To cite this version:
V. S. Ismaguilov, Yu. A. Kopytenko, K. Hattori, M. Hayakawa. Variations of phase velocity and
gradient values of ULF geomagnetic disturbances connected with the Izu strong earthquakes. Natural
Hazards and Earth System Science, Copernicus Publications on behalf of the European Geosciences
Union, 2003, 3 (3/4), pp.211-215. �hal-00299022�
Natural Hazards and Earth System Sciences (2003) 3: 211–215 c
European Geosciences Union 2003
Natural Hazards
and Earth
System Sciences
Variations of phase velocity and gradient values of ULF geomagnetic
disturbances connected with the Izu strong earthquakes
V. S. Ismaguilov1, Yu. A. Kopytenko1, K. Hattori2, and M. Hayakawa3
1SPbF IZMIRAN, St.-Petersburg, Russia
2RIKEN IFREQ, MBRC Chiba University, Chiba, Japan 3UEC, Chofu, Japan
Received: 30 May 2002 – Accepted: 19 August 2002
Abstract. Results of study of anomaly behavior of ampli-tudes, phase velocities and gradients of ULF electromag-netic disturbances (F = 0.002 – 0.5 Hz) before and during a seismic active period are presented. Investigations were car-ried out in Japan (Izu and Chiba peninsulas) by two groups of magnetic stations spaced apart at a distance ∼140 km. Every group (magnetic gradientometer) consists of three 3-component high sensitive magnetic stations arranged in a tri-angle and spaced apart at distance 4–7 km. Kakioka mag-netic station (> 200 km to the North from Izu) was used as a reference point. Available data (only night-time intervals 00:00–07:00 LT) were preliminary filtrated by narrow pass-band filters (16 frequency pass-bands – periods T = 2–512 s). The amplitude, gradient and phase velocity values and prob-abilities of directions of gradient and phase velocity vectors were constructed for the every frequency band. Apparent re-sistivities of the Earth’s crust in the every frequency band were calculated using the phase velocity values. It was found that Z component amplitudes of the ULF magnetic distur-bances increased at Izu peninsula 2–4 weeks before the seis-mic active period and 2–4 days before the strongest seisseis-mic shocks (M > 6). Ratio of Z component amplitudes of Kamo (Izu) and Kakioka data (Zk/Zkk)increased during 2–4 weeks
before the seismic activity start (27 June 2000) and reached a maximum just before a moment of the strongest seismic shock (EQ with M = 6.4). The gradient and the phase ve-locity values had an anomaly behavior during the same 2–4 weeks before the start of seismic active period. The gradient vectors of the total horizontal component of the ULF mag-netic pulsations were probably directed to the regions with increased conductivity. New additional direction of the gra-dient vectors appeared 2–3 weeks before the seismic activity start – the direction to the seismic active area which appeared due to a magma rising.
Correspondence to: Yu. A. Kopytenko
1 Introduction
In previous works it was found that two kinds of ULF EM disturbances connected with EQ origin zone: (1) a direct ra-diation from EQ origin zone (Kopytenko et al., 1990, 1993; Fraser-Smith et al., 1990; Bernardy, et al., 1991; Molchanov et al., 1992; Ismaguilov et al., 2001) and (2) a changing of electric conductivity inside and nearby the EQ hearth zone leads to changing of amplitudes of reflected electromagnetic waves generated by outer sources (Mogi, 1985; Kovtun, 1980; Gasanenko, 1963; Ismaguilov et al., 2001; Kopytenko et al., 2002).
In this paper we continue to study an anomaly behavior of amplitudes, gradients and phase velocities of ULF EM dis-turbances before and during a seismic active period. Seismic shocks started 27 June 2000 and lasted more then 4 months. EQ epicenters were situated at a distance ∼70–90 km to the southeast from Izu peninsula (Japan) under a sea bottom. The strongest seismic shock (M = 6.4) was observed 01 July 2000 at 16:01:56 LT.
A method of constructing of the gradient and phase ve-locity vectors along the Earth’s surface using three-point measurements of the ULF magnetic field variations was de-scribed in (Kopytenko et al., 2000; Ismaguilov et al., 2001; Kopytenko et al., 2002). The phase-gradient method gives a possibility to find a direction to the ULF EM ionosphere and lithosphere sources and to determine a position of future seismic activity regions, if the ULF EM disturbances are con-nected with these regions. Three magnetic stations situated one from the other at small distances are the ULF magnetic radar.
2 Experiment
Measurements of ULF EM fields were performed by two groups of magnetic stations spaced ∼140 km apart. The ev-ery group consists of three MVC-2DS high sensitive three-component torsion magnetometers (Goto et al., 2002) with
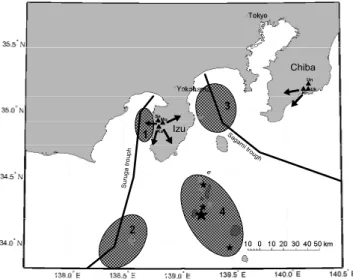
212 V. S. Ismaguilov et al.: Variations of phase velocity and gradient values S urug a tr oup h Sagam i trough Se Ka Mo KiUk Un 1 2 3 4 Chiba Izu
Fig. 1. Positions of geoelectric anomalies around Izu peninsula
(Japan) defined by the phase-gradient method. 1 – “seashore effect” zone; 2, 3 – regions with increased conductivity where EQ had oc-curred in recent years (gray stars – positions of strongest EQ); 4 – seismic activity region (black stars – positions of latest EQ with
M ≥6). Small black triangles – magnetic stations. Black arrows – directions of gradients of ULF magnetic pulsations.
50 Hz sampling (Kamo – 12.5 Hz) arranged in a triangle and spaced ∼4–7 km apart. GPS systems were used at every sta-tion for data synchronizasta-tion. One group of the magnetome-ters was installed at Izu peninsula (Seikoshi, Mochikoshi and Kamo), another one – at Chiba peninsula (Unobe, Kiyosumi and Uchiura). Positions of the magnetic stations and epicen-ters of the seismic shocks with magnitude M ≥ 6 are shown at the Fig. 1. Black stars mark the epicenters. The strongest shock (EQ) had the magnitude M = 6.4. The biggest black star at the Fig. 1 marks this epicenter. The epicenter of this EQ was situated at a depth ∼15 km under a sea surface at a distance ∼80 km to the southeast from the magnetic stations located at Izu peninsula and ∼140 km to the southwest from the magnetic stations located at Chiba peninsula.
3 Data processing and experimental results
Only nighttime intervals 00:00–07:00 LT were used for data processing because of too big man-made EM noise during daytime at Japan territory. Available data were preliminary filtrated by narrow pass-band filters (17 frequency bands – periods 2, 3, 4, 8, 12, 16, 24, 32, 48, 64, 96, 128, 192, 256, 384, 512 s). High frequency of data acquisition and us-ing of GPS receivers on the each of magnetic stations allow building vectors of the gradient and the phase velocity of the ULF geomagnetic disturbances (F = 0.002–1 Hz) along the Earth’s surface. The amplitude, gradient and the phase veloc-ity values and probabilities of directions of gradient and ve-locity vectors were constructed for the every frequency band. For low-frequency waves (w < 1 Hz) the wave equations, obtained from the Maxwell equations, are reduced to the
dif-fusion equations (Semenov, 1968). For a harmonic source (B ∼ e−iwt) the diffusion equations have a partial solution
for the magnetic field variations (Jeffreys and Swirles, 1966) in one-dimensional case (real part):
B = B0e−kxcos(wt − kx). (1)
Here k = 2π/λ = (wµ0/ρa)1/2, t – time, B0 – initial
amplitude, ρa – apparent resistivity. Let’s remark, that in
the low frequency limit the wave equation with a big accu-racy has the same partial solution for the plane waves (Se-menov, 1968). Therefore k has a wave vector sense, and λ is a wavelength. At the diffusion approach we can speak about a moving non-uniformity of induction currents having a wave character.
The phase velocity along the Earth’s surface of the pri-mary EM wave falling down from the atmosphere is ≥ c (the light velocity) and a phase delay between two points at the Earth’s surface is very close to 0. Therefore the phase delays of the EM waves observed at the Earth’s surface are com-pletely determined by the secondary EM waves reflected or generated by the lithosphere sources (geoelectric anomalies of conductivity situated in the Earth’s crust or sources con-nected with the EQ preparation region) and propagated in the Earth’s crust. From (1) it is possible to determine a velocity of moving plane of a constant phase (the phase velocity Vph)
and the apparent resistivity ρaof the Earth media (integrated
value along the EM wave track):
Vph=w/k = (2ρaw/µ0)1/2=(107ρa/T )1/2
ρa =10−7V2phT . (2)
Here T = 1/f = 2π/w – period of oscillations, µ0 =
4π · 10−7N/A2 – absolute magnetic constant (we suppose
that relative magnetic constant µ = 1 in the Earth’s crust). Therefore, if the phase velocity of the wave propagation in the Earth’s crust is known, we can find the apparent resistiv-ity of the Earth’s crust along the way of the EM wave from a lithosphere source to the Earth’s surface. We apply a statisti-cal study and use mean values of the phase velocities statisti- calcu-lated for some time interval.
An example of a time evolution of various parameters of the geomagnetic pulsations with period T = 24 s before and during of the seismic active period is shown in Fig. 2. Only nighttime intervals 00:00–07:00 LT were used for data processing. Points at the figure (panels b–h) are mean val-ues calculated for these time intervals. To delete occasional jumps in the results three-point running means were used for curves represented in the Fig. 2. Vertical dotted lines at the Fig. 2 mark the start of the seismic activity (27 June 2000) and moments of the seismic shocks with magnitudes M > 6. Magnitudes of the seismic shocks (vertical lines) are shown according to JMA classification at the panel a. The strongest EQs happened on 2 July 2000 (M = 6.4), 09.07 (M = 6.1) and on 15 July 2000 (M = 6.3).
Time evolutions of ratios of mean-square amplitudes of the vertical (Z) and the total horizontal (G) component of Kamo (k) and Kakioka (kk) data (T = 24 s) are plotted at
V. S. Ismaguilov et al.: Variations of phase velocity and gradient values 213
1-Apr 11-Apr 21-Apr 1-May 11-May21-May31-May 10-Jun 20-Jun 30-Jun 10-Jul 20-Jul 30-Jul
0 400 800 R o (ohm *m ) 0.00 0.04 0.08 RMS Z ( n T) 0.0 0.1 0.2 0.3 RMS G (n T) 0 2 4 Z/ G 0 2 4 6 Gr ad ie nt (p T /k m ) 0 5 10 15 V (k m/ s) 6.4 6.1 6.3 K KK KK K KK 0 1 2 Bk /B kk 2 4 6 8 Magn itu d e Zk/Zkk Gk/Gkk a b c d e f g h K Vz Vg Gz Gg Rz Rg M=
Fig. 2. Variations of parameters of geomagnetic pulsations (T =
24 s) during period 1 April – 25 July 2000 (nighttime intervals 00:00–07:00 LT). Kakioka, Kamo, Seikoshi and Mochikoshi mag-netic stations (Japan). (a) magnitudes of seismic shocks (vertical lines) according to JMA classification; (b) ratios of mean-square amplitudes of the vertical (Z) and the total horizontal (G) compo-nent of Kamo (K) and Kakioka (KK) data; (c) the phase velocities calculated at Izu peninsula for the vertical (solid line) and the to-tal horizonto-tal (dotted line) component; (d) the gradients calculated at Izu peninsula for the vertical (solid line) and the total horizontal (dotted line) component; (e) Z/G ratios for Kamo (K) and Kakioka (KK) data; (f) RMS values of amplitudes of the total horizontal component for Kamo (K) and Kakioka (KK) data; (g) RMS values of amplitudes of the vertical component for Kamo (K) and Kakioka (KK) data; (h) the apparent resistivities calculated at Izu peninsula from the phase velocity values for the vertical (dotted line) and the total horizontal (solid line) components. All curves are 3-points running means.
the panel (b) of the Fig. 2. It is clearly seen that the ra-tio of Z magnetic component amplitudes of Kamo (Izu) and Kakioka data (Zk/Zkk) increased during 2–3 weeks before
the seismic activity start (26 June 2000) and reached sec-ond maximum 28–30 June 2000 just before the moment of the strongest seismic shock (M = 6.4). It means that the ULF pulsation amplitudes of Z component were anomaly increased at Kamo magnetic station relatively Kakioka. This effect is more clearly seen for the longest ULF pulsation peri-ods 96–512 s (not presented in this paper), moreover the
sec-30 %
S W N E S S W N E S
-180 -90 0 90 180
Gradient derection (deg) -180 -90Phase velocity direction (deg)0 90 180
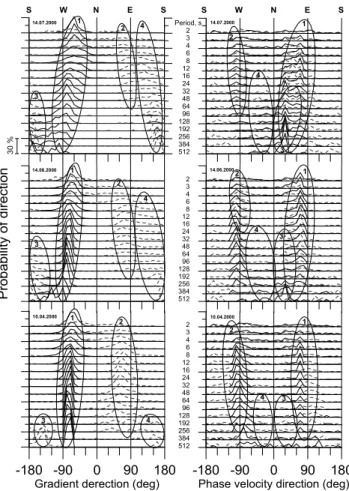
Pr ob ab ility o f di re cti on 2 3 4 6 8 12 16 24 32 48 64 96 128 192 256 384 512 2 3 4 6 8 12 16 24 32 48 64 96 128 192 256 384 512 14.07.2000 14.07.2000 14.06.2000 14.06.2000 10.04.2000 10.04.2000 1 4 3 1 4 3 4 4 2 2 2 2 1 2 3 1 3 2 3 4 1 3 4 1 Period, s 2 3 4 6 8 12 16 24 32 48 64 96 128 192 256 384 512
Fig. 3. Statistical distributions of gradient (left side) and phase
ve-locity (right side) vector directions of total horizontal component of ULF geomagnetic disturbances 01.05 (dotted curves), 08.06 (thick solid curves), and 10 July 2000 (thin solid curves) in period range 2–512 s. Izu peninsula, Japan. 1–4 – directions to the anomaly re-gions plotted in Fig. 1. Directions: 0◦– to the North, 90◦– to the East, −90◦– to the West, 180◦and −180◦– to the South.
ond maximum value exceeds a background level (defined by
Zk/Zkkvalues of 01.04 and 1 May 2000) in 2–3 times. There
is no noticeable effect in the total horizontal component ra-tio Gk/Gkk. Some increasing of this ratio about 15–16 June
2000 is probably connected with the very strong magnetic storm.
Values of the phase velocities calculated at Izu peninsula using all three magnetic station data for the vertical (dotted line) and the total horizontal (solid line) component are pre-sented at the panel c of the Fig. 2. The phase velocity and gradient vectors were calculated in according to (Kopytenko et al., 2000; Ismaguilov et al., 2001; Kopytenko et al., 2002) only for events when a coefficient of correlation between data of every couple of Izu magnetic stations exceeds a value 0.9. We see from the Fig. 2 that the phase velocity of magnetic pulsations in Z component slightly increased 2–4 weeks be-fore the beginning of the seismic active period and then it de-creased. We can observe minima of the phase velocity before the seismic activity start and before the every strong EQ. The phase velocity of the magnetic pulsations in the total
hori-214 V. S. Ismaguilov et al.: Variations of phase velocity and gradient values zontal component increased about two weeks before the start
of the seismic shocks. It had similar time evolution as the phase velocity obtained for the vertical component.
The gradient values of ULF geomagnetic pulsations calcu-lated at Izu peninsula for the vertical (dotted line) and the to-tal horizonto-tal (solid line) component are plotted at the panel (d). Both curves have a similar time evolution. Increasing of the gradients was observed 2–3 weeks before the seismic shocks start. Second maximum occurred 4–5 days before the strongest EQ. A sharp increasing about 15 July 2000 was probably connected with the strong magnetic storm. Statis-tical distributions of the gradient vector directions are repre-sented in Fig. 3.
The traditional Z/G ratios for Kamo (K) and Kakioka (KK) data submitted in the panel (e). There are some features connected with the seismic activity in 24 s geomagnetic pul-sations. For the lower frequency band (T ∼ 100 s) distinct increasing of Z/G ratios 2–4 weeks before the seismic activ-ity start were observed for this seismic event (Ismaguilov et al., 2001; Kopytenko et al., 2002) and also for another seis-mic events (Hayakawa et al., 1996a, b; Hattori et al., 2002). A sharp decreasing of Z/G ratios about 15 July 2000 is prob-ably connected with the strong magnetic storm.
Time evolution of RMS values of amplitudes of the total horizontal component for Kamo (K) and Kakioka (KK) data and for the vertical component for Kamo (K) and Kakioka (KK) data are represented at the panel (f) and (g). A sharp distinction is seen in variations of Z component of Kamo and Kakioka. We observe again the maximums 2–4 weeks before the start of the seismic active period and 2–4 days before the strongest EQ. A big increasing about 15 July 2000 was probably connected with the big magnetic storm.
The apparent resistivities calculated at Izu peninsula ac-cording to Eq. (2) from the phase velocity values of the verti-cal (Vz, solid line) and the total horizontal (Vg, dotted line)
components are shown at the panel (h) of the Fig. 2. The ap-parent resistivity values calculated from Vzvalues increased
3–4 weeks before the seismic activity start then they con-stantly decreased. 2–4 days before the every strong seismic shock we observe minimums of the apparent resistivity val-ues. The apparent resistivities values calculated using Vg
values had the same wavy character as the apparent resistiv-ities calculated from Vz values. The sharp increasing
ob-served about 15 July 2000 was probably connected with the big magnetic storm.
4 Discussion and summary
In this work we demonstrate that many parameters of the ULF geomagnetic pulsations (amplitudes, gradients and phase velocities along the Earth’ surface) have an anomaly behavior 2–4 weeks before the beginning of the seismic activity and 2–4 days before the strongest seismic shocks. Comparison of the Kamo and Kakioka data (Fig. 2) shows that the magnetic devices installed at distance ∼80 km from the future seismic active area can record ULF magnetic
dis-turbances really connected with the seismic preparation re-gion.
Estimations of the apparent resistivity values calculated from the phase velocity values differ from the estimations calculated from the impedance values. Magneto telluric sounding method (MTS) uses the values of electric and mag-netic horizontal components of the ULF EM pulsations and gives the apparent resistivities integrated in the Earth’s me-dia under a point of observation. The phase-gradient method gives the apparent resistivities integrated along the way of the EM waves propagated from the secondary sources situated in the Earth’s crust. The new source can arise in the Earth’s crust due to active tectonic movements or a magma rising (Uyeda et al., 2002). During these processes a temperature and conductivity of some region in the Earth’s crust around the future EQ origin zone will increase (Bullard, 1967) and conditions for reflecting of the EM waves penetrating in the Earth’s crust from the atmosphere will improve.
Two circumstances lead to a big changing of the apparent resistivity calculated from the phase velocity values. On the one hand we can receive the changing of the apparent resis-tivity because new ways of the EM wave propagation throw the Earth’s crust arise. The new ways are in the Earth’s crust with the resistivity that differs from the resistivity of the old ways. On the second hand the value of the phase velocity of the geomagnetic oscillations measured along the Earth’s sur-face (we use in Eq. (2) just these values) is connected with the value of the phase velocity in the Earth’s crust by a formula
Vsurface = VEarth/sin(α), where α – angle of the wave
ar-rival to the surface from the lithosphere source counted from a vertical. The new EM wave tracks lead to changing of the angle α and accordingly to changing of the phase veloc-ity and the apparent resistivveloc-ity calculated using this method. Therefore the phase-gradient method gives an opportunity to determine a moment of arising or changing of the ULF EM lithosphere source in a local anomaly zone.
In Fig. 3 statistical distributions of the gradient (left side) and the phase velocity (right side) directions presented for three days: 10.04 (bottom curves), 14.06 (middle curves), and 14 July 2000 (upper curves) in the pulsation period range 2–512 s. The gradient vectors were calculated using RMS values and they are always directed to the sources. Ovals 1– 4 in Fig. 3 mark the directions to the regions with geoelectric anomalies marked in Fig. 1 by the same symbols 1–4. It is seen from the figure that 10 April 2000 (∼10 weeks before the seismic activity start) and 14 July 2000 (during the seis-mic activity) new directions of the gradient vectors arise – the direction to the seismic active region where the anomaly occurs. The anomaly of the conductivity appeared due to the magma rising (Uyeda et al., 2002). The resistivity of the hot magma is ∼500 Ohm.m, but the granite electrical resistivity, for instance, exceed 1000 Ohm.m.
The phase-gradient method described in (Kopytenko et al., 2000, 2002; Ismaguilov et al., 2001) is very sensitive to the changing of properties of the lithosphere ULF sources. Acknowledgement. This work was partly supported by Grant
IN-V. S. Ismaguilov et al.: Variations of phase velocity and gradient values 215 TAS 99-1102.
References
Bullard, E. C.: Electromagnetic induction in the Earth, Q. J. Roy. Astron. Soc., 8, 143–160, 1967.
Bernardy, A., Fraser-Smith, A. C., McGill, P. R., and Villard, Jr., O. G.: ULF magnetic field measurements near the epicenter of the MS = 7.1 Loma Prieta earthquake, Phys. Earth. Planet. In-ter., 68, 45–64, 1991.
Fraser-Smith, A. C., Bernardy, A., McGill P. R., Ladd, M. E., Helli-well, R. A., and Villard, Jr., O. G.: Low frequency magnetic field measurements near the epicenter of the Loma-Prieta earthquake, Geophys. Res. Lett., 17, 1465–1468, 1990.
Gasanenko, L. B.: Impedance of ULF direct line current field situ-ated above Earth, in: Electromagnetic sounding and magnetotel-luric methods of exploring, St.-Petersburg, Leningrad University, (in Russian), 47–58, 1963.
Goto, T.-N., Sayanagi, K., and Mikada, H.: Calibration and run-ning test of torsion magnetometer made in Russia, Rep. Of Japan Marin Sci. and Tech. Center (JAMSTEC), 45, 41–53, 2002. Hattori, K., Akinaga, Y., Hayakawa, M., Nagao, T., and Uyeda, S.:
ULF magnetic anomaly preciding the 1997 Kagoshima earth-quakes, in: Seismo Electromagnetics: Litosphere-Atmosphere-Ionosphere Coupling, (Eds) Hayakawa, M. and Molchanov, O. A., TERRAPUB, Tokyo, 19–28, 2002.
Hayakawa, M., Kawate, R., Molchanov, O. A., and Yumoto, K.: Re-sults of Ultra-low-frequency magnetic field measurements dur-ing the Guam earthquake of 8 August 1993, Geophys. Res. Lett., N23, 241–244, 1996a.
Hayakawa, M., Kawate, R., and Molchanov, O. A.: Ultra-low-frequency Signatures of the Guam Earthquake on 8 August 1993 and their Implication, J. Atm. Electr., 16, 3, 193–198, 1996b. Ismaguilov, V. S., Kopytenko, Yu. A., Hattori, K., Voronov, P. M.,
Molchanov, O. A., and Hayakawa, M.: ULF magnetic emissions connected with under sea bottom earthquakes, Nat. Hazards and Earth Sys. Sci., 1, 23–31, 2001.
Jeffreys, H. and Swirles, B.: Methods of mathematical physics, Third Edition, Cambridge Univ. Press, Cambridge, 157, 1966. Kopytenko, Yu. A., Matiashvily, T. G., Voronov, P. M.,
Kopy-tenko, E. A., and Molchanov, O. A.: Discovering of ultra-low-frequency emissions connected with Spitak earthquake and his aftershock activity on data of geomagnetic pulsations observa-tions at Dusheti and Vardzija, Moscow, IZMIRAN, Preprint N3 (888), 27, 1990.
Kopytenko, Yu. A., Matiashvili, T. G., Voronov, P. M., Kopytenko, E. A., and Molchanov, O. A.: Detection of Ultra-Low Frequency emissions connected with the Spitak Earthquake and its after-shock activity, based on geomagnetic pulsations data at Dusheti and Vardzia observatories, Phys. Earth and Planet. Inter., 77, 85– 95, 1993.
Kopytenko, Yu. A., Ismaguilov, V. S., Kopytenko, E. A., Voronov, P. M., and Zaitsev, D. B.: Magnetic location of geomagnetic dis-turbance sources, DAN, series “Geophysics”, 371, 5, 685–687, 2000.
Kopytenko, Yu. A., Ismaguilov, V. S., Hattori, K., Voronov, P. M., Hayakawa, M., Molchanov, O. A., Kopytenko, E. A., and Za-itsev, D. B.: Monitoring of the ULF electromagnetic distur-bances at the station network before EQ in seismic zones of Izu and Chiba peninsulas, in: Seismo Electromagnetics: Litosphere-Atmosphere-Ionosphere Coupling, (Eds) Hayakawa, M. and Molchanov, O. A., TERRAPUB, Tokyo, 11–18, 2002.
Kovtun, A. A.: Using of natural electromagnetic field of the Earth under studying of Earth’s electroconductivity. St.-Petersburg, Leningrad University, (in Russian), 195, 1980.
Mogi, K.: Earthquake prediction., Academic Press, Tokyo, 382, 1985.
Molchanov, O. A., Kopytenko, Yu. A., Voronov, P. M., Kopytenko, E. A., Matiashvili, T. G., Fraser-Smith, A. C., and Bernardy, A.: Results of ULF magnetic field measurements near the epicenters of the Spitak (MS=6.9) and the Loma-Prieta (MS=7.1)
earth-uakes: Comparative analysis, Geophys. Res. Lett., 19, 1495– 1498, 1992.
Semenov, A. A.: Theory of electromagnetic waves, Moscow Univ. Press, Moscow, (in Russian), 316, 1968.
Uyeda, S., Hayakawa, M., Nagao, T., Molchanov, O., Hattori, K., Orihara, Y., Gotoh, K., Akinaga, Y., and Tanaka, H.: Electric and magnetic phenomena observed before the volcano-seismic activity in 2000 in the Izu Island Region, Japan, Proc. of US Nat. Acad. of Sci., 99, 11, 7352–7355, 2002.