HAL Id: hal-00317866
https://hal.archives-ouvertes.fr/hal-00317866
Submitted on 13 Oct 2005
HAL is a multi-disciplinary open access
archive for the deposit and dissemination of
sci-entific research documents, whether they are
pub-lished or not. The documents may come from
teaching and research institutions in France or
abroad, or from public or private research centers.
L’archive ouverte pluridisciplinaire HAL, est
destinée au dépôt et à la diffusion de documents
scientifiques de niveau recherche, publiés ou non,
émanant des établissements d’enseignement et de
recherche français ou étrangers, des laboratoires
publics ou privés.
in the SEEK-2 campaign
S. Saito, M. Yamamoto, S. Fukao, M. Marumoto, R. T. Tsunoda
To cite this version:
S. Saito, M. Yamamoto, S. Fukao, M. Marumoto, R. T. Tsunoda. Radar observations of field-aligned
plasma irregularities in the SEEK-2 campaign. Annales Geophysicae, European Geosciences Union,
2005, 23 (7), pp.2307-2318. �hal-00317866�
SRef-ID: 1432-0576/ag/2005-23-2307 © European Geosciences Union 2005
Annales
Geophysicae
Radar observations of field-aligned plasma irregularities in the
SEEK-2 campaign
S. Saito1, M. Yamamoto2, S. Fukao2, M. Marumoto2, and R. T. Tsunoda3
1National Institute of Information and Communication Technology, Nukui-Kita 4-2-1, Koganei, Tokyo 184-8795, Japan
2Research Institute of Sustainable Humanosphere, Kyoto University, Gokasho, Uji, Kyoto 611-0011, Japan
3SRI International, Menlo Park, California, USA
Received: 18 January 2005 – Revised: 12 May 2005 – Accepted: 18 May 2005 – Published: 13 October 2005 Part of Special Issue “SEEK-2 (Sporadic-E Experiment over Kyushu 2)”
Abstract. During the Sporadic E Experiment over Kyushu 2 (SEEK-2) campaign, field-aligned irregularities (FAIs) asso-ciated with midlatitude sporadic-E (Es) layers were observed with two backscatter radars, the Lower Thermosphere Pro-filer Radar (LTPR) and the Frequency Agile Radar (FAR), which were located 40 km apart in Tanegashima, Japan. We conducted observations of FAI echoes from 31 July to 24 Au-gust 2002, and the radar data were used to determine launch timing of two sounding rockets on 3 August 2002. Our com-parison of echoes obtained by the LTPR and the FAR re-vealed that echoes often appeared at the FAR about 10 min earlier than they did at the LTPR and were well correlated. This indicates that echoing regions drift with a southward velocity component that maintains the spatial shape. Inter-ferometry observations that were conducted with the LTPR from 3 to 8 August 2002, revealed that the quasi-periodic (QP) striations in the Range-Time-Intensity (RTI) plots were due to the apparent motion of echoing regions across the radar beam including both main and side lobes. In most cases, the echo moved to the east-southeast at an almost con-stant altitude of 100–110 km, which was along the locus of perpendicularity of the radar line-of-sight to the geomagnetic field line. We found that the QP pattern on the RTI plot
re-flects the horizontal structure and motion of the Es layer,
and that echoing regions seemed to be in one-dimensionally elongated shapes or in chains of patches. Neutral wind ve-locities from 75 to 105 km altitude were simultaneously de-rived with meteor echoes from the LTPR. This is the first time-continuous simultaneous observation FAIs and neutral wind with interferometry measurements. Assuming that the echoing regions were drifting with an ambient neutral wind, we found that the echoing region was aligned east-northeast– west-southwest in eight out of ten QP echo events during the SEEK-2 campaign. A range rate was negative (positive),
Correspondence to: S. Saito
when a frontal structure of echoing regions elongated east-northeast−west-southwest drifts with southward (northward) neutral wind.
Keywords. Ionosphere-atmosphere interactions;
Iono-spheric irregularities; Plasma waves and instabilities
1 Introduction
There is a general introduction to this Sporadic E Experi-ment over Kyushu 2 (SEEK-2) campaign by Yamamoto et al. (2005). The primary purpose of the radar experiment was to monitor field-aligned irregularities (FAIs) in the ionospheric
E-region around rocket flight paths and determine launch
timing. The results obtained by radar observations were im-mediately transferred to the control room of the launch site via a network. We added interferometer capabilities to one of our radars to image the fine structures of FAIs and to de-rive neutral wind velocities by using meteor echoes. This is the first attempt to observe FAIs and neutral wind velocity simultaneously with interferometry measurements.
Quasi-periodic (QP) echoes are characterized by stria-tions in the Range-Time-Intensity (RTI) plots and the quasi-periodic variation of echo intensity in time with 5–10 min. Since QP echoes were found by Yamamoto et al. (1991) using the Middle and Upper Atmosphere (MU) radar, sev-eral theories have been proposed to explain the mechanism behind them. Woodman et al. (1991) pointed out that
at-mospheric gravity waves could modulate Es layers to keep
the plasma unstable and could explain the quasi-periodicity.
Tsunoda et al. (1994) proposed a model that Eslayers deeply
modulated in altitude by atmospheric gravity waves could explain both the striation in the RTI plots and the
quasi-periodicity. Modulation of Es layers in altitude extent of a
few kilometers were observed by Miller and Smith (1978)
Table 1. Specifications for the FAR and the LTPR
FAR LTPR
Center Frequency 24.515 MHz 31.57 MHz
Peak Power 4 kW 20 kW
Antennae 4-element Yagi ×8 4-element Yagi ×9
Pulse code 13-bit Barker 16-bit complementary
Number of Receiver Channels 1 6
Beam width (−3dB, one way) 6◦ 10◦
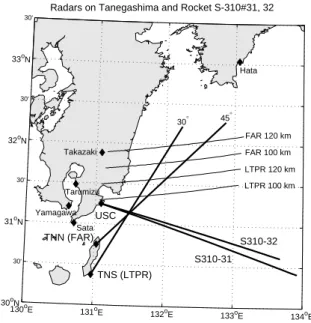
Radars on Tanegashima and Rocket S-310#31, 32
130o E 131o E 132o E 133oE 134oE 30oN 30' 31o N 30' 32o N 30' 33oN 30' TNS (LTPR) TNN (FAR) USC Yamagawa Tarumizu Takazaki Hata Sata 30° 45° S310-31 S310-32 LTPR 100 km LTPR 120 km FAR 100 km FAR 120 km
Fig. 1. Arrangement of radar sites, launch site, area observed by radars and rockets. TNS, TNN, and USC stand for Tanegashima South site, Tanegashima North site, and Uchinoura Space Center, respectively.
deeply-modulated Es layers were not found through in-situ
observations during the previous SEEK campaign (Fukao et al., 1998). Using an ionosonde, Ogawa et al. (2002) found
that Es layers, where the MU radar detects QP echoes, were
not largely distorted in altitude.
Maruyama et al. (2000) proposed that inhomogeneous Es
layers and external electric field can generate polarization electric fields, which can invoke image striations of irregular-ities along the geomagnetic field line, and these may invoke gradient-drift plasma instability. Relative motion of unsta-ble regions along the geomagnetic field line to an observer could result in characteristic striations in RTI plots. Results obtained through computer simulations that support this the-ory including the effects of neutral wind were recently pub-lished by Yokoyama et al. (2003a,b). Larsen (2000)
associ-ated the QP echoes with patchy structure in Es layers and
pointed out that neutral wind shear instabilities and the as-sociated Kelvin-Helmholtz structure could play an important role in seeding the gradient-drift instability resulting in radar
backscatter. Hysell and Burcham (2000) proposed a model where irregularities in randomly distributed unstable plasma
patches or blobs in Es layers could produce QP structures
due to the effect of refracted radar waves and finite aspect angle sensitivity of irregularities. Wang and Chu (2001) also made observations that supported this model using Chung-Li VHF radar. Although there have been many discussions on the generation mechanism of QP echoes, it has not yet been satisfactorily explained.
Using the MU radar and an ionosonde, Ogawa et al. (2002) found that FAI echoes could be observed when foEs−fbEs
exceeded 1 MHz, where foEs and fbEs were the maximum
reflected and the minimum transparent frequencies in the Es
layer, respectively. Since foEs and fbEs correspond to the
highest and lowest plasma density in the Es layer,
respec-tively, they pointed out that the localized plasma density
gra-dient within the Es layer play an important role, which is
consistent both with suggestions of both Maruyama et al. (2000) and Hysell and Burcham (2000). Hysell et al. (2002) found that it was necessary to take into account what effect the refraction of radar waves by dense plasma clouds had in order to explain how QP striations were produced. They also pointed out that echoes resulted from wide azimuth angles to explain very long striations up to 60 km in range extent.
Cosgrove and Tsunoda (2002) proposed Es-layer
instabil-ity, which is at its strongest when the phase front of Eslayer distortion is northwest-southeast (see also Tsunoda et al., 2004). Bernhardt (2002) showed that KelvHelmholtz
in-stability in the neutral atmosphere could modulate Es layers
into a quasi-periodic structure. Neutral winds have been as-sumed to be not only a source of polarization electric field but also a source of the quasi-periodic nature of QP echoes. We used two ionospheric backscatter radars for this study; the first was capable of an interferometry experiment enabling us to investigate the spatial structure of QP echoes. By ob-serving meteor echoes with QP echoes, neutral wind velocity
around the Eslayers were derived simultaneously.
2 Observation setup
We installed two ionospheric radars on Tanegashima Island, which is located to the south of the Uchinoura Space Center (USC) as shown in Fig. 1. The first was a Lower Thermo-sphere Profiler Radar (LTPR) operating at 31.57 MHz, and
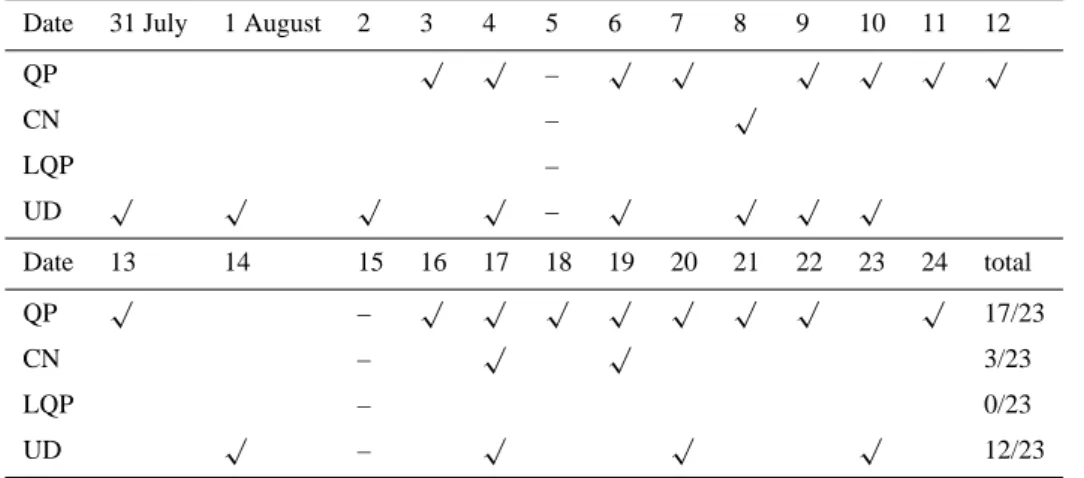
Table 2. Occurrence of FAI echoes for the LTPR. QP, CN, LQP, and UD stand for QP-type, Continuous-type, Low-altitude QP, and Undefined
(structured but not quasi-periodic), respectively. “√” means that the particular type of echoes were observed on the particular day. No data were available on 5 August and 15 due to system trouble.
Date 31 July 1 August 2 3 4 5 6 7 8 9 10 11 12
QP √ √ – √ √ √ √ √ √ CN – √ LQP – UD √ √ √ √ – √ √ √ √ Date 13 14 15 16 17 18 19 20 21 22 23 24 total QP √ – √ √ √ √ √ √ √ √ 17/23 CN – √ √ 3/23 LQP – 0/23 UD √ – √ √ √ 12/23
the second was a Frequency Agile Radar (FAR) operating at 24.515 MHz. The specifications for the two radars are listed in Table 1.
The LTPR was installed in Tanegashima Space Center (TNSC), the Japan Aerospace Exploration Agency (JAXA)
(130.96◦E, 30.38◦N), which we call “Tanegashima South
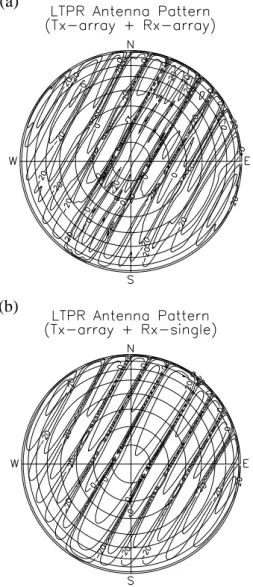
site (TNS)”. The LTPR has six receiver channels that en-able interferometer observations. We arranged its antennae so that both radar imaging and meteor echo measurement were possible. The antenna array consisted of nine Yagi an-tennae in a linear and a triangular arrays as shown in Fig. 2. The transmitting antennae are in the linear array pointed to
30◦to the east from geographic north. The declination
an-gle of the geomagnetic field around the observation region is about −5◦. Six antennae, 1, 2, 5, 7, 8, and 9, formed the receiving array. The triangular array (antennae 1, 2, and 9) was used as a simple interferometer to determine the arrival angles for both the FAI echoes and meteor echoes. Aliasing in space is inevitable, as the shortest distance between an-tennae is 9.5 m (∼1 wavelength). The antenna patterns for the LTPR are plotted in Fig. 3. Figure 3 (a) is the two-way antenna pattern where the six receiving antennae are consid-ered. Figure 3 (b) is the two-way pattern where a single an-tenna is used for receiving. This pattern should apply for interferometry measurements where each antenna is used in-dependently. The LTPR provided information on the occur-rence of FAIs which was the most important condition for the rocket launches. Interferometry observations are supposed to provide detailed spatial structures of FAIs.
The FAR was installed in the Tanegashima Meadow of
Nishinoomote City (131.03◦E, 30.75◦N), which we call
“Tanegashima North site (TNN)”. The system had only
one receiving channel and its main transmitting beam was pointed to 45◦to the east from the geographic north. The ob-jective of this radar was to determine large scale distribution of FAIs through the LTPR observation as well as to monitor
Tx only λ 1 Tx and Rx λ 11 9 4 λ 1
N
Rx only 30o λ λ 3 4 8 9 7 2 1 5 6Fig. 2. Antenna layout for the LTPR. T x array consists of antennae
1–6, while Rx array consists of antennae 1, 2, 5, 7, 8, and 9.
FAI occurrences as a back-up to the LTPR.
The observation areas of the LTPR and the FAR are de-picted in Fig. 1. Due to high aspect angle sensitivity to the geomagnetic field line, radar echoes were mainly expected between two loci of perpendicularity at altitudes of 100 and 120 km for each radar. Because of the coherent nature of FAI echoes, echoes may have been detected not only in the radar main lobe but also in the side lobes. We can see that the area observed by these two radars was relatively narrow to the north-south direction and wide to the east-west. It should be noted that the radars did not observe the ionosphere along rocket trajectories, but observed just north of them.
Both radars were operated from 31 July to 24 August 2002. Due to limitations with data storage and trouble with the system, satisfactory interferometry data from the LTPR was only available from 3 to 8 August.
(b)
(a)
(b)
(a)
Fig. 3. Two-way antenna patterns for the LTPR, (a) where the Rx
array is used for receiving, (b) where a single antenna is used for receiving. Concentric circles indicate zenith angles with a 10 deg interval.
3 FAI echoes observed by LTPR and FAR
Occurrence of FAI echoes which are categorized in several types observed by the LTPR are summarized in Table 2. QP echoes were observed in 17 nights of 23. Continuous-type echoes were also observed in 3 nights. Low-altitude QP (LQP) echoes were not observed throughout the campaign. There were a lot of echoes with some structures which were not quasi-periodic and categorized in U.D. (Undefined) type. The echo power measured with the two radars around the rocket launches are in Range-Time-Intensity (RTI) format in Fig. 4. For the LTPR, echo power received by the Rx ar-ray were plotted. The “apparent altitudes” are shown by the right vertical axes of the RTI plots in Fig. 4 as well as the ranges by the left vertical axes. They are calculated from the ranges which are directly measured and the condition of perpendicularity of the radar k-vector and geomagnetic field
FAR3 Tanegashima North, 03 August 2002 Signal-to-Noise Ratio 22:30 23:00 23:30 00:00 00:30 JST 100 150 200 250 Range (km) 60 80 100 120 140 Apparent Altitude (km) SNR (dB) -5.0 1.2 7.5 13.8 20.0
LTPR Tanegashima South, 03 August 2002 Signal-to-Noise Ratio 22:30 23:00 23:30 00:00 00:30 JST 100 150 200 Range (km) 60 80 100 120 140 Apparent Altitude (km) SNR (dB) -10.0 0.0 10.0 20.0 30.0
(a)
(b)
Fig. 4. Range-Time-Intensity plots of echo power observed by (a)
LTPR and (b) FAR from 2230 JST 3 August to 0030 JST 4 Au-gust 2002. The left vertical axes show the ranges of echoes, while the right axes show the “apparent altitudes” which are calculated from the range and the perpendicularity condition assuming that the azimuth of echoes are at the center of the radar beam (+30◦).
in the radar main beam direction. Therefore, the “apparent altitudes” may be different from the “true altitudes”. The “true altitude” can be determined by interferometry. The first rocket (S310-31) was launched at 2324 JST (=UT+9 h) and the second (S310–32) at 2339 JST. Both the radars observed typical QP echoes for about an hour. The FAR observed echoes from 2245 to 0010 JST, and the LTPR from 2300 to 0030 JST. Both sequences of QP striations looked similar, while there seemed to be some time delay from the FAR to the LTPR. To determine how they were similar and how long the delay was, we calculated the cross-correlations of tem-poral variations for echo power observed with the FAR and the LTPR at the range of each radar where the average echo power was strongest. We applied a low-pass filter with a cut-off period of 5 min to the temporal variations for echo power. A maximum correlation of 0.73 was obtained at a −19.5 min lag (negative lag means that the FAR observed echoes prior
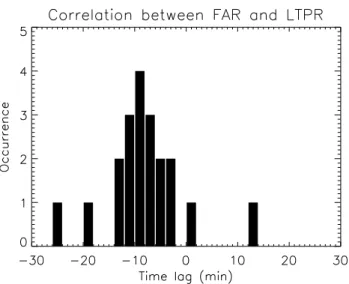
Fig. 5. Distribution of lag time between echoes observed by the LTPR and the FAR. Positive lag means that the LTPR detects echoes prior to the FAR.
to the LTPR). This indicates that there are large-scale struc-tures propagating from the FAR’s observation region to the LTPR’s, which are horizontally separated by about 80 km. It should be noted that this velocity is apparent phase velocity, since the direction of propagation was not known. We did the same analysis for 20 events where the LTPR and the FAR observed FAI echoes simultaneously during the whole obser-vation period. Figure 5 plots the distribution of lag between the LTPR and the FAR. In most of events, the FAR observed echoes prior to the LTPR by about 10 min. This means that FAI echoing regions propagate to a certain preferential direc-tion. However, the precise propagation directions and veloc-ities cannot be determined with this analysis.
4 Interferometry observation of FAIs
We used the triangle array (antennae 1, 2, and 9 in Fig. 2) for the LTPR for interferometry data analysis in this paper. Since the shortest baseline was longer than half the wave-length (about one wavewave-length), multiple solutions for the ar-rival angle of an echo could be obtained. However, we could find a unique solution by limiting the range of the solution so that it was close to the directions in which the radar lines-of-sight were perpendicular to the geomagnetic field lines at E-region altitudes. We set conditions of −45◦<Azimuth <90◦ and 0◦<Elevation <55◦for our analysis. Echoes where the arrival angle could not be uniquely determined even under these conditions were discarded. Because the baseline length was not too long, the arrival angles for most FAI echoes were obtained without ambiguity with this method.
Figure 6 (a) plots the distribution of FAI echoes across the sky. FAI echoes were distributed around the locus of per-pendicularity, but widely distributed in the azimuth not only in the radar’s main lobe but also in the side lobes. This fig-ure also tells us that echoes at longer ranges, which are
of-(b)
(a)
(b) (a)
Fig. 6. (a) Distributions of arrival angles for FAI echoes from
2300 to 2400 JST 3 August 2002. Thick red line indicates di-rections in which line of sight is perpendicular to geomagnetic field line at 100 km altitude. Colors indicate the ranges of echoes. (Black: Range ≤155 km, Red: 155< Range ≤185 km, Blue: Range
>185 km). Beam pattern of the LTPR (two-way) has also been plot-ted. (b) Distribution of echo power measured by the receiving array over azimuth angle for the echoes plotted in (a). Range correction with respect to the reference range of 80 km has been done. Colors indicate the ranges of echoes in the same way as in (a). Dashed line shows the shape of the “two-way” antenna pattern in logarithmic scale along the locus of perpendicularity at 100 km altitude.
ten interpreted as echoes from a higher altitude arrive from the eastern side lobes where elevation angles are low to sat-isfy geomagnetic perpendicularity conditions. In the same way, echoes at shorter ranges arrive from the western side lobes where elevation angles are high. It can be observed from Fig. 4 (a) that the echo power were decreased at ranges
∼155 km and ∼185 km. These “gaps” on the RTI plot
cor-respond to the nulls between the main and side lobes of the LTPR’s beam pattern. Figure 6 (b) confirmed that the en-velope of the distribution of echo power received by the Rx array reproduced the LTPR’s beam pattern.
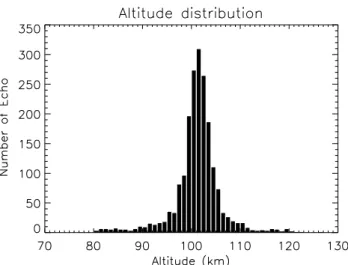
Fig. 7. Histogram of true height distribution of echoes by the LTPR
at 2300–2400 JST, 3 August 2002.
Figure 7 plots the distribution for the true height of echoes during the rocket experiment on 3 August determined with
the interferometer technique. It is easy to see that most
echoes are at altitudes between 95 and 110 km and there are few echoes with the true heights higher than 120 km. As dis-cussed by Hysell et al. (2002), radar waves may be refracted
by steep plasma density gradient around the Es layer up to
±1.5◦. However, this does not largely change estimated true heights. Since refraction occur very close to the scattering point which are shown to be around the Es layer, the error of the position owing to the refraction is small. The echo range was not a correct indicator of the echo height, but was a in-dicator of azimuthal arrival angles. However, weak echoes at higher altitudes (up to 120 km) have been detected by MU radar interferometry (Yamamoto et al., 1994). This may be because the MU radar is much more sensitive to the FAI echoes, has a narrower radar beam, and observes in the di-rection much close to the geomagnetic north compared with the LTPR in the SEEK-2 campaign.
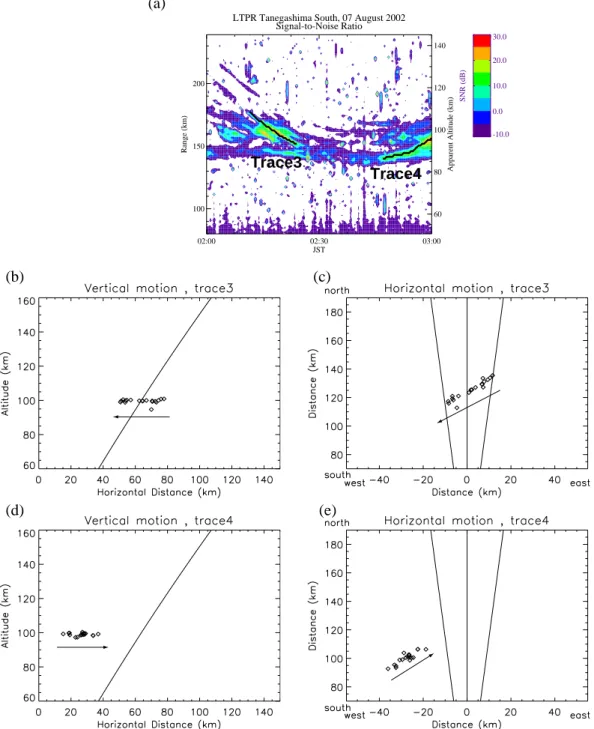
According to what has been discussed above, the echo locations of QP striations with negative range rates should move westward across the LTPR beam pattern, and those with positive range rates should move eastward. To confirm whether this occurred, we tracked the positions of various QP striations observed during the SEEK-2 campaign. Fig-ure 8 (a) is an RTI plot for echo power observed from 23 to 24 JST on 3 August 2002, when the rockets were launched. We tracked two striations in the RTI plot. During this time period, all the striations had negative range rates. These echoes both in Traces 1 and 2 moved westward across the radar beam at an almost constant altitude of 100 km along the locus of perpendicularity (Fig. 8(b)–(e)). There is an-other example obtained between 02 and 03 JST on 7 August 2002, in Fig. 9. The range rate changed from negative to pos-itive at 0240 JST. The tracking echo locations of Trace 3 with a negative range rate (Fig. 9(b) and (c)) exhibited westward motion, and Trace 4 with a positive range rate (Fig. 9(d) and
(e)) exhibited eastward motion. During this time interval, the true heights of echoes were almost constant at about 100 km. Because of the high magnetic aspect angle sensitivity of FAIs, their effective radar field-of-view was quite narrow across the locus of perpendicularity and wide along it. There-fore, we concluded that the radar observes echoing regions passing across the effective field-of-view along the locus of perpendicularity like a slit camera does. The QP striations can be explained by assuming one-dimensionally elongated echoing regions passing across the slit. A single striation is often split into several clusters of echoes. For example, Trace 2 in Fig. 8(a) consists of five clusters of echoes. We found that this was not only because the echoes were at the null points of the radar beam pattern. This indicates that patchy echoing regions were organized in a line and drifted horizontally as a group.
In what follows, we discuss how we interpreted the RTI plots of QP echoes. QP striations are apparently produced by the horizontal motion of echoes at an almost constant height. A negative range rate is, for the LTPR beam pattern, inter-preted as the motion of the echoing region with a westward velocity component. A positive range rate means an eastward velocity component for the moving echoing region. Gaps consistently seen in all QP striations of the LTPR around the 155 and 185 km ranges correspond to null points of the an-tenna pattern. Such gaps in QP striations could not be de-tected with the FAR. The FAR had a sharper beam, which meant more suppressed side lobes. Therefore, the FAR only detected echoes in the main lobe. This also explains why echoes detected by the FAR were limited in narrower ranges than echoes by the LTPR. If the main lobe had been point-ing to geomagnetic north, echoes at shorter ranges would have arrived from the main lobe, and echoes at longer ranges would have arrived from the side lobes. If the main and side lobes had been pointing to the west of geomagnetic north, as-cending striations would have been seen in an RTI plot, when descending striations were seen by the radar pointing to the east of the geomagnetic north.
5 Neutral wind derived from meteor echoes and FAI
structure
The LTPR could detect meteor echoes as well as FAI echoes. Meteor trails are generated at altitudes of lower E and up-per D region (70–110 km) and effectively reflect VHF radio waves. As they move with ambient neutral atmosphere, mean horizontal wind velocities can be estimated by finding best fit to observed Doppler velocities of meteor trails. Meteor echoes were distinguished from FAI echoes by their char-acteristic temporal variations in power. The same antennae that had been set up as for FAI interferometry was used to determine the locations of meteor trails. To determine the unique arrival angles of meteor echoes, we assumed that me-teor echoes could be found between 75 and 105 km altitude.
Furthermore, interferometry solutions with azimuth −45◦–
LTPR Tanegashima South, 03 August 2002 Signal-to-Noise Ratio 23:00 23:30 00:00 JST 100 150 200 Range (km) 60 80 100 120 140 Apparent Altitude (km) SNR (dB) -10.0 0.0 10.0 20.0 30.0 (b) (e) (d) (c) (a) Trace2 Trace1
Fig. 8. (a) Echoes observed between 2300 and 2400 JST on 3 August 2002. Motion of echoes on Trace 1 in (a) is tracked in (b) the vertical
and (c) horizontal planes. Solid line in (b) indicates the center of radar beam (Azimuth +30◦). Three solid lines in (c) indicates the center of radar beam and the directions of +30 ± 5◦. (d) and (e) are same as (b) and (c), except for Trace 2 in (a).
adopted. For solutions with elevation angles of more than
60◦, any azimuth angle was allowed. Echoes whose unique
arrival angles could not be determined based on these restric-tions were discarded. With meteor echoes selected according to these conditions, we estimated the neutral wind velocity with an altitudinal resolution of 3–6 km and temporal resolu-tion of 1 hour. It should be noted that it is the neutral wind velocity over the LTPR that is derived from the meteor echo measurements, while FAIs are observed along the locus of perpendicularity.
Figure 10 shows the zonal and meridional neutral wind velocity profiles derived from meteor echoes between 23– 24 LT on 3 August 2002, when the rockets were launced. The neutral wind velocity derived from meteor echoes at 100–
105 km was 52 m/s−1 toward −70◦ azimuth. The second
rocket (S310–32) released TMA (Tri-Methyl Aluminum) so that neutral wind velocity around the rocket orbit could be measured. The neutral wind velocity at an altitude of 103 km
derived from the TMA trail was 85 m/s−1 toward −145◦
LTPR Tanegashima South, 07 August 2002 Signal-to-Noise Ratio 02:00 02:30 03:00 JST 100 150 200 Range (km) 60 80 100 120 140 Apparent Altitude (km) SNR (dB) -10.0 0.0 10.0 20.0 30.0 (b) (e) (d) (c) (a) Trace3 Trace4
Fig. 9. Same as Fig. 8, except that 02 to 03 JST on 7 August 2002 are shown. (b) and (c) correspond to Trace 3, while (d) and (e) correspond
to Trace 4.
(Larsen et. al., 2005), which was generally in agreement with our results derived from meteor echoes. The discrepancy between neutral winds derived from meteor echoes and the TMA trail may be due to the difference of observed regions. Figure 11 plots the zonal and meridional components of neutral winds from the meteor echo observations (a) before and (b) after the reversal of range rate at 0240 JST on 7 Au-gust 2002 as presented in Fig. 9(a). Horizontal bars on the neutral wind profiles are the standard deviations in the least-square estimation. The altitude resolution was reduced to 6 km in this plot because fewer meteor echoes were
avail-able. There was a change in neutral wind at 103 km altitude from southeastward to northwestward corresponding to the reversal of range rate from negative to positive (Fig. 9(a)).
Table 3 compares neutral wind velocity at 100–103 km de-rived with the altitude resolution of 3 km and motion of the echoing region for 10 QP-echo events observed from 3 to 8 August 2002. To infer the configuration of the echoing re-gion, we prepared a model of the drifting echoing region and neutral wind. We assumed that the echoing regions were one-dimensionally elongated or a chain of patches organized in a line drifting with local neutral wind. Neutral wind velocity
Table 3. Relationship between direction of motion of echoing region and neutral wind and estimated directions of normal vectors of
wavefronts. Angle is measured anti-clockwise from geographic east.
Echoing Region (Range Rate) Neutral Wind Number of Events Angle of FAI echo region (θE) (a) Westward (Negative) Southeastward 5 1.8◦, 8.8◦, 5.2◦, 1.4◦, 2.3◦
(b) Westward (Negative) Northwestward 2 75.3◦, 28.2◦
(c) Eastward (Positive) Southwestward 1 7.2◦
(d) Eastward (Positive) Northeastward 2 −13.5◦, 17.7◦
Fig. 10. Zonal (Eastward) and Meridional (Northward) compo-nents of neutral wind velocity from 2300, 3 August, to 0100, 4 Au-gust 2002 are shown.
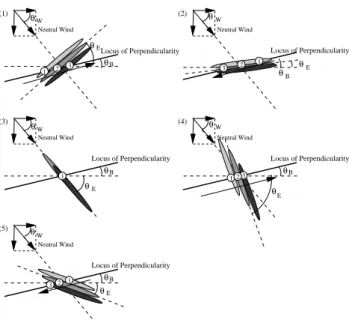
was not necessarily perpendicular to the major axis of the echoing region. We also assumed that they move horizon-tally at a constant altitude. In Fig. 12, we showed the re-lationship between the true motion and the apparent motion to the radar for the echoing region elongated in various di-rections when southeastward wind was applied. We know direction of the apparent motion of the echoes (θB) from in-terferometry observations, and wind speed (vn) and its
direc-tion (θW) from simultaneous meteor observations. The true
angle of the major axis of the echo region (θE) can be
es-timated as suggested in the figure. All angles are measured anti-clockwise from the geographic east. When the major axis of the echoing region is northwest-southeast (Fig. 12 (1) and (2)), the apparent motion of echoes is eastward if θE>θB, and westward if θE<θB. When the major axis of the echoing region is northeast-southwest, (Fig. 12 (3)−(5)) echoes will not move apparently if θE=θW, move eastward if θE>θW, and move westward if θE<θW. A similar model can be con-structed for any neutral wind direction.
On 3 August 2002, when the rockets were launched, the
estimated θE was 75◦, that is, the estimated wavefront was
from north-northwest to south-southeast. At this time, vn
was 52 m/s−1to west-northwest which was very close to the
(b)
(a)
Fig. 11. Zonal (Eastward) and Meridional (Northward) components
of neutral wind velocity (a) from 0130 to 0230 JST and (b) from 0230 to 0330 JST, 7 August 2002 are shown.
direction normal to the estimated wavefront. This orientation of the wavefront and its relationship to the neutral wind is the same as indicated by Fig. 12 (1). As the wind direction of this case is reversed from the figure, the motion of the echo-ing region is also reversed. Time delay of echo appearance of the LTPR behind the FAR is estimated from the observed
wind velocity and θE as 18.3 min. The delay is very close to
what was directly measured from the cross correlation analy-sis of echo intensities (19.5 min, see Sect. 3). This reasonable
Neutral Wind Neutral Wind B θ (1) Locus of Perpendicularity (2) Neutral Wind B θ Locus of Perpendicularity (4) Neutral Wind B θ Locus of Perpendicularity (3) Neutral Wind B θ Locus of Perpendicularity (5) θW θ θ θ θ W W W θE θE B θELocus of Perpendicularity E W θE θ θ 3 1 2 1 3 2 1 2 3 1 1 2 3
Fig. 12. How one-dimensionally elongated echoing region moves
in the horizontal plane along locus of perpendicularity with neu-tral wind. Echoing region is assumed to be at constant altitude of 100 km moving with southeastward neutral wind. Angles are mea-sured anti-clockwise from geographic east.
agreement validates our assumption for the analysis that lin-ear wavefronts of FAIs are moving with neutral wind.
We wish to point out that winds measured by LTPR were used instead of those measured from the TMA trail (released during rocket upleg) although the latter measurements were geographically closer to the radar echoes than the former. If the TMA winds measured between 100 and 105 km were used, the results would not change significantly. This seems to justify using the neutral wind velocity derived from me-teor echoes for this analysis. Having found that similar re-sults could be obtained by using winds measured by LTPR in place of those from TMA technique, we proceeded to use LTPR winds for nights when TMA derived winds were not available.
We estimated θE for the ten events including 3 August
2002. The results are summarized in the fourth column of
Table 3. In most cases, we estimated that θE were between
0◦and 20◦. This means that the frontal structures are elon-gated east-west and are slightly tilted anti-clockwise. To summarize this, typically a range rate is negative (positive) when a frontal structure of echoing regions elongated east-northeast−west-southwest drifts with southward (northward) neutral wind. This is consistent with the tendency for the echoes to appear at the FAR earlier than at the LTPR, which is located south of the FAR as mentioned in Sect. 3.
6 Discussion
Semidiurnal behavior of range rates for QP echoes was ob-served by Pan and Tsunoda (1999). They found that the range rates for QP echoes changed their signs from negative
to positive around 22 LT and from positive to negative again around 04 LT. They related this to the semidiurnal tide of lower thermospheric wind. Neutral wind measurements si-multaneous with FAI observations have been done by TMA releases from sounding rockets to produce snapshots of neu-tral wind profiles. In the SEEK-2 campaign, we observed FAIs and neutral wind continuously, which made it possible for the first time to compare QP echoes and neutral wind be-havior. Between 02 and 03 JST on 7 August 2002, reversal of the range rate was observed as we can see from Fig. 9(a). The reversal occurred at 0230 JST, which is even later than the 22 LT reported by Pan and Tsunoda (1999), coinciding with the change of neutral wind. Throughout the SEEK-2 obser-vation, such reversal after 22 LT was not clear, and negative range rates were very often observed later than 22 JST. From our observations, we knew that a negative (positive) range rate corresponded to westward (eastward) motion along the locus of perpendicularity. This is apparent motion depending on the shape and direction of motion for the echoing region as discussed in the previous section.
Recently, Hysell et al. (2004) conducted simultaneous
ob-servation of Es layers and QP echoes by the Arecibo
inco-herent scatter radar and a 30-MHz coinco-herent scatter radar.
They found patchy structures of Es forming wavefronts by
the incoherent scatter radar when the QP echoes were ob-served by the coherent scatter radar. They also found bands of echoing region elongated in the east-west direction by the coherent scatter radar. The band structure found by them could corresponds to the wavefront inferred by our analy-sis. Larsen (2000) argued that the horizontal wavelengths of Kelvin-Helmholtz structure could be ∼8–16 km. The size of the patches of echoing regions observed by the LTPR was 10–30 km as shown in Figs. 8 and 9. By observing FAIs and neutral wind simultaneously with interferometry measure-ments, we showed that the motion of these structures were closely related to the background neutral wind by simultane-ous FAI and meteor echo observations.
Yamamoto et al. (1997) showed that wavefronts of QP echoes were aligned with the direction from northwest to southwest and propagated southwestward, which were dif-ferent from our results that the wavefronts were often aligned east-northeast−west-southwest. They used the MU radar and a portable VHF radar separated by approximately 40 km and compared the RTI plots by non-interferometry observa-tion. Since analysis was done for the data in relatively short period, ten events in six nights from 3 to 8 August 2002, possibility for the wavefronts to be aligned in northwest– southeast should not be excluded.
The instability of Es layer proposed by Cosgrove and
Tsunoda (2002) suggests that the growth rate maximizes when the wave front is in northwest–southeast direction. The growth rate shown by them are nearly zero or slightly negative for the typical wave fronts obtained by our anal-ysis which are aligned in east-northeast to west-southwest. Onoma et al. (2005) observed atmospheric gravity waves (AGWs) at altitudes of approximately 86 km and 96 km al-titudes using an airglow imager located near the FAR site
from 1 to 8 August 2002. They found that a dominant direc-tion atmospheric gravity waves propagated was southeast-ward when FAIs were observed by the LTPR. Our findings where the frontal structures of FAIs were predominantly east-northeast to west-southwest direction seem to indicate the importance of the AGWs in the generation process of QP echoes.
7 Conclusion
We conducted observations of FAI echoes, especially QP echoes, associated with midlatitude sporadic-E layers in the southwest of Japan with the LTPR and the FAR. The radars were located 40 km apart and utilized together with two
rocket experiments. The LTPR measured FAIs and
neu-tral wind simultaneously and continuously by interferome-try measurements. the LTPR and the FAR very often pro-vided similar shapes for QP echoes with certain lag times. Echoes typically appeared 10 min earlier at the FAR than at the LTPR. This suggests that plasma irregularities associated with Eslayers are not distributed randomly but are organized with a correlation length of more than several tens of kilome-ters.
One of the important findings is that QP structures of the FAI echoes were horizontal in this experiment. We also find that the QP structures are well explained by the spatial vari-ability and motion of the neutral atmosphere. By tracking echoes of QP striations, we confirmed the suggestion by Hy-sell et al. (2002) that echoes would come from side lobes in addition to the main lobe. It was clear that QP striations on RTI plots were produced by the horizontal motion of echo-ing regions across the field of view of the radar along the locus of perpendicularity. Few echoes were detected at alti-tudes higher than 120 km or lower than 90 km. QP echoes with negative range rates appeared on the eastern side lobes at longer ranges. As they moved westward along the locus of perpendicularity at constant altitude with decreasing range through the main lobe to the western side lobes, which was still to the east of geomagnetic north, distances to the scat-tering points decreased. Echoes with positive range rates, on the other hand, moved eastward. Echoing regions seem to be one-dimensionally elongated, and often patchy and aligned.
QP echoes have been reported to propagate often south-eastward by previous studies (e.g. Yamamoto et al., 1997).
The Es layer instability mechanism proposed by Cosgrove
and Tsunoda (2002) is most effective in this direction. By analyzing movement of the echoes and the neutral wind dur-ing the SEEK-2 period, however, we found that the echo-ing region was aligned north-northeast to south-southwest propagating west-northwestward on 3 August 2002, when the rockets were launched. And it was often, eight out of ten QP events in the present study, aligned east-northeast to west-southwest. This shows that QP echoes can be observed not only when the echoing regions are aligned northwest to southeast as suggested by Cosgrove and Tsunoda (2002). This was made possible for the first time by the simultaneous
observations of neutral wind and FAIs with interferometry measurements. Onoma et al. (2005) reported from their air-glow observations that a predominant direction of propaga-tion of atmospheric gravity waves was southeastward when QP echoes were observed. Their result is consistent with ours. This finding indicates that AGW seeding of QP echoes
cannot be ignored. In practice, AGWs, the Es layer
instabil-ity, and the shear instability (Larsen, 2000) may intricately interrelated with each other. To distinguish between those effects, more extensive simultaneous observations of FAIs, neutral wind, and AGWs are necessary.
Acknowledgement. This study was supported in part by a
Grant-in-aid for Scientific Research B(2)(14340145) made by the Min-istry of Education, Science, Sports and Culture, Japan. The authors are grateful to Nishinoomote city, Kagoshima prefecture, Japan, for their kind support in operating the FAR, and to the Japanese Aerospace Exploration Agency for their kind support in operating the LTPR.
Topical Editor M. Pinnock thanks J. L. Chau and another referee for their help in evaluating this paper.
References
Bernhardt, P. A.: The modulation of sporadic-E layers by Kelvin-Helmholz billows in the neutral atmosphere, J. Atmos. Solar-Terr. Phys., 64, 1487–1504, 2002.
Cosgrove, R. B. and Tsunoda, R. T.: A direction dependent instabil-ity of sporadic-E layers in the nighttime midlatitude ionosphere, Geophys. Res. Lett., 29, 11–1, doi:1029/2002GL014669, 2002. Fukao, S., Yamamoto, M., Tsunoda, R. T., Hayakawa, H., and
Mukai, T.: The SEEK (Sporadic-E Experiment over Kyushu) campaign, Geophys. Res. Lett., 25, 1761–1764, 1998.
Hysell, D. L. and Burcham, J. D.: The 30-MHz radar interferometer studies of midlatitude E region irregularities, J. Geophys. Res., 105, 12 797–12 812, 2000.
Hysell, D. L., Yamamoto, M., and Fukao, S.: Imaging radar obser-vations and theory of type I and type II quasi-periodic echoes, J. Geophys. Res., 107A11, 1360, doi:10.1029/2002JA009292, 2002.
Hysell, D. L., Larsen, M. F., and Zhou, Q. H.: Common volume coherent and incoherent scatter observations of mid-latitude spo-radic E-layers and QP echoes, Ann. Geophys., 22, 3277–3290, 2004,
SRef-ID: 1432-0576/ag/2004-22-3277.
Larsen, M. F.: A shear instability seeding mechanism for quasiperi-odic radar echoes, J. Geophys. Res., 105, 24 931–24 940, 2000. Larsen, M. F., Yamamoto, M., Fukao, S., Saito, A., and Tsunoda,
R. T.: SEEK 2: Observations of neutral winds, wind shears, and wave structure during a sporadic E/QP event, Ann. Geophys., 23, 2369–2375, 2005.
Maruyama, T., Fukao, S., and Yamamoto, M.: A possible mecha-nism for echo striation generation of radar backscatter from mid-latitude sporadic E, Radio Sci., 35, 1155–1164, 2000.
Miller, K. L. and Smith, L. G.: Incoherent scatter radar observa-tions of irregular structure in mid-latitude sporadic E layers, J. Geophys. Res., 83, 3761–3775, 1978.
Ogawa T., Takahashi, O., Otsuka, Y., Nozaki, K., Yamamoto, M., and Kita, K.: Simultaneous middle and upper atmosphere radar and ionospheric sounder observations of midlatitude E region
irregularities and sporadic E layer, J. Geophys. Res., 107A10, 1275, doi:10.1029/2001JA900176,, 2002.
Onoma, F., Otsuka, Y., Shiokawa, K., Ogawa, T., Yamamoto, M., Fukao, S., and Saito, S.: Relationship between gravity waves in OH and OI airglow images and VHF radar backscatter from E-region filed-aligned irregularities during SEEK-2 campaign, Ann. Geophys., 23, 2385–2390, 2005.
Pan, C. J. and Tsunoda, R. T.: Semidiurnal behavior of quasi-periodic echoes in the mid-latitude Es region observed with the Chung-Li VHF radar, Geophys. Res. Lett., 26, 2621–2624, 1999. Tsunoda, R. T., Fukao, S., and Yamamoto, M.: On the origin of quasi-periodic radar backscatter from midlatitude sporadic E, Radio Sci., 29, 349–365, 1994.
Tsunoda, R. T., Cosgrove, R. B., and Ogawa, T.: Azimuth-dependent Es layer instability: A missing link found, J. Geo-phys. Res., 109A12303, doi:1029/2004JA010597, 2004. Wang, C.-H. and Chu, Y.-H.: Interferometry investigations of
blob-like sporadic E plasma irregularity using the Chung-Li VHF radar, J. Atmos. Solar-Terr. Phys., 63, 123–133, 2001.
Woodman, R. F., Yamamoto, M., and Fukao, S.: Gravity wave mod-ulation of gradient instabilities in mid-latitude sporadic E irregu-larities, Geophys. Res. Lett., 18, 1197–1200, 1991.
Yamamoto, M., Fukao, S., Woodman, R. F., Ogawa, T., Tsuda, T., and Kato, S.: Mid-latitude E region field-aligned irregular-ities observed with the MU radar, J. Geophys. Res., 96, 15 943– 15 949, 1991.
Yamamoto, M., Kodama, N., Fukao, S., Tsunoda, R. T., Ogawa, T., and Tsuda, T.: Spatial structure of the E region field-aligned irregularities revealed by the MU radar, Radio Sci., 29, 337–347, 1994.
Yamamoto, M., Fukao, S., Tsunoda, R. T., Igarashi, K., and Ogawa, T.: Preliminary results from joint measurements of E-region field-aligned irregularities using the MU radar and the frequency-agile radar, J. Atmos. Terr. Phys., 59, 1655–1663, 1997. Yamamoto, M., Fukao, S., Tsunoda, R. T., and Hayakawa, H.:
SEEK-2 (Sporadic-E Experiment over Kyushu II) – Project Out-line and Significance –, Ann. Geophys., 23, 2295–2305, 2005 Yokoyama, T., Yamamoto, M., and Fukao, S.: Computer
simu-lation of polarization electric fields as a source of midlatitude field-aligned irregularities, J. Geophys. Res., 108(A2), 1054, doi:10.1029/2002JA009513, 2003.
Yokoyama, T., Yamamoto, M., Fukao, S., and Cosgrove, R. B.: 3-D simulation on generation of polarization electric field in the midlatitude E-region ionosphere, J. Geophys. Res., 109A01309, doi:10.1029/2003JA010238, 2004.