HAL Id: insu-03209896
https://hal-insu.archives-ouvertes.fr/insu-03209896
Submitted on 27 Apr 2021
HAL is a multi-disciplinary open access
archive for the deposit and dissemination of
sci-entific research documents, whether they are
pub-lished or not. The documents may come from
teaching and research institutions in France or
abroad, or from public or private research centers.
L’archive ouverte pluridisciplinaire HAL, est
destinée au dépôt et à la diffusion de documents
scientifiques de niveau recherche, publiés ou non,
émanant des établissements d’enseignement et de
recherche français ou étrangers, des laboratoires
publics ou privés.
Electromagnetic ELF radiation from earthquake regions
as observed by low-altitude satellites
O. Serebryakova, S. Bilichenko, V. Chmyrev, Michel Parrot, Jean-Louis
Rauch, François Lefeuvre, O. Pokhotelov
To cite this version:
O. Serebryakova, S. Bilichenko, V. Chmyrev, Michel Parrot, Jean-Louis Rauch, et al.. Electromagnetic
ELF radiation from earthquake regions as observed by low-altitude satellites. Geophysical Research
Letters, American Geophysical Union, 1992, 19 (2), pp.91-94. �10.1029/91GL02775�. �insu-03209896�
ELECTROMAGNETIC
ELF RADIATION FROM EARTHQUAKE
REGIONS AS
OBSERVED BY LOW-ALTITUDE SATELLITESO.N. Serebryakova
•, S.V. Bilichenko
x, V.M. Chmyrev
•, M. Parrot
:,
J.L. Rauch
2, F. Lefeuvre
2, and O.A. Pokhotelov
•
Abstract. Seismo-Electromagnetic (SEM) waves observed
by low-altitude
satellites
passing
over seismic
regions
were
studied. The data of the COSMOS-1809 satellite wereanalysed over the earthquake region in Armenia during the
period
from January
20 to February
17, 1989. Intense
EM
radiation at frequencies below 450 Hz was observed at the L-shells of the earthquake, during 12 orbits out of the 13 that
passed
within
6 ø in longitude
from the epicenter,
and during
1 out of 6 in the range of 6o-8 ø longitude away from this region. The other orbits, which passed 10ø-12 ø from the epicentre, showed no effect. To complete this study, we used the emissions observed by another low-altitude satellite (AUREOL-3). It is shown that during the event the seismic region is permanently radiating; the intensity and the envelope shape of the wave depend on its time relatively to the time of the earthquake. Their frequency spectra are compared to the average spectrum recorded in the same geomagnetic regions. Similar wave intensities and spectral distributions were observed on the two satellites during the seismic periods.
Introduction
Several reports have been published on the observations on ground of SEM emissions [Gokhberg eta!., 1982; Warwick et al., 1982; Fraser-Smith et al., 1990; Fujinawa and Takahashi, 1990]. Descriptions of mechanisms that might produce SEM emissions are available in the literature. Two main mechanisms are generally invoked: the first concerns direct-wave production by compression of rocks near the focal point [Ogawa et al., 1985; Cress et al., 1987], whereas the second is related to a redistribution of the electric charges in the Earth's atmospheric system, which produces electrical discharges [Gokhberg et al., 1988; Enomoto and Hashimoto, 1990]. Perturbations of the ionosphere are also known to occur, and SEM emissions have already been observed from satellites [Gokhberg et al., 1983; Larkina et al., 1983; Parrot and Lefeuvre, 1985; Chmyrev et al., 1989; Parrot and Mogilevsky, 1989; Parrot, 1990a; Bilichenko et al., 1990].
The aim of this study was to determine the zone in the ionosphere over an earthquake region where SEM waves can
be observed and to find their characteristic time scale. The
intensity
and the frequency
dependence
of the signals
are
discussed. For this purpose we carried out a special program
of observations onboard the COSMOS-1809 satellite from
Institute
of Terrestrial
Magnetism,
Ionosphere
and
Radio
Wave Propagation
Laboratoire
de Physique
et Chimie
de !'Environnement,
CNRS
Institute
of Physics
of the
Earth
Copyright
1992
by the American
Geophysical
Union.
Paper number 91GL02775 0094-8534/92/9!GL-02775 $03.00
91
January 20 to February 17, 1989, and analysed the data over the epicentral region in Armenia. The region and the time interval was chosen to study the possible ionospheric effects of strong aftershocks of crucial earthquake in Spitak (40.7øN, 44.0øE; December 7, 1988, M=6.7). These data are compared
with the data obtained from the AUREOL-3 satellite.
Experimental results
The COSMOS-1809 satellite was operating in near-circular orbits (970 km, i=82.5ø). ELF/VLF measurements were made with a 5-channel parallel-spectrum analyzer, both in the
electric
(Ex)
and
the magnetic
(By)
fields,
for which
the X and
Y axes were in a horizontal plane, being, repectively, North-South and East-West. The central frequencies of the analyzer were Fo = 140, 450, 800, 4500 and 15000 Hz, the filter bandwidth dF = Fo / 6 and the sampling rate 0.39 Hz.
According to Arefyev et al. (1989), during the period from January 20 to February 17, 1989, 729 aftershocks with energetic class 5.5 < K < 12.0 were registered within the zone 40.5 ø < Lat. < 41.5 ø and 43.5 ø < Long. < 44.5 ø . The distribution of these aftershocks with energetic class is shown in Figure 1A. To characterize the energy of the seismic processes, we represented in Figure lB the logarithm of
E= •10 •
i•l
where n is a number of aftershocks within considered 3 hour
intervals and Ki is an energetic class of aftershocks. The asterisks mark the periods of observation onboard the COSMOS-1809 satellite over the Spitak zone.
For analysis we selected the data from 24 orbits: 8 of them passing within 3 ø in longitude to the west of the epicentral region, 5 being between 4 ø and 6 ø to the east of this region,
6 other orbits were between 6 ø and 8 ø west and 5 more from
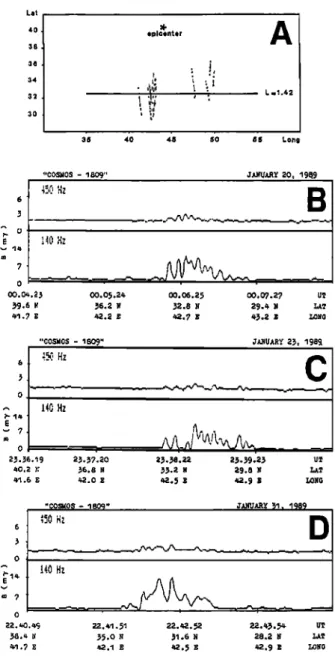
10 ø to 12 ø east of the epicentre. Parts of these orbits in geographic coordinates are shown in Figure 2A. The dashed
lines indicate the location where anomalous radiation (see below) was observed. The asterisk marks the location of
epicentral region, and the solid line corresponds to the L-shell of its projection at an altitude of 100 km (L = 1.42).
An example of the ELF intensity for the channels 140 and 450 Hz over the earthquake region is shown in Figure 2B. It is seen that an intense SEM emission of about 10 m•/around Fo = 140 Hz was observed from 33.7 ø up to 30 ø in latitude.
Enhancement of noise was also observed in the channel of
450 Hz, although its intensity did not exceed 3 m7. In both channels the maximum occurred at the geomagnetic latitude of the epicentre (L = 1.42). At higher frequencies no emissions were observed. In this example of January 20, 1989, the ELF emission was registered 2.5 hours before the earthquake, with the energetic class K = 10.5, at the distance ~ 1.5 ø to the west of the epicentre. A similar example (January 23, 1989) is presented in Figure 2C. In this case, as
92 Serebryakova et al.: ELF radiation from earthquake regions
in the previous one, SEM emissions at frequencies - 140 Hz were observed within a zone of about 4 ø length in latitude, with a maximum of intensity in the magnetic-field tube of the earthquake region (L ~ 1.42). This event was registered at a distance of ~ 1.5 ø in longitude to the west of the epicentre approximately 10 minutes before a shock with K = 9.0 and
about 2.9 hours before a shock with K = 10.7. Other similar characteristics that were observed within 3-hour intervals
before the main shocks are the quasi-regular modulation of the wave intensity. The example shown in Figure 2D illustrates the observation over the same region during the long series of weaker and numerous shocks.
The examples presented above were obtained along the orbits that crossed the L-shell of the earthquake region not more than 3 ø away in longitude from the epicenter. All 8 passages within this 3ø-interval recorded emissions similar to those shown in Figures 2B to 2D. Similar radiation patterns were observed during 4 of 5 orbits that passed from 4 ø to 6 ø away from longitude of the epicentre, but only in one case of
6 where the satellite was between 6 ø and 8 ø distant. No
effects were seen during the 5 orbits that passed at a distance from 10 ø to 12 ø in longitude. it should be noted that in all cases when ELF emissions were observed over the Spitak region, only normal background noise was observed at the same L-shells during the following and preceding orbits.
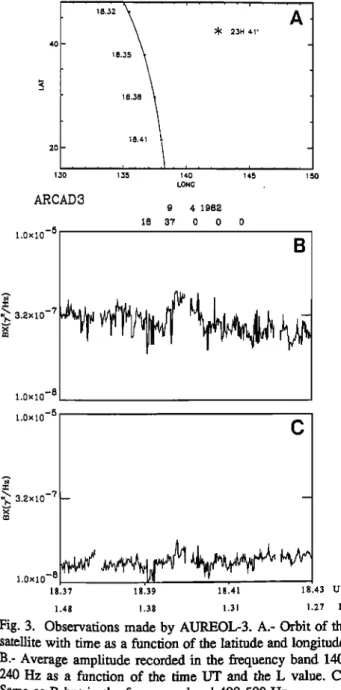
The same phenomenon was observed on the VLF experiment ARCAD-3 [Berthelier eta!., 1982] of the satellite AUREOL-3 (a= 2000km, p= 400km, i= 82.5ø). Waveform data in the band 5 - 1500 Hz were recorded at S uggadeira (Japan) when the satellite was over an earthquake in preparation (M=4.9, April 9, 1982, 23.41 UT, 41.38øN,
142.14øE). A part of the AUREOL-3 orbit is plotted in Figure 3A. The star indicates the epicentre of the earthquake, which occurred roughly 5 hours after the pass of the satellite. A spectral analysis shows the same turbulent power spectra as
&8
L-Lc
œ 2 3 4 :5 6 7 8 9 19 11 12 1{A
i1 [ i i i i ! [ i i i r [ [ i i r [ ! i i [ i i i ! i i i 20 25 30 5 10 15 JA H U I%•¾ FEBRU • 31¾[Fig. 1. A.- Number of aAershocks as a function of energetic class. B.- Characterization of seismic activity (see text). The asterisks show when the satellite was operating over Spitak.
those observed on COSMOS-1809. As a comparison, the time variation of the signals on the magnetic component Bx in the 140-240 Hz band and in the 400-500 Hz band was plotted, respectively, in Figures 3B and C. Regular blanks are due to
the on-board calibrations that were removed from the data. As in the COSMOS-1809 cases, an increase is observed at the
lowest frequencies (Figure 3B), when the satellite was in the magnetic-field tube of the earthquake region (L- 1.34). The increase is slightly seen in the band 400-500 Hz and disappears at higher frequencies (Figure 3C). However, looking at the filterbank data it can be seen that the noise level was high in the 15 kHz filter. It is thus likely that two different wave phenomena occurred over the seismic region, but, it is difficult to know if they were related or no.t.
Let 40 38 36 34 32 30
*
A
epicenter ' t L=!.42 3'5 40 4'5 5'0 55 Long "C05•05 - 1809" JJ•t/AR¾ 20, 198.9 o 00.0•*.25 59.6 • •.1.? •4--.,{,
B
"COb"•O$ - '1809" JAtiUARY 2), 1989. -., ? o 25.•,6.19 40.2 11.1.6 140 Hz 5.57.a0 25.58.22 2•.59.25 u 56.8 N 55.2 N 29.8 N ½2.0 E •2.5 I• •2.9 s lONGFig. 2. Observations made by COSMOS-1809. A.- Location of the epicentre and orbits of the satellite where emissions are observed. B.- Observations in two frequency bands (140 and 450 Hz) 2.5 hours before an earthquake. The time UT, the
latitude
and
longitude
are indicated.
C.- Observations
recorded
10 minutes and 2.9 hours before two shocks. D.- Observations
Discussion
The observations of ELF/VLF waves onboard COSMOS-
1809 over the Spitak region show that SEM emissions at
frequencies
below
450 Hz were
regularly
observed
around
the
L-shell of the earthquake, when the satellite passed within 6 ø in longitude from the epicentre. The fact that such emissions were never observed during the orbits located more than 10 ø
away
from the earthquake,
and the right magnetic
conjugacy
between the registration zone and the epicenter, support the conclusion that these emissions are of seismic origin. Principally, low-altitude emissions at 100-500 Hz can be stimulated in the ionosphere by powerful ground-based VLF transmitter (Chmyrev et al., 1990; Parrot, 1990b) or radiated from power lines harmonic radiations (PLHR) of 50 Hz.
However there are no VLF transmitters where we collected
the data for this study. The nearest VLF transmitter (Krasnodar: 45øN, 38øE) was not seen in the channel 15 kHz at the fragments of orbits shown in Figure 2A. Concerning
130 ARCAD3 -5 1.0x10 A • 0-7 • 3.2xl -8 1.OxlO -5 t.OxlO • 23H 41' 140 LONG i i , 135 145 9 4 1982 18 37 0 0 0 B
c
•'• 3.2x10
-7 _
--
18.37 18.39 18'.4! 18.43 UT 1.48 1.38 1.31 1.27 LFig. 3. Observations
made
by AUREOL-3.
A.- Orbit of the
satellite with time as a function of the latitude and longitude.
13.-
Average
amplitude
recorded
in the frequency
band
140-
240 Hz as a function of the time UT and the L value. C.-
Same
as B but
in the frequency
band
400-500
Hz.
the PLHR, its intensity at an altitude about 100 km is much lower than the intensity we observed. No other sources of ELF radiation (either natural or man-made) in this narrow (-- 6 ø ) low-latitude region are known to the authors.
An important feature of the wave phenomenon observed on COSMOS-1809 is the modulation of the wave intensity. This intensity at 140 Hz was modulated with a period about 5 sec. during 4 passages from the 8 within the 3ø-interval (January 20 and 23, February 11 and 16). Three of these 4 events were registered less than 3 hours before the earthquakes with K =
10.5, 10.7 and 10.4. It must be noted that during the observations less than one percent of the earthquakes had an energetic class K > 10 (Figure IA). So we suggest that this modulation can characterize the preparation processes of strong earthquakes. Two explanations can be considered: an interaction of ELF and VLF wave processes in the source region in the Earth, or, a formation of strong field-aligned plasma density inhomogeneities in the ionosphere over the earthquake region. Such a modulation is less clear from the
ARCAD-3 data. If such a modulation was to be a constant
feature, it could be interesting for the forecasting of earthquakes. Since ELF emissions were registered practically during each of the passes at less than 6 ø of the earthquake region, we can consider that this region was permanently radiating during the active period. The characteristics of the radiation depend on the time difference between the observations and the actual onset of the earthquakes.
Different observations on COSMOS-1809 and AUREOL-3
of SEM waves have been combined to identify a power- spectrum signature (Figure 4). The upper panel (E) is related to the electric amplitude and the lower (B) to the magnetic one. As a reference, the solid lines represent the average amplitude recorded by AUREOL-3 all around the Earth at
invariant latitudes less than 30 ø. The ARCAD-3 data of this
paper (Figure 3) are plotted as dash-dot lines at 19.39.49 UT. The long-dash line in Figure 4B represents the average amplitude observed during the Armenian earthquakes, completed (at low frequency) by Bilichenko et al. (1990). Other examples from AUREOL-3 measurements are shown as a dashed line (Parrot and Mogilevsky, 1989) and as a dotted line (Parrot, 1990a). Figure 4 illustrates two different points: first, the power of the waves associated with earthquakes is higher than the power of the natural noises at those latitudes;
F lO
-3 ...
.• lO-•, >•, 10 -5.• 10
-6
•. 10 -7 10 1 O0 1000 Frequency (Hz) 10 -1 . 10 -2.• 10-3
ß -• 10-4• lO-5 ,
lO 1 O0 1000 Frequency (Hz)Fig. 4. Amplitudes, as a function of the frequency, of the electric (upper panel) and magnetic (lower panel) signals recorded by COSMOS-1809 and AUREOL-3 (see text).
94 Serebryakova et al.: ELF radiation from earthquake regions
second, the amplitudes observed during different events by two different low-altitude satellites are very similar.
As a comparison, the amplitude (B) of the signal received on the COSMOS-1809 magnetic components over Spitak has been expressed in terms of the amplitude (E) of the electric components. We assume that E and B are related through the equation: E = c B / n with c being the velocity of the light in vacuum and n the refractive index. The observed plasma frequency being of the order of 1.2 MHz and the electron gyrofrequency being about 780 kHz, we have estimated the
n values for a medium with 50 to 80% of H + ions. We obtain
values of about 2. 104 V/m at 10 Hz, 5. 10 '6 V/m at 150 Hz
and 10
'6 V/m at 450 Hz, which
are in perfect
agreement
with
the electric measurements performed on AUREOL-3.
Conclusion
Measurements of ELFFv'LF waves onboard the
COSMOS-1809 satellite in the ionosphere, during the seismically-active period from January 20 to February 17, 1989 over the Spitak region, have shown that intense ELF radiation was generated in the zone of 6 ø in longitude and 2 ø - 4 ø in latitude around the earthquake. The intensity of this radiation was about 10 my at 140 Hz (dF = 25 Hz) and about 3 mqt at 450 Hz (dF = 75 Hz). The intensity of the emissions observed less than 3 hours before earthquakes had a quasi-periodic modulation. The amplitude and the frequency dependence of the emissions recorded by different satellites are similar. However, due to the limited frequency band observed by the satellites, only parts of the spectrum radiated by an earthquake zone are known at the moment.
Acknowledgements. The ELF/VLF experiment of the COSMOS-1809 satellite was prepared under leadership of
O.A. Molchanov and Ya.P. Sobolev. The authors thank M.D.
Fligel for planning of satellite operations. The AUREOL-3 program was undertaken jointly by CNES in France, and by
INTERCOSMOS and IKI in the USSR. We thank J.J.
BerthelJer, who is the principal investigator of the VLF experiment, for the use of the data, and Yu I. Galperin who drew our attention to the Suggadeira data.
References
Arefyev S. S. et al., Previous results of Soviet-French seismic observations at the Spitak earthquake region on December 7, 1988, The founds of Institute of Physics of the Earth, USSR Academy of Science, Moscow, 1989. BerthelJer J.J., F. Lefeuvre, M.M. Mogilevsky, O.A. Molchanov, Yu.!.Galperin, J.F. Karczewski, R. Ney, G. Gogly, C. Guerin, M. Leveque, J.M. Moreau and F.X. Sene, Measurements of the VLF electric and magnetic components of waves and DC electric field on board the AUREOL-3 satellite: the TBF-ONCH experiment, Ann. Geophys., 38, 643, !982.
Bilichenko S.V., A.S. Inchin, E.F. Kim, O.A. Pokhotelov, P.P. Puschaev, G.A. Stanev, A.V. Streltsov and V.M.
Chmyrev, ELF response of the ionosphere on pre- earthquake processes. DAN USSR, 311, !077, 1990. Chmyrev V.M., N.V. Isaev, S.V. Bilichenko and G. Stanev,
Observation by space-borne detectors of electric fields and hydromagnetic waves in the ionosphere over an earthquake centre, Phys. Earth Planet Inter., 57, 110,
1989.
Chmyrev V.M., A.B. Draganov, Yu. N. Taranenko and D. Teodosiev, Acceleration of particles in the upper
ionosphere
and the magnetosphere
due to decay
interactions of whistlers, i, Physica Scripta, 43, 495,
1991.
Cress G.O., B.T. Brady and G.A. Rowell, Sources of electromagnetic radiation from fracture of rock samples in the laboratory, Geophys. Res. Lett., 14, 331, 1987. Enomoto Y. and H. Hashimoto, Emission of charged particles
from indentation fracture of rocks, Nature, 346, 64!,
1990.
Fraser-Smith A.C., A. Bemardi, P.R. McGill, M.E. Ladd, R.A. Helliwell and O.G. Viilard Jr., Low-frequency magnetic field measurements near the epicenter of the IV[ 7.1 Loma Prieta earthquake, Geophys. Res. Lett., 17,
1465, 1990.
Fujinawa Y. and K. Takahashi, Emission of electromagnetic radiation preceding the Ito seismic swarm of 1989,
Nature, 347, 376, 1990.
Gokhberg M.B., V.A. Morgounov, T. Yoshino and I. Tomizawa, Experimental measurement of electromagnetic emission possibly related to earthquakes in Japan, J. Geophys. Res., 87, 7824, 1982.
Gokhberg M.B., V.A. Pilipenko and O.A. Pokhotelov, Seismic precursors in the ionosphere, lzvestiya Earth Physics, 19, 762, 1983.
Gokhberg M.B., V.A. Morgounov and O.A. Pokhotelov, Seismic electromagnetic phenomena, Nauka, 169, 1988. Larkina V.I., A.V. Nalivayko, N.I. Gershenzon, M.B.
Gokhberg, V.A. Liperovskiy and S.L. Shalimov,
Observation of VLF emissions, related with seismic
activity, on the INTERCOSMOS-19 satellite, Geomagn.
Aeron., 23, 684, 1983.
Ogawa T., K. Oike and T. Miura, Electromagnetic radiations from rocks, J. Geophys. Res., 90, 6245, 1985.
Parrot M. and F. Lefeuvre, Correlation between GEOS
VLF emissions and earthquakes, Ann. Geophys., 3,
737, 1985.
Parrot M. and M.M. Mogilevsky, VLF emissions associated with earthquakes and observed in the ionosphere and the magnetosphere, Phys. Earth Planet Inter., 57, 86, 1989. Parrot M., Electromagnetic disturbances associated with earthquakes: an analysis of ground-based and satellite data, Journal of Scientific Exploration, 4, 203, 1990a. Parrot M., World map of ELF/VLF emissions as observed by
a low-orbiting satellite, Ann. Geophys., 8, 135, 1990b. Warwick J.W., C. Stoker and T.R. Meyer, Radio emission
associated with rock fracture: possible application to the great Chilean earthquake of May 22, 1960, J. Geophys.
Res., 87, 2851, 1982.
S.V. Bilichenko, V.M. Chmyrev and O.N. Serebryakova, Institute of Terrestrial Magnetism, Ionosphere and Radio Wave Propagation, 142092 Troitsk, Moscow region, USSR. F. Lefeuvre, M. Parrot and J.L. Rauch, LPCE/CNRS, 3A
Avenue de la Recherche, 45071 Orleans cedex 2, France.
O.A. Pokhotelov, Institute of Physics of the Earth, B. Gruzinskaya 10, Moscow 123810, USSR.
(Received: Mars 5, 199!;
Revised: September 10, 1991; Accepted: October 28, 1991.)