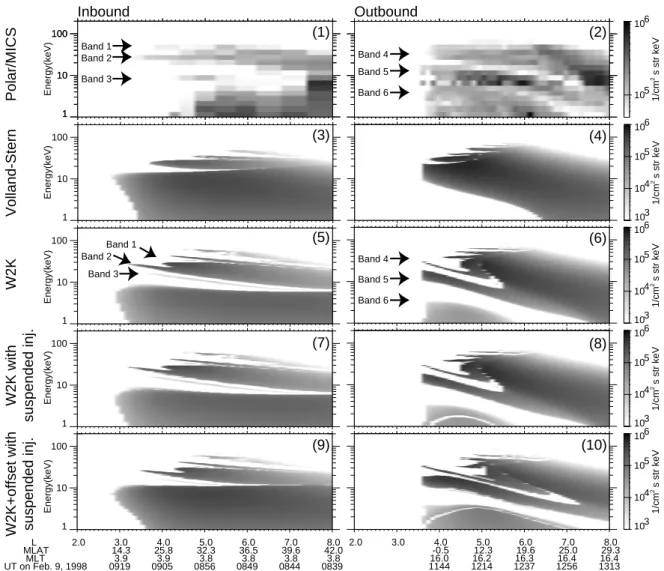
Multiple discrete-energy ion features in the inner magnetosphere: 9 February 1998, event
Texte intégral
Figure
Documents relatifs
Sur le Massif armoricain, le développement de l'hydrogéologie en tant que science est en grande partie lié aux problèmes d'alimentation en eau potable et aux
These works had identified that gas drag on larger particles may not be su fficient to accelerate them beyond escape velocity, but they also pointed out that local variations in
Evidence for a 110 –90 Ma cooling event spanning the entire subcontinent of South Africa can be found in (i) AFT data from the southwestern cape [Wildman et al., 2015], southern
In the last step, the reactivity of glass after the different treatment programs was evaluated by the study of the mechanical behavior of mortars including the
We use here the trajectories of ∼ 60 000 numerical rays representing most of the chorus parameters observed in the inner mag- netosphere, which allows us to study statistically
Schematics of parallel electric field configuration of ESW observed in the inner magnetosphere (propagation from right to left): (a) symmetric bipolar divergent parallel electric
Though ion scale waves are preferentially observed during intervals with a radial mean magnetic field, we show that measurement constraints, associated with single spacecraft
They compared EMIC wave observations to simulation of wave propagation in the ionospheric duct by Woodroffe and Lysak [2012] and presented evidence that EMIC waves in the inner
