HAL Id: hal-00302414
https://hal.archives-ouvertes.fr/hal-00302414
Submitted on 17 Dec 2004
HAL is a multi-disciplinary open access
archive for the deposit and dissemination of
sci-entific research documents, whether they are
pub-lished or not. The documents may come from
teaching and research institutions in France or
abroad, or from public or private research centers.
L’archive ouverte pluridisciplinaire HAL, est
destinée au dépôt et à la diffusion de documents
scientifiques de niveau recherche, publiés ou non,
émanant des établissements d’enseignement et de
recherche français ou étrangers, des laboratoires
publics ou privés.
Testing the hypothesis of the Earth’s magnetosphere
behaving like an avalanching system
A. T. Y. Lui
To cite this version:
A. T. Y. Lui. Testing the hypothesis of the Earth’s magnetosphere behaving like an avalanching
system. Nonlinear Processes in Geophysics, European Geosciences Union (EGU), 2004, 11 (5/6),
pp.701-707. �hal-00302414�
in Geophysics
© European Geosciences Union 2004
Testing the hypothesis of the Earth’s magnetosphere behaving like
an avalanching system
A. T. Y. Lui
The Johns Hopkins University Applied Physics Laboratory, Laurel, Maryland 20723, USA
Received: 18 October 2004 – Revised: 9 December 2004 – Accepted: 10 December 2004 – Published: 17 December 2004 Part of Special Issue “Nonlinear processes in solar-terrestrial physics and dynamics of Earth-Ocean-System”
Abstract. The global auroral dissipation power as observed
by the imager on the Polar spacecraft is used as a proxy for the power dissipation of the Earth’s magnetosphere to exam-ine whether or not the magnetosphere is an avalanching sys-tem. It is found that the probability density distributions for the area and power of auroral activity sites have a power law component within a finite scale range, suggestive of a scale-free nature in this finite-size system. This property is robust, prevailing with variations in the threshold used to define au-roral activity sites and in the strength of the external driver, namely, the solar wind. The statistical characteristics on the temporal evolution of auroral sites are then examined, which leads to a criterion that can be used to predict about 42 min in advance the total energy dissipation during the lifetime of an auroral activity site. The scale-free characteristics of auroral activity appears to be an intrinsic feature of the mag-netosphere based on a comparison of the probability density distribution in the total auroral brightness power with that of the solar wind power input parameters in the same period as the auroral observations. These results are consistent with the hypothesis of the magnetosphere behaving like an avalanch-ing system.
1 Introduction
The Earth’s magnetosphere is a voluminous, many-body space system with fascinating natural phenomena invigorat-ing our curiosity. It is often considered as a prototype system consisting of physical processes akin to those responsible for many astrophysical phenomena out of reach by in situ mea-surements.
A visible manifestation on the disturbance state of the Earth’s magnetosphere is the auroral displays seen in the po-lar regions. Explosive intensifications of auroral displays signify the occurrence of magnetospheric substorms
(Aka-Correspondence to: A. T. Y. Lui
sofu, 1964), which is a natural phenomenon involving dis-turbances throughout the Earth’s immediate space environ-ment (Akasofu, 1968). Research on this subject has now revealed that a proper understanding of magnetospheric ac-tivity, such as substorms, requires probing the tight coupling among many plasma regions in the magnetosphere and iono-sphere. Furthermore, a substantial number of space dis-turbances span over a wide range in temporal and spatial scales. These characteristics draw striking similarities with many complex systems in nature (Bak et al., 1987; Lui, 1991; Chang, 1992, 1999; Consolini et al., 1996; Consolini, 1997a,b; Chapman et al., 1998; Angelopolous et al., 1999; Klimas et al., 2000; Uritsky et al., 2002).
In this paper, we review briefly some findings from stud-ies testing the hypothesis of the magnetosphere being an avalanching system. These results were obtained through in-vestigations on auroral activity. An implicit assumption of these studies is that the energy release associated with mag-netospheric disturbances is represented well by the energy dissipated in auroral activity. A criterion formulated to pro-vide forecasting of auroral activity based on specific statisti-cal properties of auroral activity sites is also discussed. Af-ter these brief reviews of previously published results that are based on the author’s own involvement (Sects. 2 and 3), some new results are presented in Sect. 4 to shed light on the possibility of the scale-free characteristics in auroral activity being merely a result of the scale-free characteristics in the solar wind impinging on the magnetosphere. This question is addressed by examining both the solar wind and the auroral disturbances in the same time period with extreme statistics.
2 Dissipation power and auroral area
One approach to investigate the analogy between the mag-netosphere and an avalanche system is through the distribu-tion of auroral activity area and dissipadistribu-tion power (Lui et al., 2000). The essence and sample result of this approach are summarized in Fig. 1. The schematic in Fig. 1a illustrates
702 A. T. Y. Lui: Testing the hypothesis of the Earth’s magnetosphere (a) (b) 10-5 10-4 10-3 10-2 10-1 100 106 107 108 109 1010 (c)
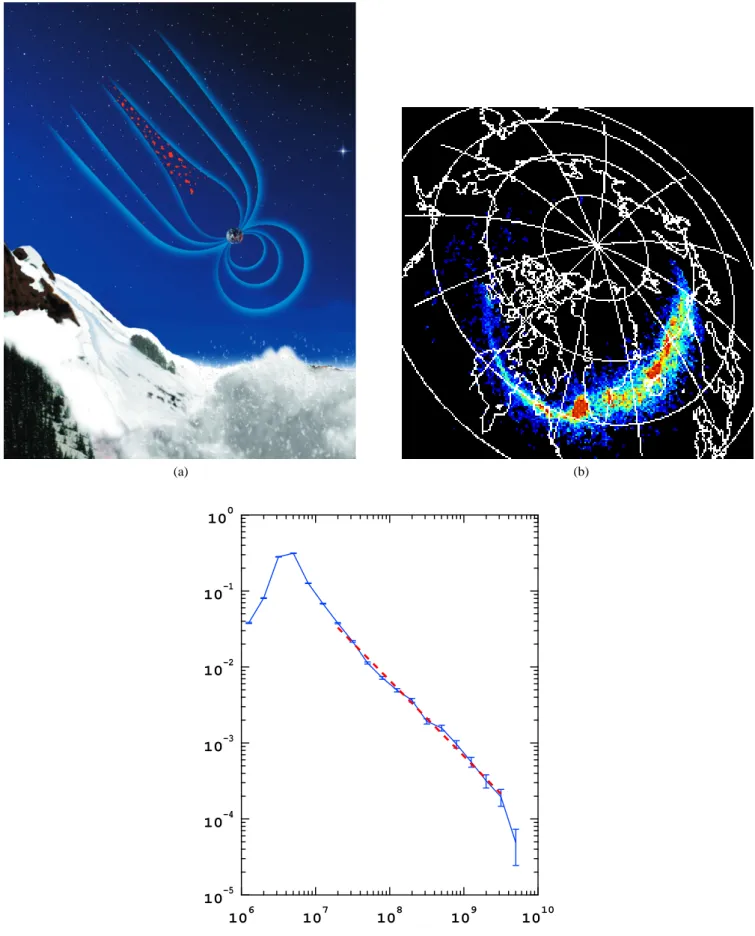
Fig. 1. Auroral power exhibits a scale-free probability density distribution similar to an avalanching system: (a) a schematic of a snow
avalanche and magnetotail activity sites responsible for observed auroral dissipation, (b) an example of a global auroral observation from Polar UVI, and (c) a representative distribution of auroral area showing a power law dependence suggestive of its scale-free nature.
this analogy. Localized magnetotail disturbances, which are perceived as the source for auroral activities, may trigger large scale magnetospheric disturbances such as substorms, much like snow avalanches may be triggered by small col-lapses of snow on a mountain. Figure 1b shows an example of a global auroral image from the Polar UVI instrument. Ge-ographic latitudes and longitudes as well as outline of land-masses are overlaid on the image. Lui et al. (2000) analyzed a month of these global auroral images. The analysis used an auroral intensity threshold significantly above the noise level (3.5 erg/cm2/s) to isolate individual auroral activity sites. For non-substorm intervals, the probability density distribution (PDF) or normalized histogram of the auroral dissipation power (and area also) of these sites was found to have a power law component within a sizeable range of scales. This result is illustrated in Fig. 1c. The normalized occurrence fre-quency, equivalent to PDF, is plotted as a function of the au-roral dissipation power in a log-log graph. A straight line for its slope in this plot implies the occurrence frequency having a power law dependence, i.e. scale-free, on the dissipation power of the activity site. This statistical property on the dis-sipation power and area of auroral activity sites is consistent with the hypothesis that the magnetosphere behaves like an avalanching system. For substorm intervals, there is an ad-ditional component in these distributions, exhibiting a peak at a characteristic scale. These are robust features since they are not affected by variation in the intensity threshold used for the identification of auroral activity sites or the strength of the solar wind energy input (external driver) (Lui, 2002). The observed power and area distributions seem to resemble the PDF of energy dissipation in sandpile avalanches (Chap-man et al., 1998). The conclusion reached based on these two previous studies was later supported by a more extensive analysis of auroral images by Uritsky et al. (2002). They combined the spatial and temporal variations of auroral ac-tivity sites to enlarge the range of scales under investigation and found the PDF to have a power law shape, revealing the scale-free nature of the phenomenon.
3 Forecast of auroral dissipation
In extending the previous investigations, Lui et al. (2003) tracked the time development of each activity site through the temporal sequence of auroral images. The following pro-cedure was used to identify the continuation of an auroral site in consecutive global auroral images. It is based on overlap-ping of the site location. If two or more activity sites merge, the site with the largest area is designated as the continuation of the combined site while the others are considered as being terminated. If a single site splits into two or more sites, the site with the largest area is designated as the continuation of the previous site and the others are assigned as new activity sites.
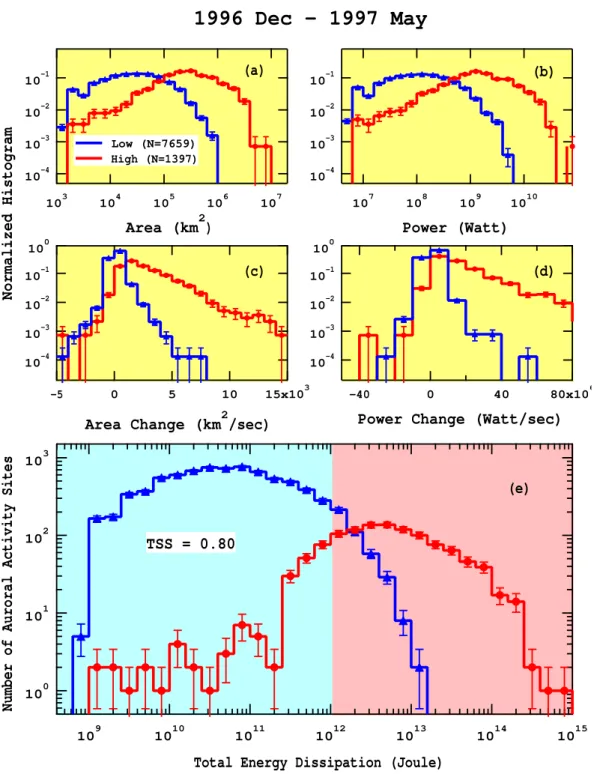
Figures 2a–d shows the statistical properties of four at-tributes of the auroral activity sites obtained by Lui et al. (2003). These attributes are the total area, instantaneous
dissipation power, the rate of change in area, and the rate of change in dissipation power. The data were sorted into two distributions based on the total energy dissipation using a level of 1 TJ as the boundary dividing the two regimes of low- and high-dissipation. For the six-month period carried out in the analysis, there are 7659 and 1397 activity sites for high- and low-dissipation, respectively. An examination of these results indicates that there are significant differences between these two populations. More specifically, in terms of area (Fig. 2a), low dissipation sites are found below 106km2, peaking in their PDF at 104.5km2, while the high dissipa-tion sites have the peak for their distribudissipa-tion at 105.5km2. A similar remarkable difference is seen in dissipation power (Fig. 2b). Low dissipation sites have dissipation powers be-low 109.8Watt, peaking in their distribution at 108.1Watt, while high dissipation sites have a peak in their distribution at 109.1Watt. In terms of area change (Fig. 2c), low dissipa-tion sites have mainly values within ±103km2/s while high dissipation sites have a larger spread, peaking at 1500 km2/s. The power changes for high- and low-dissipation sites show similar differences (Fig. 2d). These significant differences between high- and low-dissipation sites are not unique to the chosen dissipation threshold since they are also found with lower or higher total energy dissipation thresholds. The re-markable differences between the two populations for these four attributes provided the starting point for Lui et al. (2003) to develop a criterion to separate them.
A systematic search of levels imposed on these four at-tributes of an activity site led to a criterion suitable to dif-ferentiate the high- and low-dissipation sites at a given level of total energy dissipation. For example, the criterion for the prediction of a total energy dissipation of 1 TJ is that the auroral activity site satisfies at least one of the following conditions: area >106km2, power >109.2Watt, area change
>5000 km2/s, and power change >107Watt/s. These condi-tions are to be checked continuously as the auroral activity site evolves in time. The prediction result is given in Fig. 2e, sorting the distributions of low- and high-dissipation predic-tions in terms of the actual dissipation observed. The high-and low-dissipation domains are shaded with light pink high-and light blue backgrounds, respectively. The distributions for low and high dissipation sites are plotted with blue and red lines, respectively. There are 9056 activity sites in this study. The number of correct prediction for high dissipation is 918, correct prediction for low dissipation is 7574, incorrect pre-diction for high dissipation is 404, and incorrect prepre-diction for low dissipation is 160. These give the probabilities for correct high prediction and for correct low prediction to be 0.85 and 0.95, respectively. The false alarm ratio is 0.31. The true skill score for the above criterion is 0.80. Similar favorable results are obtained for prediction of 10 and 0.1 TJ (Lui et al., 2003). From the statistics on the lifetime of each auroral activity site and the time of prediction based on the criterion, it is found that the prediction generally is made on the averge of about 42 min in advance before the total en-ergy dissipation of an auroral site during its lifetime can be determined from observation.
704 A. T. Y. Lui: Testing the hypothesis of the Earth’s magnetosphere 10-4 10-3 10-2 10-1 103 104 105 106 107 Low (N=7659) High (N=1397) 10-4 10-3 10-2 10-1 107 108 109 1010
Normalized Histogram
(a)
(b)
10-4 10-3 10-2 10-1 100 15x103 10 5 0 -5 10-4 10-3 10-2 10-1 100 80x106 40 0 -40 100 101 102 103 109 1010 1011 1012 1013 1014 1015(c)
(e)
Area (km
2)
Power (Watt)
Area Change (km
2/sec)
Power Change (Watt/sec)
1996 Dec - 1997 May
Total Energy Dissipation (Joule)
Number of Auroral Activity Sites
TSS = 0.80
(d)
Fig. 2. Statistical results from analysis on the temporal evolution of auroral sites separated by the total energy dissipation threshold of 1 TJ:
distribution in (a) area, (b) power, (c) area change, (d) power change, and (e) the prediction of total energy dissipation during the lifetime of an auroral activity site versus the actual observed total energy dissipation.
4 Cause of scale-free property
The hypothesis of magnetosphere behaving like an avalanch-ing system is not universally accepted. For example, Watan-abe et al. (2000) examined the AL index and found that the number of occurrence versus the disturbance magnitude has a power law form only when the disturbance is below a certain threshold in magnitude. This is taken as supporting evidence
for the existence of a characteristic time scale for magne-tospheric disturbances. Another result casting doubt to the hypothesis is reported by Freeman et al. (2000). They noted that the power law PDFs of burst size and lifetime occur not only in self-organized criticality (SOC) but also in MHD tur-bulence. The power law feature in burst lifetime distributions actually demonstrates self-similarity or fractality, rather than distinguishes between the physical mechanisms that produce
it. They compared the burst lifetime PDFs of the solar wind power input parameters for the time period of 1995–1998 with those of the AU and AL indices for another time pe-riod of 1978–1988. A threshold at the median value of each data set was used in the analysis. More specifically, the solar wind power input parameters used in their study are vBs, where v is the solar wind speed and Bs is the southward component of the interplanetary magnetic field (IMF), and the episolon parameter (Perreault and Akasofu, 1978), which is given by v(By2+Bz2)sin4(θ/2), where By, Bzare the y-and z-components of the IMF, y-and θ is the polar angle of the IMF projected on the yz-plane. Their result shows that all these PDFs have power law components with nearly the same value of the power law index. They tentatively interpreted the result to indicate the solar wind turbulence driving directly the magnetospheric disturbance and the magnetosphere may not be an avalanching system.
A sensitive way to determine the causal relationship be-tween the scaling in the solar wind and that in the magneto-sphere is to examine the extreme values these parameters ex-hibit. If the scale-free characteristic of the magnetosphere is inherited from that of the solar wind, it is anticipated that the extreme values in the deviation from the mean value would have identical shapes in their PDFs. This procedure needs to examine both plasma media for the same period of time to be meaningful. In extreme statistics, two types of PDFs are often discussed. One is the Gumbel distribution, which describes the distribution for a global quantity x by
G(x)=k(ey−ey)a, with y=b(x−s),
where k, b, and s are determined by the zeroth, first, and second moments of G(x) (M0, M1, and M2) such that
M0=1, M1=0, and M2=1, and a ranges from 1 to 2 (Chap-man et al., 2002). The other one is the Frechet distribution with the form similar to Gumbel, i.e.
F (x)=k(ey−ey)a, with y=s+bln(1+x/c(q)),
where c(q) is a characteristic value of x and the normalized source PDF N (x) has the form
N (x)=N0/(1+x2)q,
where N0 is a constant. Several investigations have
in-dicated that these distributions may represent a universal non-Gaussian fluctuation PDF in highly correlated systems (Bramwell et al., 1998, 2000; Pinton et al., 1999; Zheng and Trimper, 2001).
This new study involves a statistical compilation of the to-tal auroral brightness power over the entire auroral region based on Polar UVI images. No intensity threshold is needed to isolate individual auroral activity sites and no tracking of temporal development of the auroral brightness power over the entire auroral region is needed. An implicit assumption here is that the total auroral brightness power at any moment in time is dominated by the auroral power of the largest ac-tivity site. Global auroral images in the six-month period of December 1996–May 1997 were analyzed in this manner.
10-4 10-3 10-2 10-1 100 8 6 4 2 0 -2 10-4 10-3 10-2 10-1 100 8 6 4 2 0 -2 (X - <X>)/σ
Solar Wind VBs Parameter
P(x)
σ
P(x)
σ
Solar Wind Episolon Parameter
10-4 10-3 10-2 10-1 100 8 6 4 2 0 -2 frechet 2.5 Gumble π/2 P(x) σ
Total Auroral Brightness Power
(a)
(b)
(c)
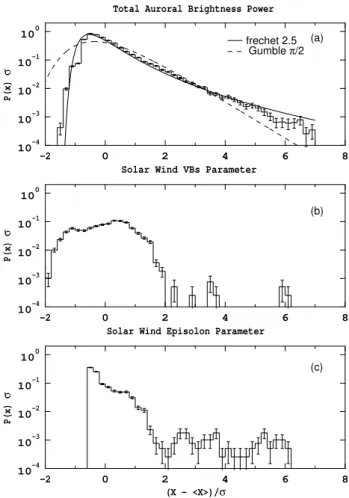
Fig. 3. The normalized distribution weighted by the variance of its
dependent variable for (a) the total global auroral brightness at an instant in time, (b) the solar wind power input parameter vBs, and
(c) the solar wind power input parameter episolon.
The solar wind parameters for the corresponding time pe-riod were obtained by IMP-8. Two parameters representing the input power from the solar wind to the magnetosphere are vBs and episolon, as discussed earlier. These parame-ters were constructed from IMP-8 solar wind data at a time resolution of 1 min.
Figure 3a shows the PDF, weighted by the variance of its dependent variable, of the total auroral brightness power for the six-month period in this study. This distribution seems to be fitted well by the Frechet distribution with q=2.5, but not by the Gumbel distribution, which is shown in the figure by the dashed curve for a=π/2 as a reference. On the other hand, the PDFs of both the solar wind vBs and episolon pa-rameters given in Figs. 3b and 3c show very distinct shapes. Crudely speaking, the PDF of the solar wind vBs parame-ter resembles closer to the Gumble distribution than to the Frechet distribution, while that of the solar wind episolon parameter resembles closer to the Frechet distribution than to the Gumble distribution. However, there are large discrep-ancies of the observed PDFs from these theoretical distribu-tions in the mid-range values of (X−<X>)/σ =2−5 that the observed PDFs are more accurately judged to be quite
differ-706 A. T. Y. Lui: Testing the hypothesis of the Earth’s magnetosphere ent from either the Gumbel distribution or the Frechet
distri-bution. This result suggests that the scale-free nature in the magnetosphere is not a direct result of the scale-free charac-teristics of the solar wind.
5 Summary and conclusion
We have presented a brief review of attempts to test the hy-pothesis of the magnetosphere behaving like an avalanching system by using global auroral dissipation as a proxy for magnetospheric dissipation. The distributions in area and power of auroral activity sites are found to exhibit a power law component suggestive of a scale-free nature. This prop-erty appears to be quite robust as it is preserved under differ-ent levels of threshold used in the determination of auroral activity sites above the background luminosity as well as un-der different strength of the external driver. The second study reviewed here involves using the statistical characteristics of these auroral activity sites to develop a criterion to forecast the total auroral energy dissipation during the lifetime of an auroral activity site. The derived criterion appears to be quite accurate with a true skill score of 0.80. The third study pre-sented here tackles the question whether or not the scale-free nature in magnetospheric disturbances is a direct result of the scale-free characteristics of the solar wind power input. This involves extreme statistics in comparing the probability density distribution of the total auroral brightness power over the entire polar region with that of the solar wind power in-put parameters, namely, the vBsand the episolon parameters. The dissimilarity of these distributions favors the suggestion that the scale-free characteristics of the magnetospheric dis-turbances are intrinsic and not being imposed or transmitted by the external driver.
The above results are consistent with the idea that the mag-netosphere is a forced and/or self organized critical system as theorized by a number of researchers (Chang, 1992, 1999; Consolini et al., 1996; Consolini, 1997a, b; Chapman et al., 1998; Angelopolous et al., 1999; Klimas et al., 2000; Urit-sky et al., 2002). However, magnetospheric disturbances can be equally considered as phase transitions for an out-of-equilibrium system, as discussed by several researchers (Consolini and Lui, 2000; Sitnov et al., 2000, 2001).
Acknowledgement. This work is supported by the Atmospheric
Sciences Division of the NSF Grant ATM-0135667 and by the NASA Grant NNG04G128G to The Johns Hopkins University Applied Physics Laboratory.
Edited by: A. Chian Reviewed by: two referees
References
Akasofu, S.-I.: The development of the auroral substorm, Planet. Space Sci., 12, 273–282, 1964.
Akasofu, S.-I.: Polar and Magnetospheric Substorms, D. Reidel, Norwell, Mass., USA, 1968.
Angelopoulos, V., Mukia, T., and Kokubun, S.: Evidence for in-termittency in Earth’s plasma sheet and implications for self-organized criticality, Phys. Plasmas, 6, 11, 4161–4168, 1999. Bak, P., Tang, C., and Wiesenfeld, K.: Self-organized criticality:
An explanation of 1/f noise, Phys. Rev. Lett., 59, 381–384, 1987. Bramwell, S. T., Holdsworth, P. C. W., and Pinton, J. F.: Univer-sality of rare fluctuations in turbulence and critical phenomena, Nature, 396, 552, 1998.
Bramwell, S. T., Christensen, K., Fortin, J. Y., Holdsworth, P. C. W., Jensen, H. J., Lise, S., Lopez, J. M., Nicodemi, M., Pinton, J.-F., and Sellitto, M.: Universal fluctuations in correlated systems, Phys. Rev. Lett., 84, 3744–3747, 2000.
Chang, T.: Low dimensional behavior and symmetry breaking of stochastic systems near criticality – can these effects be observed in space and in the laboratory?, EEE Trans. Plasma Sci., 20, 691– 694, 1992.
Chang, T.: Self-organized criticality, multi-fractal spectra, sporadic localized reconnections and intermittent turbulence in the mag-netotail, Physics of Plasmas, 6, 4137–4145, 1999.
Chapman, S. C., Watkins, N. W., Dendy, R. O., Helander, P., and Rowlands, G.: A simple avalanche model as an analogue for magnetospheric activity, Geophys. Res. Lett., 25, 2397–2400, 1998.
Chapman, S. C., Rowlands, G., and Watkins, N. W.:Extreme statis-tics: a framework for data analysis, Nonl. Proc. Geophys., 9, 409–418, 2002.
Consolini, G.: Intermittency and turbulence in magnetospheric dy-namics, Proceedings of the International School of Physics “En-rico Fermi”, edited by Mallamace, F. and Stanley, H. E., IOS Press, Amsterdam, 657, 1997a.
Consolini, G.: Sandpile cellular automata and magnetospheric dy-namics, In: Proceedings of Cosmic Phyiscs in the year 2000, edited by Aiello et al., SIF, Bologna, Italy, 58, 1997b.
Consolini, G. and Lui, A. T. Y.: Symmetry breaking and nonlinear wave-wave interaction in current disruption: Possible evidence for a dynamical phase transition, Magnetospheric Current Sys-tems, edited by Ohtani, S.-I., Fujii, R., Hesse, M., and Lysak, R. L., AGU Geophysical Monograph 118, AGU, Washington, DC, 395–401, 2000.
Consolini, G., Marcucci, M. F., and Candidi, M.: Multifractal struc-ture of auroral electrojet index data, Phys. Rev. Lett., 76, 21, 4082–4085, 1996.
Freeman, M. P., Watkins, N. W., and Riley, D. J.: Evidence for a solar wind origin of the power law burst lifetime distribution of the AE indices, Geophys. Res. Lett., 27, 1087–1090, 2000. Klimas, A. J., Valdivia, J. A., Vassiliadis, D., Baker, D. N., Hesse,
M., and Takalo, J.: Self-organized criticality in the substorm phe-nomenon and its relation to localized reconnection in the magne-tospheric plasma sheet, J. Geophys. Res., 105, 18 765–18 780, 2000.
Lui, A. T. Y.: Plasma transport in the Earth’s magnetotail, Modeling Magnetospheric Plasma Processes, edited by Wilson, G. R., 41– 53, 1991.
Lui, A. T. Y.: Evaluation on the analogy between the dynamic mag-netosphere and a forced and/or self organized critical system, Nonl. Proc. Geophys., 9, 399–407, 2002.
Lui, A. T. Y., Chapman, S. C., Liou, K., Newell, P. T., Meng, C.-I., Brittnacher, M., and Parks, G. K.: Is the dynamic magnetosphere an avalanching system?, Geophys. Res. Lett., 27, 911–914, 2000. Lui, A. T. Y., Lai, W. W., Liou, K., and Meng, C. I.: A new tech-nique for short-term forecast of auroral activity, Geophys. Res. Lett., 30 5, 1258, doi:10.1029/2002GL016505, 2003.
Perreault, P. and Akasofu, S.-I.: A study of geomagnetic storms, Geophys. J. R. Astron. Soc., 54, 547–573, 1978.
Pinto, J. F., Holdsworth, P., and Labbe, R.: Power fluctuations in a closed turbulent shear flow, Phys. Rev. E, 60, R2452–R2455, 1999.
Sitnov, M. I., Sharma, A. S., Papadopoulos, K., Vassiliadis, D., Val-divia, J. A., Klimas, A. J., and Baker, D. N.: Phase transition-like behavior of the magnetosphere during substorms, J. Geophys. Res., 105, 12 955–12 974, 2000.
Sitnov, M. I., Sharma, A. S., Papadopoulos, K., and Vassiliadis, D.: Modeling substorm dynamics of the magnetosphere: From self-organization and self-organized criticality to nonequilibrium phase transitions, Phys. Rev. E, 65, 016116, 2001.
Uritsky, V. M., Klimas, A. J., Vassiliadis, D., Chua, D., and Parks, G.: Scale-free statistics of spatiotemproal auroral emissions as depicted by Polar UVI images: The dynamic magnetosphere is an avalanching system, J. Geophys. Res., 107, A12, SMP 7-1, 1426, doi:10.1029/2001JA000281, 2002.
Watanabe, Y., Shirai, H., and Kamide, Y.: Statistical study of geo-magnetic disturbances: Power-law and the SOC model, The First S-RAMP Conference Abstracts, Sapporo, Japan, 2–6 October, 237, 2000.
Zheng, B. and Trimper, S.: Comment on “Universal fluctuations in correlated systems”, Phys. Rev. Lett., 87, 18, 8901, 2001.