HAL Id: hal-00296072
https://hal.archives-ouvertes.fr/hal-00296072
Submitted on 3 Nov 2006
HAL is a multi-disciplinary open access
archive for the deposit and dissemination of
sci-entific research documents, whether they are
pub-lished or not. The documents may come from
teaching and research institutions in France or
abroad, or from public or private research centers.
L’archive ouverte pluridisciplinaire HAL, est
destinée au dépôt et à la diffusion de documents
scientifiques de niveau recherche, publiés ou non,
émanant des établissements d’enseignement et de
recherche français ou étrangers, des laboratoires
publics ou privés.
Changes in background aerosol composition in Finland
during polluted and clean periods studied by TEM/EDX
individual particle analysis
J. V. Niemi, S. Saarikoski, H. Tervahattu, T. Mäkelä, R. Hillamo, H.
Vehkamäki, L. Sogacheva, M. Kulmala
To cite this version:
J. V. Niemi, S. Saarikoski, H. Tervahattu, T. Mäkelä, R. Hillamo, et al.. Changes in background
aerosol composition in Finland during polluted and clean periods studied by TEM/EDX individual
particle analysis. Atmospheric Chemistry and Physics, European Geosciences Union, 2006, 6 (12),
pp.5049-5066. �hal-00296072�
© Author(s) 2006. This work is licensed under a Creative Commons License.
Chemistry
and Physics
Changes in background aerosol composition in Finland during
polluted and clean periods studied by TEM/EDX individual
particle analysis
J. V. Niemi1, S. Saarikoski2, H. Tervahattu3, T. M¨akel¨a2, R. Hillamo2, H. Vehkam¨aki4, L. Sogacheva4, and M. Kulmala4
1Department of Biological and Environmental Sciences, University of Helsinki, P.O. Box 27, FI-00014 Helsinki, Finland 2Finnish Meteorological Institute, P.O. Box 503, FI-00101 Helsinki, Finland
3Nordic Envicon Ltd., Koetilantie 3, FI-00790 Helsinki, Finland
4Department of Physical Sciences, University of Helsinki, P.O. Box 64, FI-00014 Helsinki, Finland Received: 6 June 2006 – Published in Atmos. Chem. Phys. Discuss.: 19 July 2006
Revised: 24 October 2006 – Accepted: 25 October 2006 – Published: 3 November 2006
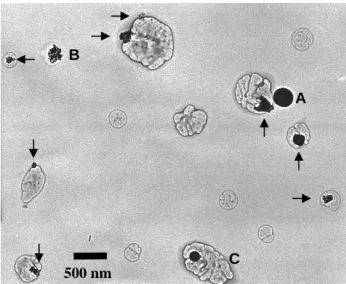
Abstract. Aerosol samples were collected at a ru-ral background site in southern Finland in May 2004 during pollution episode (PM1∼16 µg m−3, backward air mass trajectories from south-east), intermediate period (PM1∼5 µg m−3, backtrajectories from north-east) and clean period (PM1∼2 µg m−3, backtrajectories from north-west/north). The elemental composition, morphology and mixing state of individual aerosol particles in three size frac-tions were studied using transmission electron microscopy (TEM) coupled with energy dispersive X-ray (EDX) micro-analyses. The TEM/EDX results were complemented with the size-segregated bulk chemical measurements of selected ions and organic and elemental carbon. Many of the particles in PM0.2−1 and PM1−3.3 size fractions were strongly inter-nally mixed with S, C and/or N. The major particle types in PM0.2−1samples were 1) soot and 2) (ammonium)sulphates and their mixtures with variable amounts of C, K, soot and/or other inclusions. Number proportions of those two particle groups in PM0.2−1 samples were 0–12% and 83–97%, re-spectively. During the pollution episode, the proportion of Ca-rich particles was very high (26–48%) in the PM1−3.3 and PM3.3−11samples, while the PM0.2−1and PM1−3.3 sam-ples contained elevated proportions of silicates (22–33%), metal oxides/hydroxides (1–9%) and tar balls (1–4%). These aerosols originated mainly from polluted areas of Eastern Europe, and some open biomass burning smoke was also brought by long-range transport. During the clean period, when air masses arrived from the Arctic Ocean, PM1−3.3 samples contained mainly sea salt particles (67–89%) with a variable rate of Cl substitution (mainly by NO−3). Dur-ing the intermediate period, the PM1−3.3 sample contained
Correspondence to: J. V. Niemi
porous (sponge-like) Na-rich particles (35%) with abundant S, K and O. They might originate from the burning of wood pulp wastes of paper industry. The proportion of biologi-cal particles and C-rich fragments (probably also biologibiologi-cal origin) were highest in the PM3.3−11 samples (0–81% and 0–22%, respectively). The origin of different particle types and the effect of aging processes on particle composition and their hygroscopic and optical properties are discussed.
1 Introduction
The composition and mass concentrations of fine aerosol par-ticles (PM2.5)in clean background areas are strongly affected by long-range transport. During transport and aging, parti-cles of different origin may change their properties due to co-agulation and cloud processes as well as due to reactions with gases via various heterogeneous pathways. Thus, differences in sources and in meteorological conditions may strongly af-fect composition, mixing state, concentration and size of dif-ferent particle types observed. These are essential factors related to the environmental and health impacts of aerosols, such as climate change and transport of nutrients, acids and toxic compounds (EMEP, 2001; IPCC, 2001; WHO, 2003; Chung and Seinfeld, 2005; Kanakidou et al., 2005; Sun and Ariya, 2006).
In Finland, anthropogenic emissions of particles and their precursor gases are low (EMEP, 2001, 2002), and most of the PM2.5mass originates from long-range transport (Pakkanen et al., 2001; Vallius et al., 2003; Karppinen et al., 2004). In general, PM2.5 concentrations are also low, the annual mean PM2.5concentration being only 5.8 µg m−3at the rural sta-tion of Hyyti¨al¨a in southern Finland (Laakso et al., 2003).
However, the particle concentration and composition vary strongly depending on meteorological conditions and aerosol source regions. High particle mass concentrations are ob-served when air masses arrive from polluted continental areas of Central and Eastern Europe, and low concentrations when air masses originate from the direction of the Atlantic and Arctic Oceans (Pakkanen et al., 2001; Ricard et al., 2002; Ruoho-Airola et al., 2004; Sogacheva et al., 2005; Tunved et al., 2005). Thus, clean background areas in Finland are especially favourable for investigation of the properties of aged, long-range transported aerosols with clearly different origins.
The composition of aerosol particles has been studied mostly with bulk chemical methods. Only a few studies on background aerosols in continental Europe have been per-formed using individual particle methods (Ebert et al., 2002, 2004; Held et al., 2002; Hinz et al., 2005), and these stud-ies are especially sparse for Northern Europe (Bigg, 2001; Tervahattu et al., 2005). Individual particle methods provide information on chemical composition, sources, morphology and mixing state of particles, which cannot be observed with bulk chemical methods.
We examined the composition, morphology and mixing state of individual aerosol particles with the TEM/EDX method at a rural background site in southern Finland during polluted, intermediate and clean periods with different ori-gins of particles. We describe major particle types observed in three size fractions (PM0.2−1, PM1−3.3 and PM3.3−11) and investigate changes in their abundances, composition, mixing state and sources during different periods. To our knowledge, this is the first TEM/EDX study on background aerosols in continental Northern Europe. The results are compared with bulk chemical measurements performed dur-ing the same field campaign and also with individual particle studies for background aerosols conducted by other research groups. Furthermore, the effect of aging processes on par-ticle composition and their hygroscopic and light absorption properties are discussed.
2 Materials and methods 2.1 Aerosol sampling
Aerosol samples were collected at the SMEAR II station (61.85 N, 24.28 E, 181 m a.s.l.) in Hyyti¨al¨a between 6 and 24 May 2004. The field station, located in a boreal pine for-est, represents a clean background area in southern Finland (details in Kulmala et al., 2001).
Particle samples for bulk chemical analysis were collected with two identical virtual impactors (VIs) in parallel; one was used to collect samples for mass and ion analysis and the other for carbon analysis (Saarikoski et al., 2005). The VIs were modified versions of the original design of Loo and Cork (1988). They divide airborne particle matter into
22
17
10
7
6 20
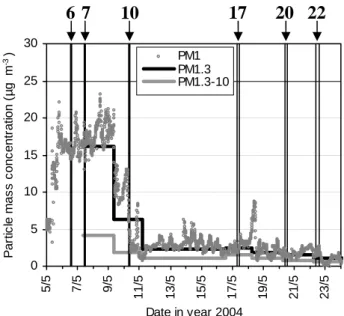
0 5 10 15 20 25 30 5/5 7/5 9/5 11/5 13/5 /515 17/5 19/5 21/5 23/5 Date in year 2004 P a rt ic le m a s s c o nc en tr at io n ( µ g m -3 ) PM1 PM1.3 PM1.3-10Fig. 1. Particle mass concentrations (PM1measured with ELPI, and
PM1.3 and PM1.3−10with VI) in Hyyti¨al¨a in May 2004. The six
sampling periods with the Battelle impactor for TEM/EDX analysis are marked with vertical lines and arrows (sample numbers above).
two size fractions: PM1.3 and PM1.3−10. Collection sub-strates for mass and ion analysis were Teflon filters (diame-ter 47 mm, pore size 3.0 µm, Millipore Fluoropore, Ireland), and for carbon analysis quartz fibre filters (diameter 47 mm, Whatman QMA). In VI sampling for carbon analysis, de-nuders and back-up filters were used to minimize sampling artefacts. Sampling time was two days.
Particle samples for TEM/EDX individual particle anal-ysis were collected with a Battelle-type impactor (model I-1, PIXE International Corporation, Florida, USA), which is a modified version of the original design of Mitchell and Pilcher (1959). Cu TEM grids (400-mesh) with carbon-coated Formvar films (Carbon Type-B, Ted Pella Inc., Red-ding, CA, USA) were placed on three impaction stages to collect particles in diameter ranges (cut-off sizes, D50) of 0.2–1.0, 1.0–3.3 and 3.3–11 µm. The flow rate was 1 L/min. Sample collection times were 1-6 hours, depending on the particle concentrations during sampling. The TEM grids of six sampling periods (6 periods and 3 size fractions, total 18 TEM grids) were used for TEM/EDX analysis.
2.2 Bulk chemical analysis
VI samples were analysed chemically for elemental carbon (EC), organic carbon (OC), water-soluble ions and the sum of three monosaccharide anhydrides (PMA = levoglucosan
+ galactosan + mannosan). EC and OC were measured
with the thermal-optical carbon analyser (Sunset Laboratory Inc., Oregon, USA). Ion analysis was performed using two Dionex-500 ion chromatography systems, and the ions
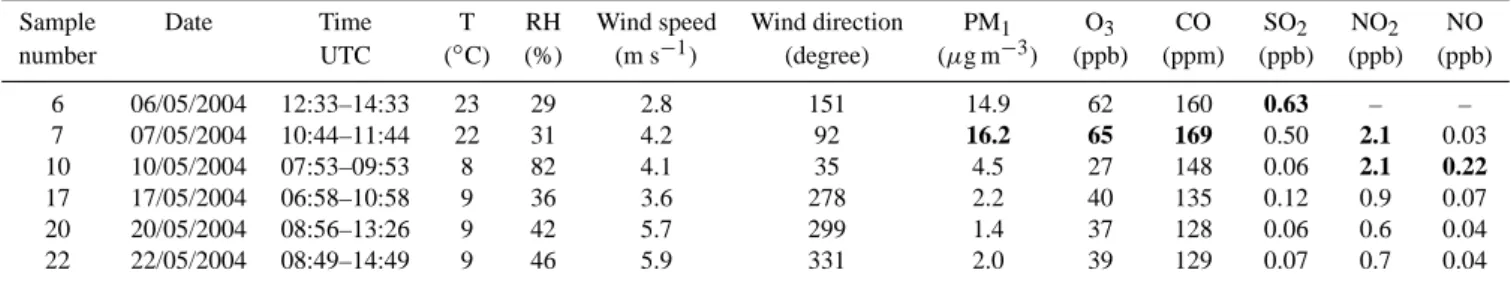
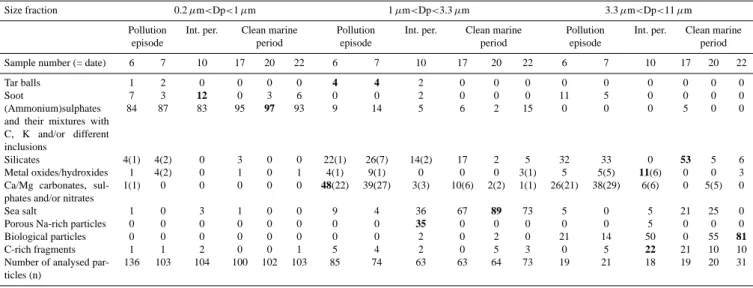
anal-Table 1. Arithmetic means of meteorological variables, PM1 mass concentrations and gas concentrations during sampling periods for
TEM/EDX analysis (maximums shown in bold).
Sample Date Time T RH Wind speed Wind direction PM1 O3 CO SO2 NO2 NO
number UTC (◦C) (%) (m s−1) (degree) (µg m−3) (ppb) (ppm) (ppb) (ppb) (ppb)
6 06/05/2004 12:33–14:33 23 29 2.8 151 14.9 62 160 0.63 – – 7 07/05/2004 10:44–11:44 22 31 4.2 92 16.2 65 169 0.50 2.1 0.03 10 10/05/2004 07:53–09:53 8 82 4.1 35 4.5 27 148 0.06 2.1 0.22 17 17/05/2004 06:58–10:58 9 36 3.6 278 2.2 40 135 0.12 0.9 0.07 20 20/05/2004 08:56–13:26 9 42 5.7 299 1.4 37 128 0.06 0.6 0.04 22 22/05/2004 08:49–14:49 9 46 5.9 331 2.0 39 129 0.07 0.7 0.04
ysed were NO−3, SO2−4 , Cl−, methanesulphonate (MSA), ox-alate, succinate, malonate, Na+, NH+4, K+, Mg2+and Ca2+. The details of ion and carbon analysis, and also the weighting of VI samples to calculate particle mass concentrations, are described in Saarikoski et al. (2005).PMA was determined
by using a liquid chromatograph mass spectrometer (LC/MS; Agilent 1100 Series, Trap SL, Agilent Technologies, USA), and the analysis method is described in detail by Sillanp¨a¨a et al. (2005).
2.3 TEM/EDX individual particle analyses
The morphology and elemental composition of individual aerosol particles were investigated using a Tecnai 12 trans-mission electron microscope (TEM) equipped with an EDAX energy dispersive X-ray (EDX) microanalyser. The TEM was operated on an accelerating voltage of 120 kV and with a low beam current to minimize beam damage. Counting time for X-ray spectra was 20 live seconds. The minimum size of particles analyzed was 0.2 µm (geometric diameter).
The elements analysed were with Z from C to Pb, ex-cluding N. The X-ray counts from carbon-Formvar coating (thickness listed as ∼60 nm; contains abundant C, some O and minor Si) of TEM grids were estimated by analysing blank areas between particles. The net X-ray counts (= to-tal counts – carbon-Formvar blank counts) of elements for each particle analysed were calculated, and their proportions were normalized to 100%. Although the elemental results were semiquantitative, the accuracy is sufficient to identify different particle types and to compare the differences in el-emental ratios of the same particle type in different samples (P´osfai et al., 2003; Ebert et al., 2004; Niemi et al., 2005b; Ro et al., 2005; Laskin et al., 2006). The strong vacuum (∼10−7torr) and beam exposure causes evaporation of semi-volatile compounds from particles, and for that reason, water, ammonium nitrate and organic compounds with high vapour pressure were lost, as is typical in electron microscopy.
2.4 Air quality and meteorological data
Temperature, relative humidity (RH), wind speed, wind di-rection and concentrations of gaseous components (O3, CO, SO2, NO2and NO) are recorded continuously at the SMEAR II station. Particle number concentrations and size distribu-tions (from 29 nm to 10 µm) were monitored continuously during the field campaign (time resolution 1 s, averaged to 10 min) with Electrical Low Pressure Impactor (Outdoor Air ELPI, Dekati Ltd, Tampere, Finland), and these results were used to calculate PM1 mass concentrations (equations de-scribed in Saarikoski et al., 2005). Backward air mass trajec-tories were produced using the HYbrid Single-Particle La-grangian Integrated Trajectory (HYSPLIT4) model (Draxler and Rolph, 2003) with the Final Analyses (FNL) meteorolog-ical database at the NOAA Air Resources Laboratory’s web server (Rolph, 2003). The Navy Aerosol Analysis and Pre-diction System (NAAPS) model results were used to deter-mine the distribution of smoke aerosols from open biomass burning (http://www.nrlmry.navy.mil/aerosol/; the Naval Re-search Laboratory, Monterey, CA, USA).
3 Results and discussion
3.1 Air quality and meteorology during sampling periods The particle mass concentrations were high at the beginning of the field campaign, and the first two samples (6 and 7) for TEM/EDX analysis were collected during that pollution episode (Fig. 1 and Table 1). The hourly PM1mass reached 22 µg m−3during the episode, which is 5 times higher than the mean spring-time PM1concentration in Hyyti¨al¨a (Laakso et al., 2003). During the episode, most of the PM10 mass was in the PM1.3 size fraction (∼80%), which is a slightly higher proportion than in the rest of the field campaign (∼60– 70%). The concentrations of gaseous pollutants were also unusually high (Table 1). The maximum value (90 ppb) of O3 concentration in 2004 was also observed during this episode. Elevated particle mass and O3concentrations were observed
Russia
6
Atlantic Ocean Norway Sweden Belarus Ukraine7
10
Hyytiälä St. Petersburg Narva17
20
22
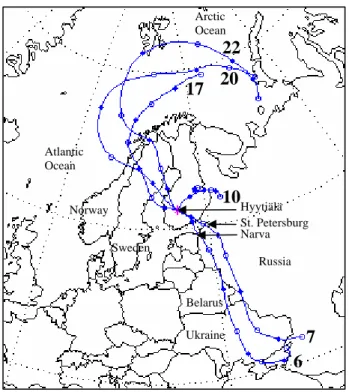
Arctic OceanFig. 2. Backward air mass trajectories arriving at 250 m level to
Hyyti¨al¨a during the six sampling periods in May 2004. Date num-bers (=sample numnum-bers) of each trajectory are shown, and symbols represent 12-h intervals (total time 96 h).
over larger areas in Finland between 4 and 9 May due to long-range transport of pollutants.
The backward trajectories show that during the pollution episode the continental air masses arrived from the direction of south-western Russia, Belarus and Ukraine (Fig. 2), which belong to typical source regions (polluted areas of Eastern and Central Europe) for aerosol particle episodes observed in Finland (Niemi et al., 2004, 2005a; Tervahattu et al., 2004; Sogacheva et al., 2005). During the episode, the weather was exceptionally warm (over +20◦C, Table 1) compared with the mean temperature for May (+9◦C in that region in 1971– 2001; Finnish Meteorological Institute). Only a few small showers occurred during the whole field campaign. The sam-ples for TEM/EDX analysis were collected during the peri-ods when there was no rain.
Sample 10 was collected just after or at the end of the pol-lution episode, and during that intermediate period (between the pollution episode and the clean period) the PM1 concen-tration was 4.5 µg m−3(Fig. 1 and Table 1). The short back-ward trajectory of air masses originated from the north-east and curved towards the Arctic Ocean (Fig. 2). The last three samples (nos. 17–22) were collected during the clean period, when both PM1mass (1.4–2.2 µg m−3)and gaseous compo-nent concentrations were very low. Air masses arrived in Fin-land from the Arctic Ocean, passing over Norway and Swe-den, which is a typical source sector for low particle mass
Fig. 3. NAAPS model results showing surface smoke
concentra-tions in Europe at 12:00 (UTC) on 6 May 2004 (Naval Research Laboratory, Monterey, CA, USA, website at http://www.nrlmry. navy.mil/aerosol/).
concentrations (Sogacheva et al., 2005) due to minor anthro-pogenic emissions.
3.2 Bulk chemical concentrations
The PM1.3 and PM1.3−10 concentrations for particle mass,
ions, PMA, EC and OC are shown in Table 2. The
re-sults of bulk chemical analysis are not completely compara-ble with TEM/EDX results because of strong differences in the lengths of sampling periods (see difference in sampling periods with Battelle impactor for TEM/EDX and with VI for bulk chemical analysis in Fig. 1). However, the bulk chemi-cal results give a good overview of particle composition dur-ing the sampldur-ing periods, with clearly different aerosol ori-gins being apparent.
Most of the chemical components reached their maximum concentrations during the pollution episode (Table 2). Dur-ing the clean period, the concentrations of Na+, Cl−, Mg2+ and MSA were elevated, which confirms the marine ori-gin of the air mass. The concentrations of most chemical components were much higher in PM1.3 samples than in PM1.3−10samples. However, NO−3, Cl
−, Na+ (not during pollution episode), Mg2+and Ca2+were mostly present in the PM1.3−10size fraction.
The main components in all PM1.3 samples were OC, SO2−4 , NH+4 and EC, their total proportions in the PM1.3 mass being 73–83% (Table 2). The unidentified fraction was also quite high (20.0–25.5%), and its major components were probably unanalysed elements related to OC (especially
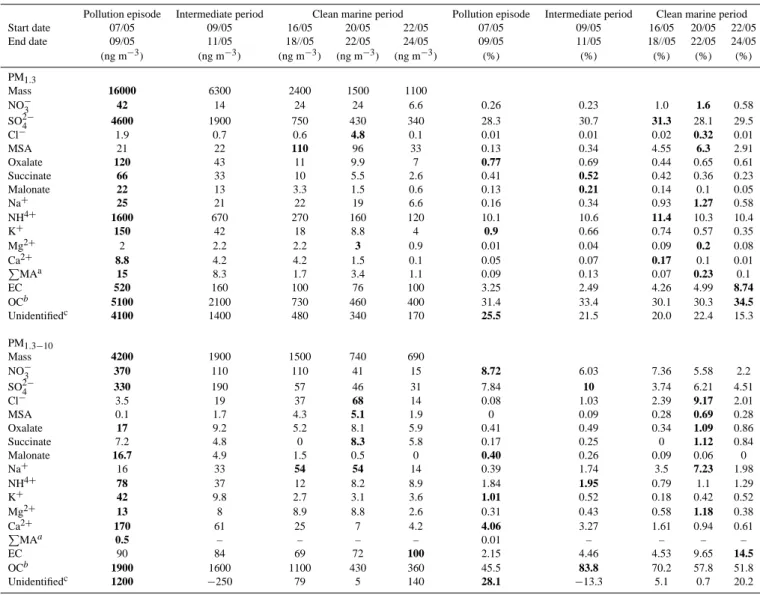
Table 2. Mass concentrations of total particle mass, ions, OC and EC in PM1.3 and PM1.3−10size fractions during different sampling
periods, and their relative proportions (%) of total particle mass. Maximum values of each component in both size fractions are shown in bold.
Pollution episode Intermediate period Clean marine period Pollution episode Intermediate period Clean marine period
Start date 07/05 09/05 16/05 20/05 22/05 07/05 09/05 16/05 20/05 22/05 End date 09/05 11/05 18//05 22/05 24/05 09/05 11/05 18//05 22/05 24/05 (ng m−3) (ng m−3) (ng m−3) (ng m−3) (ng m−3) (%) (%) (%) (%) (%) PM1.3 Mass 16000 6300 2400 1500 1100 NO−3 42 14 24 24 6.6 0.26 0.23 1.0 1.6 0.58 SO2−4 4600 1900 750 430 340 28.3 30.7 31.3 28.1 29.5 Cl− 1.9 0.7 0.6 4.8 0.1 0.01 0.01 0.02 0.32 0.01 MSA 21 22 110 96 33 0.13 0.34 4.55 6.3 2.91 Oxalate 120 43 11 9.9 7 0.77 0.69 0.44 0.65 0.61 Succinate 66 33 10 5.5 2.6 0.41 0.52 0.42 0.36 0.23 Malonate 22 13 3.3 1.5 0.6 0.13 0.21 0.14 0.1 0.05 Na+ 25 21 22 19 6.6 0.16 0.34 0.93 1.27 0.58 NH4+ 1600 670 270 160 120 10.1 10.6 11.4 10.3 10.4 K+ 150 42 18 8.8 4 0.9 0.66 0.74 0.57 0.35 Mg2+ 2 2.2 2.2 3 0.9 0.01 0.04 0.09 0.2 0.08 Ca2+ 8.8 4.2 4.2 1.5 0.1 0.05 0.07 0.17 0.1 0.01 PMAa 15 8.3 1.7 3.4 1.1 0.09 0.13 0.07 0.23 0.1 EC 520 160 100 76 100 3.25 2.49 4.26 4.99 8.74 OCb 5100 2100 730 460 400 31.4 33.4 30.1 30.3 34.5 Unidentifiedc 4100 1400 480 340 170 25.5 21.5 20.0 22.4 15.3 PM1.3−10 Mass 4200 1900 1500 740 690 NO−3 370 110 110 41 15 8.72 6.03 7.36 5.58 2.2 SO2−4 330 190 57 46 31 7.84 10 3.74 6.21 4.51 Cl− 3.5 19 37 68 14 0.08 1.03 2.39 9.17 2.01 MSA 0.1 1.7 4.3 5.1 1.9 0 0.09 0.28 0.69 0.28 Oxalate 17 9.2 5.2 8.1 5.9 0.41 0.49 0.34 1.09 0.86 Succinate 7.2 4.8 0 8.3 5.8 0.17 0.25 0 1.12 0.84 Malonate 16.7 4.9 1.5 0.5 0 0.40 0.26 0.09 0.06 0 Na+ 16 33 54 54 14 0.39 1.74 3.5 7.23 1.98 NH4+ 78 37 12 8.2 8.9 1.84 1.95 0.79 1.1 1.29 K+ 42 9.8 2.7 3.1 3.6 1.01 0.52 0.18 0.42 0.52 Mg2+ 13 8 8.9 8.8 2.6 0.31 0.43 0.58 1.18 0.38 Ca2+ 170 61 25 7 4.2 4.06 3.27 1.61 0.94 0.61 PMAa 0.5 – – – – 0.01 – – – – EC 90 84 69 72 100 2.15 4.46 4.53 9.65 14.5 OCb 1900 1600 1100 430 360 45.5 83.8 70.2 57.8 51.8 Unidentifiedc 1200 −250 79 5 140 28.1 −13.3 5.1 0.7 20.2
aPMA = levoglucosan + galactosan + mannosan bOC = organic carbon + carbonate carbon cUnidentified = particle mass – (NO−
3 + SO 2− 4 + Cl
−+ Na++ NH4++ K++ Mg2++ Ca2++ EC + OC). The one negative value probably
results from an inaccuracy in OC analysis due to low particle concentrations.
O, H and N). During the pollution episode, the unidentified fraction was especially large (25.5%), and it also contained silicates and metal oxides/hydroxides, as will be shown in TEM/EDX results. The weight percentage of K+ (0.90%) and oxalate (0.77%) and the concentration of monosaccha-ride anhydmonosaccha-ride (PMA=15 ng m−3)also reached their peak values during the pollution episode, indicating the presence of biomass burning aerosols (Andreae, 1983; Andreae et al., 1998; Simoneit et al., 1999; Sillanp¨a¨a et al., 2005). However, their concentrations only rose slightly (especially PMA),
which suggests that biomass burning was one source but not the main source of pollution episode aerosols. During a strong long-range transported wildfire smoke episode in Helsinki, Finland, the PMA concentrations reached over
20-fold higher values (365 ng m−3)in three-day PM2.5 sam-ples (Sillanp¨a¨a et al., 2005). Satellite observations (MODIS fire detections, Web Fire Mapper maps at http://maps.geog. umd.edu/) indicate that there were numerous fire areas, pre-sumable agricultural field-burning and wildfires in Eastern Europe and especially in Russia, before and during the
pol-500 nm
A
C B
Fig. 4. TEM images of different particle types from PM0.2−1
sam-ple 7 collected during the pollution episode; (a) tar ball, (b) soot and (c) Si-rich fly ash mixed with (ammonium)sulphates contain-ing material. The rest of the particles were classified as “(ammo-nium)sulphates and their mixtures with C, K, soot (depicted with horizontal arrows) and/or with other inclusions (depicted with ver-tical arrows)”.
lution episode. The trajectories (Fig. 2) and NAAPS model results (Fig. 3) indicate that some smoke aerosol from these fires arrived in Finland during this period.
The main components in all PM1.3−10samples were OC, EC, NO−3 and SO2−4 (Table 2). During the pollution episode, the weight percentages of Ca2+(4.1%) and unidentified com-ponents (28.1%) were especially high. During the clean ma-rine period, Na+ and Cl− weight percentages reached their highest proportions (7% and 9%, respectively, in the 20– 22/05 sample).
3.3 Major particle types and their abundances by
TEM/EDX
The individual particles analysed were classified into 10 dif-ferent particle groups based on their elemental composition, morphology, internal structure and susceptibility to damage by an electron beam. The particle groups and classification criteria are presented in Table 3. The relative abundances of each particle group in different size fractions are shown in Table 4. The particles of the first three groups were mostly present in PM0.2−1 samples. These particle types were 1) tar balls, 2) soot and 3) (ammonium)sulphates and their mix-tures with C, K and/or different inclusions. The relative pro-portions of the remaining seven particle groups were usually highest in either PM1−3.3or PM3.3−11samples; 4) silicates, 5) metal oxides/hydroxides, 6) Ca/Mg carbonates, sulphates and/or nitrates, 7) sea salt, 8) porous Na-rich particles, 9) bi-ological particles and 10) C-rich fragments.
O (K+ S) C S K C n=21 C=84% O=11% (K+S)=5%
Fig. 5. Ternary diagrams of C-O-(K+S) and C-S-K ratios for tar
balls collected during the pollution episode (PM0.2−1and PM1−3.3
samples 6–7). The X-ray count sum of the selected elements is nor-malized to 100%, and an example of the elemental ratios is shown in the box.
3.3.1 Tar balls
During the pollution episode, PM0.2−1and PM1−3.3samples contained some (1–4%) individual spherical C-rich particles that were very dark (electron-dense), amorphous and totally stable even in the presence of very strong electron beam (Fig. 4, particle A). P´osfai et al. (2003, 2004) named this kind of particles as tar balls, a distinct carbonaceous parti-cle type from soot. Tar balls originate from biomass burning, especially during smouldering burning conditions (P´osfai et al., 2003, 2004; Chakrabarty et al., 2006). The relative pro-portion of the tar balls remained quite low or moderate (1– 4% tar balls) during the pollution episode compared with the proportion observed at some other sites (P´osfai et al., 2003; P´osfai et al., 2004; Hand et al., 2005). The low proportion of tar balls is consistent with our bulk chemical results, indi-cating that biomass burning was one source but not the main source of the pollution episode.
The ternary diagrams in Fig. 5 show elemental ratios of tar balls in our samples. The most abundant elements were C (mean 84% of X-ray counts) and O (mean 11%). Fur-thermore, all particles contained some S (mean 4%), and half of the particles contained minor amounts of K (mean of all analysed particles 1%). In general, these elemental re-sults are consistent with those of P´osfai et al. (2003, 2004) and Hand et al. (2005). However, they also observed Cl in some tar balls, and S was not present in all particles. Thus, the tar balls in our samples were likely transported from a distant source, probably from open fires in Eastern Europe (see Fig. 3), because Cl is absent and S is enriched in aged biomass smoke due to Cl depletion and accumulation of sec-ondary products (Liu et al., 2000; Li et al., 2003b; P´osfai et al., 2003). The elemental results and visual inspection in-dicate that mixing with sulphate was very slight in tar balls compared with the mixing of soot with sulphate (Sect. 3.3.3). This observation is consistent with other studies (P´osfai et al., 2003, 2004; Hand et al., 2005). Tar balls scatter and absorb
Table 3. Classification criteria for different particle groups.
Particle group Elemental characteristics * Typical morphology/internal structure and beam sensitivity
Tar balls Abundant C with minor S, often minor K Individual particles with circular shape Soot Abundant C, often minor S, K and/or Si Fractal-like agglomerates of circular
par-ticles (Ammonium)sulphates and their
mixtures with C, K and/or differ-ent inclusions
S with variable amounts of C and/or (usu-ally minor) K
Mostly circular shape, beam damage, contains sometimes internally mixed soot and other beam-resistant inclusions Silicates Abundant Si, usually with Al, variable
minor Fe, Ca, K, Mg, Na, Ti,and/or S
Irregular soil particles or circular fly ash particles
Metal oxides/hydroxides Abundant Mn, Fe, Zn and/or Pb Irregular angular particles or circular fly ash particles
Ca/Mg carbonates, sulphates and/or nitrates
Abundant Ca with C and/or S, sometimes with abundant Mg and/or minor Si
Mostly circular shape, sometimes angular
Sea salt Abundant Na, variable Cl and S, minor Mg, K and Ca
Variable morphology; different angular shapes or circular
Porous Na-rich particles Abundant Na with S and K, no Mg and Ca Sponge-like porous morphology Biological particles Abundant C, usually minor K and/or P Variable morphology
C-rich fragments Abundant C Angular shape, often thin
* Oxygen was present in practically all particles, and therefore, it is not shown in the element lists.
Table 4. Relative abundances (%) of particles in different particle groups in three size fractions during the six sampling periods in May 2004.
Maximum value of each particle group is shown with bold numbers. Int. per. = Intermediate period. The values in parentheses show the abundances of spherical/rounded particles.
Size fraction 0.2 µm<Dp<1 µm 1 µm<Dp<3.3 µm 3.3 µm<Dp<11 µm
Pollution Int. per. Clean marine Pollution Int. per. Clean marine Pollution Int. per. Clean marine
episode period episode period episode period
Sample number (= date) 6 7 10 17 20 22 6 7 10 17 20 22 6 7 10 17 20 22
Tar balls 1 2 0 0 0 0 4 4 2 0 0 0 0 0 0 0 0 0
Soot 7 3 12 0 3 6 0 0 2 0 0 0 11 5 0 0 0 0
(Ammonium)sulphates and their mixtures with C, K and/or different inclusions
84 87 83 95 97 93 9 14 5 6 2 15 0 0 0 5 0 0
Silicates 4(1) 4(2) 0 3 0 0 22(1) 26(7) 14(2) 17 2 5 32 33 0 53 5 6
Metal oxides/hydroxides 1 4(2) 0 1 0 1 4(1) 9(1) 0 0 0 3(1) 5 5(5) 11(6) 0 0 3
Ca/Mg carbonates, sul-phates and/or nitrates
1(1) 0 0 0 0 0 48(22) 39(27) 3(3) 10(6) 2(2) 1(1) 26(21) 38(29) 6(6) 0 5(5) 0
Sea salt 1 0 3 1 0 0 9 4 36 67 89 73 5 0 5 21 25 0
Porous Na-rich particles 0 0 0 0 0 0 0 0 35 0 0 0 0 0 5 0 0 0
Biological particles 0 0 0 0 0 0 0 0 2 0 2 0 21 14 50 0 55 81
C-rich fragments 1 1 2 0 0 1 5 4 2 0 5 3 0 5 22 21 10 10
Number of analysed par-ticles (n)
136 103 104 100 102 103 85 74 63 63 64 73 19 21 18 19 20 31
light strongly, and they do not exhibit deliquescence but do uptake some water at ∼83% RH and may dissolve at higher
RH (Hand et al., 2005). Thus, they may play an important role in regional haze and climate forcing.
(a) 200 nm S K C
n=34
(b)
Fig. 6. TEM image of (a) soot particle and (b) C-S-K ternary
dia-gram for soot particles from all PM0.2−1samples.
3.3.2 Soot particles
Soot particles were present almost in all PM0.2−1 sam-ples (0–12%; Table 4). Furthermore, several soot particles were strongly mixed with beam-sensitive, S-containing ma-terial, and they are described in next section (not included in the above-mentioned percentage value). Soot particles are formed by numerous spherical carbon particles (diam-eter ∼20–50 nm), and the morphology of soot varies from short chains to complex chain-agglomerates depending on burning conditions (Fig. 6a, P´osfai et al., 2003; Kocbach et al., 2005). In addition to C and O most soot particles con-tained also minor amounts of S and K (Fig. 6b) and some particles contained small quantities of Si. These are typ-ical minor elements in soot (Kocbach et al., 2005). Soot particles are the most important light-absorbing component of aerosols (IPCC, 2001), and the mixing with hygroscopic chemical components during transport strongly affects their climatic effects, as discussed below.
3.3.3 (Ammonium)sulphates and their mixtures with C, K and/or different inclusions
Most particles (83–97%, Table 4) in PM0.2−1samples were damaged easily under beam exposure. These particles con-tained S with variable amounts of C, O and (usually mi-nor) K. Sometimes minor amounts of other elements (Mg,
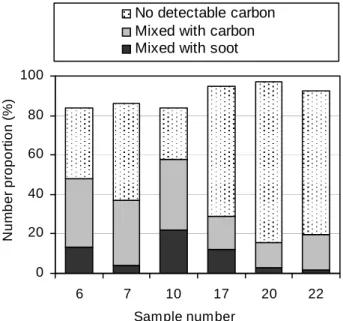
0 20 40 60 80 100 6 7 10 17 20 22 Sample number N u m b er pr o por ti o n ( % ) No detectable carbon Mixed with carbon Mixed with soot
Fig. 7. Proportions of different subgroups of (ammonium)sulphates
containing beam-sensitive particles in PM0.2−1samples.
Ca, Na, Si and Al; during pollution episode also Pb, Zn, V and Ni) were also detected. The sulphur in these particles was probably present mainly as ammonium sulphate salts (e.g. (NH4)2SO4, (NH4)HSO4), (NH4)3H(SO4)2) because the particles did not have a satellite droplet ring(s) around them, which is characteristic of such acid sulphates as H2SO4 particles (P´osfai and Moln´ar, 2000; Kojima et al., 2004, 2005). The high concentrations of SO2−4 and NH+4 measured by ion chromatography (Table 2) also support the dominance of ammonium sulphate salts. Because ammonium cannot be detected with EDX, we decided to name S-containing components of these particle as (ammonium)sulphates. Fur-thermore, some of these beam-sensitive particles contained beam-resistant soot agglomerates and some particles con-tained also other beam-resistant dark (= electron-opaque) in-clusions without clear morphological characteristics (Fig. 4). The origin of the dark inclusions remained unclear. They might contain material from particles of biological origin and/or material from burning sources such as collapsed tar balls or soot.
More detailed classification of these
(ammo-nium)sulphates containing beam-sensitive particles is challenging and partly artificial (see also referee com-ments for this article from the web pages of this journal) because the variations in elemental ratios of S, C and K were continuums and because the size and morphology of soot inclusions and other non-recognizable beam-resistant inclusions varied strongly. However, particles were coarsely divided into three subgroups to illustrate some character-istics of this largest particle group (83–97%) of PM0.2−1 samples. The subgroups are a) (ammonium)sulphates mixed
(a)
200 nm 200 nm
(c)
(b)
200 nm X-ray energy (keV)
C O
(d)
S K C(e)
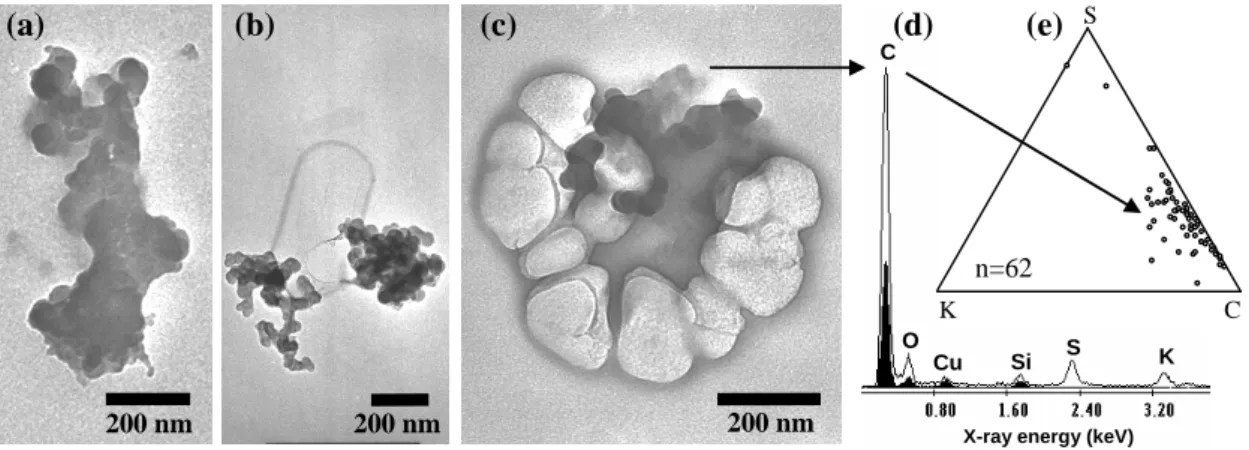
n=62 S Si Cu KFig. 8. TEM images of (a) mixed soot/sulphate-containing particle, (b–c) mixed soot/sulphate-containing particles after intentional strong
beam exposure, (d) X-ray spectrum for the soot/sulphate-containing particle (background spectrum from TEM grid substrate is depicted in black) and (e) C-S-K ternary diagram for mixed soot/sulphate-containing particles from all PM0.2−1samples.
with recognizable soot, b) (ammonium)sulphates mixed with carbon and c) (ammonium)sulphates without detectable carbon. The elevated total C peak to background C peak ra-tios (>1.3) were considered rough estimates of the presence of detectable carbon. The proportions of each subgroup in PM0.2−1 samples are shown in Fig. 7 and characteristics of particles are discussed below.
The shape of particles in “(ammonium)sulphates mixed with soot” subgroup varied strongly (Fig. 8a–c and Fig. 4). The morphology of several soot aggregates was collapsed and compact, which suggests that they have been in contact with water during transport (Zuberi et al., 2005). In some of these particles, soot had almost totally lost its character-istic morphology. The C-S-K ternary diagrams in Fig. 6b and 8e show the marked difference in S content of soot and internally mixed soot/sulphate particles (see also ex-ample spectrum in Fig. 8d). The proportions of internally mixed soot/sulphate particles were 2–22% in PM0.2−1 sam-ples (Fig. 7), which are somewhat higher proportions com-pared to those of soot (0–12%; Table 4). Thus, in PM0.2−1 samples, ∼60% (range 25–100%) of soot was internally mixed with (ammonium)sulphates. Because some particles in (ammonium)sulphates “mixed with carbon” and “without detectable carbon” subgroups might also contain unidenti-fiable soot particles (dark inclusions without clear morpho-logical characteristics), the proportions for internally mixed soot/sulphate particles should be considered as minimum es-timates. The strong internal mixing of soot is in line with other studies performed in clean background areas, far from soot emission sources (P´osfai et al., 1999; Hasegawa and Ohta, 2002; Li et al., 2003a; Okada et al., 2005). While freshly emitted soot is extremely hydrophobic, the aging processes such as coagulation, condensation and chemical reactions cause soot to become rapidly (in polluted condi-tions during less than a few hours; Johnson, 2005) more hy-drophilic (Zuberi et al., 2005). The internal mixing of soot
with sulphate (as well with hygroscopic OC and nitrate) par-ticles strengthens soot’s light absorption properties, increas-ing the direct radiative forcincreas-ing (Chung and Seinfeld, 2005; Schnaiter et al., 2005). However, the total effect of soot on radiation balance of the Earth is still difficult to estimate accurately because the aging of soot decreases its poorly known surface area (see van Poppel et al., 2005 based on 3-dimensional TEM images), shortens its residence time in the atmosphere due to more efficient wet deposition and en-ables soot to act as cloud condensation nuclei (CCN) (Liu et al., 2005; Zuberi et al., 2005).
The (ammonium)sulphates without recognizable soot were divided as particles “mixed with carbon” (13–36%, Fig. 7) and “without detectable carbon” (26–81%). Al-though the particle size distributions were fairly similar in all PM0.2−1 samples, there were clear differences between samples in the proportion of particles with and without de-tectable C (Fig. 7). The results indicate that there were large amounts of particles with internally mixed (ammo-nium)sulphates and (vacuum-resistant) carbon; their propor-tions were higher during the pollution episode and the inter-mediate period (33–36% in samples 6–10) than in the clean, marine period (13–17% in samples 17–22). The presence of internally mixed (ammonium)sulphates and carbon is in line with other recent studies, conducted in various continental environments (Lee et al., 2002; P´osfai et al., 2003; Dall’Osto et al., 2004; Tervahattu et al., 2005; Zhang et al., 2005). P´osfai and Moln´ar (2000) also show some visual evidence (TEM images) that (ammonium)sulphates are more strongly mixed with carbon (thick coating residuals) in polluted con-tinental samples than in clean marine samples. However, it is still insufficiently known what kind of mixtures ammonium sulphate salts and carbonaceous components form in the at-mosphere, how commonly these mixed particles exist and how strongly the changes in the mixing state affect the prop-erties of the particles (e.g. impact on hygroscopic growth and
Si S Al Si S Al
(b)
PM3.3-11 S=2% n=26 S=2%(a)
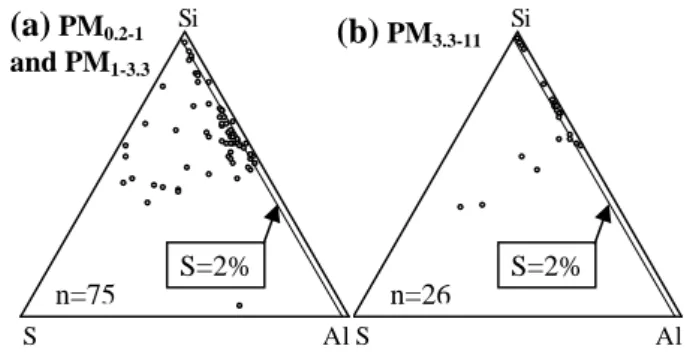
PM0.2-1 and PM1-3.3 n=75Fig. 9. Ternary diagrams of Al-Si-S ratios for silicates from all (a)
PM0.2−1and PM1−3.3samples and (b) PM3.3−11samples.
reactions with gases) (Kanakidou et al., 2005; Donaldson and Vaida, 2006; Sun and Ariya, 2006).
The proportion of K varied strongly in (ammo-nium)sulphates containing particles. The high proportion of K is typical of aerosols originating from biomass burn-ing. The proportion of K-rich particles (= proportion of K higher compared to proportions of C or S) was 0–9% in PM0.2−1 samples (proportions are not shown and separated from (ammonium)sulphates containing particles in Fig. 7). The highest proportion (9%) of K-rich particles was observed in sample 17 during the clean, marine period. However, this might be a coincidence due to the relatively small number of particles analysed. There were slight differences between samples when K/S ratios were calculated for all S-C-K– containing particle groups, including particles described in this section ((ammonium)sulphates and their mixtures with C, K and/or different inclusions) as well in previous sections (tar balls and soot particles); the median K/S values were slightly higher during the pollution episode (0.21 and 0.16 for samples 6 and 7, respectively) and during the intermedi-ate period (0.12 for sample 10) than during the clean, marine period (0.12, 0.08 and 0.05 for samples 17, 20 and 22, respec-tively). This indicates again the presence of some biomass-burning aerosols during the pollution episode. In sample 6, emissions from oil-shale-burning industrial areas, located in Narva (see Fig. 2) and Slantsy (∼25 km south of Narva), may also have increased the K/S ratio because they contain a sub-stantial amount of K in the submicron size range (H¨as¨anen et al., 1997; Tervahattu et al., 2004).
3.3.4 Silicates and metal oxides/hydroxides
Si-O-rich particles with variable amounts of other typical elements of the Earth’s crust (Al and minor Fe, Ca, K, Mg, Na and/or Ti depending on the mineralogy of particles) were classified as silicates, while particles in the “metal ox-ides/hydroxides” group were mostly Fe-rich, and a few par-ticles also contained abundant Zn, Mn and/or Pb. The shape of silicates and metal oxides/hydroxides was usually angu-lar, but a few spherical fly ash particles were also observed.
The proportions of both angular and spherical silicates and metal oxides/hydroxides were especially high during the pol-lution episode (Table 4), and Pb-containing particles were observed only during this period. When all particles with at least minor (detectable) Pb were counted from all parti-cle groups (some S-K-C-rich partiparti-cles also contained Pb as mentioned above), the proportions of Pb-containing particles were 3–7% in PM1−3.3 and PM0.2−1 samples. These ele-vated proportions of heavy metals and fly ash particles in-dicate that polluted air masses from Eastern Europe carried aerosols from metal industry and/or fossil fuel burning.
The silicates contained variable amounts of S, and the S proportions were clearly higher in PM1−3.3samples than in PM3.3−11samples (Fig. 9a and b). The proportion of silicates with a S/(Si+Al+S) ratio >0.02 (see S=2% line in Fig. 9a and b) was 84% for PM0.2−1 and PM1−3.3 (merged) sam-ples, and only 23% for PM3.3−11samples. This difference in S content probably results from the accumulation of sulphate on the surfaces of silicates during transport due to conden-sation and coagulation of S-containing species. The silicates in PM1−3.3 samples have a higher surface area to volume ratio and a longer residence time in the atmosphere (due to slow gravitational removal) than larger silicate particles in PM3.3−11samples, which probably explains the difference in S proportion. The sulphate accumulation on the surface of the silicates increases their hygroscopicity and enables these internally mixed particles to act as CCN at high supersatura-tion.
3.3.5 Ca/Mg carbonates, sulphates and/or nitrates
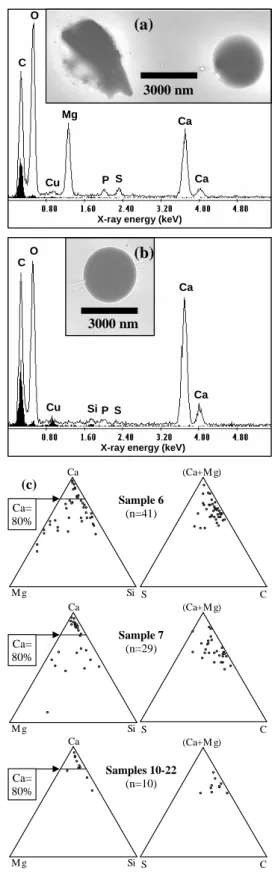
Ca-O-rich particles with variable Mg, C, S and Si were clas-sified as Ca-rich particles (see example spectra in Figs. 10a and b), and this group was named as “Ca/Mg carbonates, sul-phates and/or nitrates”. Furthermore, some of these particles contained minor amounts of other elements such as Al, K, P and Fe. The shape of the Ca-rich particles varied from angular to completely rounded (Fig. 10a and b). The ratios of major elements in Ca-rich particles for different PM1−3.3 samples are shown in ternary diagrams (Fig. 10c). The domi-nance of Ca and C, with abundant Mg and/or Si in a few par-ticles, suggests the presence of Ca- and Ca-Mg-carbonates (e.g. calcite CaCO3 and dolomite CaMg(CO3)2)and their (minor) mixtures with silicates. Furthermore, S was detected in all particles, which indicates that they contained sulphate. Nitrate was also probably present because the proportions of C, S and Si were very low in some particles, and only Ca and O were detected. However, only very weak N peaks were ob-served in X-ray spectra due to strong peak overlap of C and O with N and due to the deep gap in transmissions character-istic of the EDX window for the Kα line of N.
The relative number of Ca-rich particles was very high during the pollution episode (samples 6–7), especially in PM1−3.3 samples (39–48%; Table 4) but also in PM3.3−11 samples (26–28%). During other sampling periods, these
size fractions contained ≤10% Ca-rich particles, and in PM0.2−1samples there were practically no Ca-rich particles. During the pollution episode, air masses passed over Esto-nian and Russian oil-shale-burning industrial areas located in Narva and Slantsy (sample 6, see Fig. 2), and over the region of St. Petersburg (sample 7). These regions belong to the strongest source areas of aerosols and Ca in Northern Europe (H¨as¨anen et al., 1997; Lee and Pacyna, 1999; Jalkanen et al., 2000; EMEP, 2002), and thus, the pollution episode Ca-rich particles might originate mainly from these areas. A more detailed source identification of Ca-rich particles is difficult because they can originate from various sources, including fossil fuel and biomass burning, cement and metal industries, soil dust and marine sources (Hoornaert et al., 1996; Lee and Pacyna, 1999; Li et al., 2003b). However, the relative amount of Mg and Si in Ca-rich particles was highest in sample 6 and lowest in samples 10–22 (see Fig. 10c), which can be explained by the differences in their origin. For instance, the proportion of particles with Ca/(Ca+Mg+Si)>80% (see Si-Ca-Mg ternary diagrams in Fig. 10c) were 24% for sample 6, 59% for sample 7 and 70% for samples 10–22. The high proportion of Ca-rich particles with only minor Si and/or Mg in samples 10–22 might indicate a stronger impact of such marine sources as fractional recrystallization of sea salt par-ticles or marine organisms (e.g. coccoliths) (Andreae et al., 1986).
The substitution of CO2−3 by SO2−4 and NO−3 is typical of Ca/Mg carbonates in the atmosphere due to reactions with SO2 and HNO3 (Song and Carmichael, 1999; Al-Hosney and Grassian, 2005; Laskin et al., 2005b). These conver-sion products are highly hygroscopic (e.g. deliquescence RH for amorphous Ca(NO3)2particles is only ∼13%, Tang and Fung, 1997). In PM1−3.3samples, several rounded Ca-rich particles seemed to be very thin (light contrast in TEM im-ages), indicating that they have been in liquid form dur-ing the impaction on TEM grids. Durdur-ing the collection of samples 6–7, the RH was only 30–31%, which shows that also mixed Ca/Mg carbonates/sulphates/nitrates may occur at least partly in liquid form even at very low RH. This is con-sistent with the results of recent laboratory studies with en-vironmental SEM (with adjustable RH) for Ca-rich particles collected from various environments (Laskin et al., 2005a, 2005b). The substitution of CO−3 with SO2−4 and NO−3 from Ca/Mg-rich particles may change optical and CCN properties as well as residence time in the atmosphere. Furthermore, these reactions provide a sink for SO2and HNO3and release CO2.
3.3.6 Sea salt and porous Na-rich particles
The morphology and composition of sea salt particles varied strongly. They contained abundant Na and variable amounts of Cl and/or S and O, depending on the rate of Cl substi-tution, as well as minor amounts of Mg, Ca and K. There were cubic, angular and rounded particles, and some of them
(a)
3000 nm
X-ray energy (keV)
S P Cu Ca Ca Mg O C
(b)
3000 nm SiX-ray energy (keV)
P S Cu Ca Ca O C Ca M g Si (Ca+M g) S C Sample 6 (n=41) Ca= 80% Ca M g Si (Ca+M g) S C Sample 7 (n=29) Ca= 80% Ca M g Si (Ca+M g) S C Ca= 80% Samples 10-22 (n=10) (c)
Fig. 10. TEM images of Ca-rich particles (a) with abundant Mg and (b) without Mg together with their X-ray spectra (from the spherical
particles), and (c) ternary diagrams of Si-Ca-Mg and C-(Ca+Mg)-S ratios for Ca-rich particles from selected PM1−3.3samples.
3000 nm (a) 2 2 1 1 500 nm (c) Na Cu Cl Mg S K Ca Si
X-ray energy (keV)
Si Ca K Na (d) S Mg Cu Cl O C
X-ray energy (keV)
O C
(b)
Fig. 11. TEM images of (a1) sea salt particles with strong Cl depletion and (a2 and b) porous Na-S-K-O-rich particles. The X-ray spectra
(c and d) show that porous particle did not contain Mg and Ca and that the proportion of K was high compared to elemental ratios in sea salt (background spectra from TEM grid substrate are depicted with black colour).
contained cation (Ca, Mg and/or K) sulphate rims and rods. Images of sea salt particles with similar morphology and composition have been shown in several recent electron mi-croscopy studies (e.g. Ebert et al., 2000; Li et al., 2003a). However, PM1−3.3 sample 10 contained ordinary sea salt particles (36% of all analysed particles) and also other Na-rich particles without characteristic morphology and Mg-Ca-K ratios of sea salt (36% of all analysed particles; Table 4). The morphology of the Na-rich particles was rounded and porous (sponge-like), and they seemed to be composed of numerous, small spherical subparticles (Fig. 11a particles no. 2 and Fig. 11b). They were not very sensitive to beam damage, but under strong intentional beam exposure they were damaged slightly, similarly to sea salt particles. These porous particles contained abundant Na and O and some S and K, while Mg and Ca were (almost) totally absent (com-pare spectra in Fig. 11c and d). Ternary diagrams in Fig. 12 (diagrams in the bottom row) confirm the clearly deviating Mg-Ca-K ratios of these porous particles compared with sea salt particles, although there were also a few (non-porous) sea salt particles with deviating elemental ratios, probably due to inaccuracy in elemental analysis and potentially to the minor presence of fractional recrystallization products of sea salt. The median Mg/Na, K/Na and Ca/Na ratios were 0.131, 0.035 and 0.038, respectively, for all sea salt particles in PM1−3.3samples 10–22, while the corresponding values for Na-S-K-O-rich porous particles were 0.013, 0.141 and
0.004 in PM1−3.3sample 10. There were also some Na-rich particles with deviating Mg-Ca-K ratios in other samples, but their morphology was never porous.
When water evaporates from seawater droplets, different compounds crystallize separately according to their solubil-ity products (Borchert, 1965; Zayani et al, 1999). After evap-oration, sea salt particles may form aggregates of loosely attached crystals that can shatter and produce pure crystals and crystal mixtures (Parungo et al., 1986). Thus, frac-tional recrystallization may change elemental ratios of sea salt particles in atmosphere and/or during aerosol sampling (Parungo et al., 1986; Ro et al., 2001; Niemi et al., 2005b). However, the porous morphology of Na-S-K-O-rich parti-cles strongly suggests that they were not fractional recrystal-lization products of sea salt. During their sampling (sample 10), air masses had passed over paper industry areas located
∼100 km northeast of Hyyti¨al¨a. Large amounts of sodium sulphate (Na2SO4)are used in wood pulp processing, and residuals from these processes are burned. Thus, the burning of mixed sodium sulphate and biomass residuals (contains abundant K) might be the source of Na-S-K-O-rich particles. However, burning of other waste is also a potential source for these particles (Hwang and Ro, 2006), because waste burn-ing is a major source of Na in continental areas (Ooki et al., 2002). The plentiful presence of aerosols originated from burning sources in sample 10 is also supported by the high proportions of soot and mixed soot/sulphate particles in the
Sample 10 (n=45) Sample 17 (n=42) Sample 20 (n=57) Sample 22 (n=53) Na S Cl Na S Cl M g Ca K M g Ca K Na S Cl
Sea salt with complete Cl depletion by nitrate M g Ca K M g Ca K Na S Cl Unreacted sea salt
Fig. 12. Ternary diagrams of Cl-Na-S (top row) and K-Mg-Ca (bottom row) ratios for all sea salt particles (blue symbols) and porous
Na-S-K-O-rich particles (red symbols) in selected PM1−3.3samples. The line in Cl-Na-S diagrams depicts the constant S/Na ratio, which is the
same as in unreacted sea salt particles. When symbols of sea salt particles are located clearly below that line, they indicate substitution of Cl by S-containing anions such as sulphate or MSA.
PM0.2−1 size fraction (12% and 22%, respectively, see Ta-ble 4) as well as by the elevated NO2 and NO concentra-tions (see Table 1 and Fig. 7). The Na-S-K-O-rich particles may have originally contained Cl (Na-Cl/S-K-O-rich parti-cles), but the Cl substitution by sulphate (or by other acid anions) could have removed it during transport.
During the collection of sample 10, the trajectories curved towards the Arctic Ocean, and in addition to Na-S-K-O-rich particles, abundant sea salt particles were present (37% in PM1−3.3 sample), as mentioned above. Two hours after the sampling period, the back trajectories reached the Arctic Ocean, and thus, the presence of sea salt particles in sample 10 might indicate a slight inaccuracy in these strongly curved trajectories. A few sea salt particles were also present during the pollution episode (4–9% in PM1−3.3 samples), but they are not shown in ternary diagrams due to the small amount of particles analysed. The relative proportions of sea salt par-ticles rose especially high during the clean period (67–89% in PM1−3.3 samples 17–22), when air masses arrived from the direction of the Arctic Ocean. Sea salt particles were also present in PM3.3−11samples (0–25%), but in PM0.2−1 samples their abundance was invariably very low (0–3%).
The rate of Cl depletion varied strongly between samples (Fig. 12, ternary diagrams of Cl-Na-S ratios in the top row). The proportion of sea salt particles with strong Cl depletion (Cl/Na X-ray count ratio <0.2) was clearly highest (91%) in sample 10, while sample 20 contained mainly unreacted sea salt and only a few (4%) particles with strong Cl deple-tion. Samples 17 and 22 contained sea salt particles both with no/minor depletion and with strong Cl depletion (particles
with strong depletion 40% and 34%, respectively). The main reasons for the especially strong Cl depletion in sample 10 were probably the long time spent over continent (see trajec-tory in Fig. 2) and the elevated concentrations of gaseous pol-lutants. The trajectory of sample 20 clearly stayed the short-est time above the continent before its arrival to Hyyti¨al¨a, and the concentrations of gaseous pollutants were very low. This explains well the low rate of Cl depletion in this sample.
Only a minor fraction of Cl was replaced with sulphate or MSA in all PM1−3.3 samples since the S/Na was almost constant for most of the sea salt particles (Fig. 12, ternary diagrams in the top row). This suggests that Cl was re-placed mainly by NO−3, which is usually the most impor-tant Cl-substituting anion together with SO2−4 (Kerminen et al., 1997, 1998). Only a few very small X-ray count peaks for N were observed in the X-ray spectra due to the insensi-tivity of EDX to detect N. However, the presence of NO−3 is supported by the bulk chemical results since NO−3 and SO2−4 were the most common anions in PM1.3−10 samples (Table 2). The Cl substitution by nitrate strongly changes the hygroscopic properties of sea salt particles; NaNO3may contain liquid water at much lower RH than unreacted sea salt particles (Hoffman et al., 2004). Thus, modification of sea salt particles may change their size, light scattering prop-erties and affinity for CCN formation. The presence of wa-ter on sea salt surfaces also greatly enhances their reactiv-ity with gases compared with dry sea salt (ten Brink, 1998; Hara et al., 2002). Furthermore, the nitrate and the non-sea salt SO2−4 that accumulate into sea salt particles are removed
P K C n=54
(e)
Biological particles P K C n=33(f)
C-rich fragments(a)
2 µm 2 µm(d)
2 µm(c)
2 µm(b)
Fig. 13. TEM images of particles classified as (a, c) biological
par-ticles and (b, d) C-rich fragments, as well as (e, f) ternary diagrams of C-P-K ratios for these particles from all samples.
rapidly from the atmosphere due to the large sizes of parti-cles, which reduces the amounts of scavenged species in the atmosphere.
3.3.7 Biological particles and C-rich fragments
The biological particles contained abundant C, some O and variable amounts of K and/or P. Furthermore, a few parti-cles also contained small quantities of Cl, S, Ca, Mg, Na, Si and/or Al. The morphology of these particles varied strongly from spherical and oval to complicated biological structures (Fig. 13a and c). Most of the biological particles were likely spores or conidia of fungi (Wittmaack et al., 2005), but the detailed classification of these particles was beyond the scope of this work. There were also several angular C-rich parti-cles without clearly characteristic morphology of biological particles (Fig. 13b and d), and due to uncertainty in source identification, they were referred to as C-rich fragments. In addition to C, they contained some/minor O, but usually no P or K. The proportion of particles with detectable P or K was only 15% for C-rich carbon fragments, while the cor-responding value for biological particles was 93% (compare also ternary diagrams for C-P-K ratios in Fig. 13e and f). The TEM images of C-rich fragments were usually quite
light (low contrast), which suggests that the fragments were thin. Their appearance and composition further suggest that they might be abrasion products from the surfaces of liv-ing or dead organisms. If the C-rich fragments were of bi-ological origin, our observations emphasize that there are abundant biological particles that cannot be detected using only elemental ratios (as used in some computer-controlled SEM/EDX and EPMA studies), and visual observations are needed to separate them from other carbonaceous particles.
The proportions of biological particles and C-rich frag-ments were highest in the coarse size fraction (in PM1−3.3 samples and especially in PM3.3−11samples), which is in line with other individual particle studies related to continental background aerosol composition in Northern Europe (Ebert et al., 2000, 2004). No clear difference was observed in the proportions of biological particles and C-rich fragments re-lated to source regions of the air masses. They might origi-nate mainly from local forests, but transport from more dis-tant regions is also possible, as strong changes were seen in the presence of Ca-rich and sea salt particles.
4 Summary and conclusions
Aerosol samples were collected at a rural site in southern Finland during polluted, intermediate and clean periods with different origins of particles. The composition, morphology and mixing state of individual particles in three size fractions (PM0.2−1, PM1−3.3 and PM3.3−11)were studied using the TEM/EDX method. TEM/EDX results were complemented with the size-segregated bulk chemical measurements of or-ganic and elemental carbon and selected ions. For more de-tailed characterization and comparisons, the individual parti-cles analysed were classified into the following 10 groups: 1) tar balls, 2) soot, 3) (ammonium)sulphates and their mixtures with C, K and/or different inclusions, 4) silicates, 5) metal oxides/hydroxides, 6) Ca/Mg carbonates, sulphates and/or nitrates, 7) sea salt and 8) porous Na-rich particles, 9) bio-logical particles and 10) C-rich fragments.
The composition, morphology and mixing state of parti-cles varied strongly in different size fractions and during dif-ferent sampling periods, depending on source areas of air masses. During the pollution episode (PM1∼16 µg m−3), aerosols originated mainly from polluted areas of Eastern Europe, and some open biomass burning smoke was also brought by long-range transport. The proportions of the fol-lowing particle types were increased: silicates and metal hy-droxides/oxides (included also spherical silicate and metal hydroxide/oxide fly ash particles), Pb-containing particles, tar balls and Ca/Mg carbonates/sulphates/nitrates. During the intermediate period (PM1∼5 µg m−3), the backward air mass trajectories were short and curving towards the Arctic Ocean, and in PM1−3.3samples, there were abundant sea salt particles (36%) with strong Cl depletion and other porous (sponge-like) Na-rich particles (35%). The porous Na-rich
particles contained abundant S, K and O, and practically no Mg and Ca. They might originate from waste burning, es-pecially from the burning of wood pulp wastes of the paper industry, when Na-rich salts (Na2SO4)are used in processes. During the clean period (PM1∼2 µg m−3), when air masses arrived from the Arctic Ocean, PM1−3.3 samples contained abundant sea salt particles (67–89%). The rate of Cl deple-tion (mainly by NO−3)from sea salt varied markedly depend-ing on the time spent over continent. Strong changes in par-ticle composition were observed in the PM1−3.3 size frac-tion during the different sampling periods. Thus, not only accumulation mode particles (PM0.2−1) but also the finest coarse particles (PM1−3.3)may originate mostly from remote sources in clean rural areas.
In PM0.2−1 samples, the major particle groups ob-served were 1) soot (0–12%) and 2) (ammonium)sulphates and their mixtures with C, K, soot inclusions and/or other inclusions (83–97%). The particles of latter group were divided coarsely into three subgroups; 2a) (ammo-nium)sulphates mixed with recognizable soot (2–22%), 2b) (ammonium)sulphates mixed with (vacuum-resistant and de-tectable) carbon (13–36%) and 2c) (ammonium)sulphates without detectable carbon (26–81%). Thus, internal mix-ing of C and S was common in particles of PM0.2−1 size fraction. Furthermore, ammonium/sulphate-salts might be more frequently/strongly mixed with (vacuum-resistant) car-bonaceous material in aerosols with clearly continental (an-thropogenic) origin compared to more marine (clean) ori-gin. The internal mixing of silicates with S was greater in small particles (PM0.2−1 and PM1−3.3)than in larger parti-cles (PM3.3.−11), probably indicating the accumulation of S during transport. Both Ca/Mg-rich particles and sea salt par-ticles were strongly mixed with SO2−4 and/or nitrate. The mixing state of particles changes their hygroscopic and op-tical properties, thus affecting their direct and indirect radia-tive forcing and their reactivity with gaseous components.
Acknowledgements. The Helsinki University Environmental
Re-search Centre, the Finnish Cultural Foundation and the Academy of Finland (contract no. 201131) are acknowledged for funding this study. We thank our colleagues at the following institutes for their collaboration: P. Aalto, V. Hiltunen, M. Boy and J. Mar-tikainen (Department of Physical Sciences, University of Helsinki), M. R¨ais¨anen (The Geological Survey of Finland) and K. Kupiainen (Nordic Envicon Ltd.). The authors gratefully acknowledge the NOAA Air Resources Laboratory (ARL) for provision of the HYSPLIT transport and dispersion model and the READY website (http://www.arl.noaa.gov/ready.html) used in this publication. The Naval Research Laboratory is acknowledged for the NAAPS model results (website at http://www.nrlmry.navy.mil/aerosol).
Edited by: S. Martin
References
Al-Hosney, H. A. and Grassian, V. H.: Water, sulfur dioxide and nitric acid adsorption on calcium carbonate: A transmission and ATR-FTIR study, Phys. Chem. Chem. Phys., 7, 1266–1276, 2005.
Andreae, M. O.: Soot carbon and excess fine potassium: Long-range transport of combustion derived aerosols, Science, 220, 1148–1151, 1983.
Andreae, M. O., Charlson, R. J., Bruynseels, F., Storms, H., Van Grieken, R., and Maenhaut, W.: Internal mixture of sea salt, sili-cates, and excess sulfate in marine aerosols, Science, 232, 1620– 1623, 1986.
Andreae, M. O., Andreae, T. W., Annegarn, H., Beer, J., Cachier, H., le Canut, P., Elbert, W., Maenhaut, W., Salma, I., Wienhold, F. G., and Zenker, T.: Airborne studies of aerosol emissions from savanna fires in southern Africa: 2. Aerosol chemical composi-tion, J. Geophys. Res., 103, 32 119–32 128, 1998.
Bigg, E. K.: The aerosol in a boreal forest in spring, Tellus B, 53, 510–519, 2001.
Borchert, H.: Principles of oceanic salt deposition and metamor-phism, in: Chemical Oceanography, Vol. 2, edited by: Riley, J. P. and Skirrow, G., Academic Press, London, pp. 205–276, 1965. Chakrabarty, R. K., Moosm¨uller, H., Garro, M. A., Arnott, W. P.,
Walker, J., Susott, R. A., Babbitt, R. E., Wold, C. E., Lincoln, E. N., and Hao, W. M.: Emissions from the laboratory combus-tion of wildland fuels: Particle morphology and size, J. Geophys. Res., 111, D07204, doi:10.1029/2005JD006659, 2006.
Chung, S. H. and Seinfeld, J. H.: Climate response of direct ra-diative forcing of anthropogenic black carbon, J. Geophys. Res., 110, D11102, doi:10.1029/2004JD005441, 2005.
Dall’Osto, M., Beddows, D. C. S., Kinnersley, R. P., Harrison, R. M., Donovan, R. J., and Heal, M. R.: Characterization of individ-ual airborne particles by using aerosol time-of-flight mass spec-trometry at Mace Head, Ireland, J. Geophys. Res., 109, D21302, doi:101029/2004JD004747, 2004.
Donaldson, D. J. and Vaida, V.: The influence of organic films at the air-aqueous boundary on atmospheric processes, Chem. Rev., 106, 1445–1461, 2006.
Draxler, R. R. and Rolph, G. D.: HYSPLIT (HYbrid Single-Particle Lagrangian Integrated Trajectory), Model access via NOAA ARL READY Website (http://www.arl.noaa.gov/ready/hysplit4. html), NOAA Air Resources Laboratory, Silver Spring, MD., 2003.
Ebert, M., Weinbruch, S., Hoffmann, P., and Ortner, H. M.: Chem-ical characterization of North Sea aerosol particles, J. Aerosol. Sci., 31, 613–632, 2000.
Ebert, M., Weinbruch, S., Rausch, A., Gorzawski, G., Hoffmann, P., Wex, H., and Helas, G.: Complex refractive index of aerosols during LACE 98 as derived from the analysis of individual par-ticles, J. Geophys. Res., 107, 8121, doi:10.1029/2000JD000195, 2002.
Ebert, M., Weinbruch, S., Hoffmann, P., and Ortner, H. M.: The chemical composition and complex refractive index of rural and urban influenced aerosols determined by individual particle anal-ysis, Atmos. Environ., 38, 6531–6545, 2004.
EMEP: Transboundary acidification and eutrophication and ground level ozone in Europe. Joint CIAM & CCC & MSC-W report, EMEP Summary Report 1/2001, 2001.
EMEP: Transboundary particulate matter in Europe: Status Report 2002, EMEP Report 5/2002, 89 pp, 2002.
Hand, J. L., Malm, W. C., Laskin, A., Day, D., Lee, T., Wang, C., Carrico, C., Carrillo, J., Cowin, J. P., Collett, J., and Iedema, M. J.: Optical, physical, and chemical properties of tar balls ob-served during the Yosemite Aerosol Characterization Study, J. Geophys. Res., 110, D21210, doi:10.1029/2004JD005728, 2005. Hara, K., Osada, K., Nishita, C., Yamagata, S., Yamanocuhi, T., Herber, A., Matsunaga, K., Iwasaka, Y., Nagatani, M., and Nakata, H.: Vertical variations of sea-salt modification in the boundary layer of spring Arctic during the ASTAR 2000 cam-paign, Tellus B, 54, 361–376, 2002.
H¨as¨anen, E., AunelaTapola, L., Kinnunen, V., Larjava, K., Mehto-nen, A., Salmikangas, T., Leskel¨a, J., and Loosaar, J.: Emission factors and annual emissions of bulk and trace elements from oil shale fueled power plants, Sci. Total Environ., 198, 1–12, 1997. Hasegawa, S. and Ohta, S.: Some measurements of the mixing state
of soot-containing particles at urban and non-urban sites, Atmos. Environ., 36, 3899–3908, 2002.
Held, A., Hinz, K. P., Trimborn, A., Spengler, B., and Klemm, O.: Chemical classes of atmospheric aerosol particles at a rural site in Central Europe during winter, J. Aerosol. Sci., 33, 581–594, 2002.
Hinz, K. P., Trimborn, A., Weingartner, E., Henning, S., Bal-tensperger, U., and Spengler, B.: Aerosol single particle com-position at the Jungfraujoch, J. Aerosol. Sci., 36, 123–145, 2005. Hoffman, R. C., Laskin, A., and Finlayson-Pitts, B. J.: Sodium ni-trate particles: physical and chemical properties during hydration and dehydration, and implications for aged sea salt aerosols, J. Aerosol. Sci., 35, 869–887, 2004.
Hoornaert, S., Van Malderen, H., and Van Grieken, R.: Gypsum and other calcium-rich aerosol particles above the North Sea, Envi-ron. Sci. Technol., 30, 1515–1520, 1996.
Hwang, H. and Ro, C.-U.: Single-particle characterization of mu-nicipal solid waste (MSW) ash particles using low-Z particle electron probe X-ray microanalysis, Atmos. Environ., 40, 2873– 2881, 2006.
IPCC: Climate Change 2001 – The Scientific Basis, Cambridge University Press, New York, 289–348, 2001.
Jalkanen, L., Makinen, A., H¨as¨anen, E., and Juhanoja, J.: The ef-fect of large anthropogenic particulate emissions on atmospheric aerosols, deposition and bioindicators in the eastern Gulf of Fin-land region, Sci. Total Environ., 262, 123–136, 2000.
Johnson, K. S., Zuberi, B., Molina, L. T., Molina, M. J., Iedema, M. J., Cowin, J. P., Gaspar, D. J., Wang, C., and Laskin, A.: Processing of soot in an urban environment: case study from the Mexico City Metropolitan Area, Atmos. Chem. Phys., 5, 3033– 3043, 2005,
http://www.atmos-chem-phys.net/5/3033/2005/.
Kanakidou, M., Seinfeld, J. H., Pandis S. N., et al.: Organic aerosol and global climate modelling: a review, Atmos. Chem. Phys, 5, 1053–1123, 2005.
Karppinen, A., H¨ark¨onen, J., Kukkonen, J., Aarnio, P., and Kosken-talo, T.: Statistical model for assessing the portion of fine partic-ulate matter transported regionally and long range to urban air, Scandinavian Journal of Work, Environment & Health, 30, 47– 53, 2004.
Kerminen, V.-M., Pakkanen, T. A., and Hillamo, R. E.: Interactions between inorganic trace gases and supermicrometer particles at a
coastal site, Atmos. Environ., 31, 2753–2765, 1997.
Kerminen, V.-M., Teinil¨a, K., Hillamo, R., and Pakkanen, T.: Sub-stitution of chloride in sea-salt particles by inorganic and organic anions, J. Aerosol. Sci., 29, 929–942, 1998.
Kocbach, A., Johansen, B. V., Schwarze, P. E., and Namork, E.: Analytical electron microscopy of combustion particles: a com-parison of vehicle exhaust and residential wood smoke, Sci. Total Environ., 346, 231–243, 2005.
Kojima, T., Buseck, P. R., Wilson, J. C., Reeves, J. M., and Ma-honey, M. J.: Aerosol particles from tropical convective systems: Cloud tops and cirrus anvils, J. Geophys. Res., 109, D12201, doi:10.1029/2003JD004504, 2004.
Kojima, T., Buseck, P. R., and Reeves, J. M.: Aerosol particles from tropical convective systems: 2. Cloud bases, J. Geophys. Res., 110, D09203, doi:10.1029/2004JD005173, 2005.
Kulmala, M., H¨ameri, K., Aalto, P.P., M¨akel¨a, J. M., Pirjola, L., Nilsson, E. D., Buzorius, G., Rannik, ¨U., Dal Maso, M., Seidl, W., Hoffman, T., Janson, R., Hansson, H. C., Viisanen, Y., Laak-sonen, A., and O’Dowd, C. D.: Overview of the international project on biogenic aerosol formation in the boreal forest (BIO-FOR), Tellus B, 53, 324–343, 2001.
Laakso, L., Hussein, T., Aarnio, P., Komppula, M., Hiltunen, V., Viisanen, Y., and Kulmala, M.: Diurnal and annual characteris-tics of particle mass and number concentrations in urban, rural and Arctic environments in Finland, Atmos. Environ., 37, 2629– 2641, 2003.
Laskin, A., Iedema, M. J., Ichkovich, A., Graber, E. R., Taraniuk, I., and Rudich, Y.: Direct observation of completely processed calcium carbonate dust particles, Faraday Discuss., 130, 453– 468, 2005a.
Laskin, A., Wietsma, T. W., Krueger, B. J., and Gras-sian, V. H.: Heterogeneous chemistry of individual mineral dust particles with nitric acid: A combined CCSEM/EDX, ESEM, and ICP-MS study, J. Geophys. Res., 110, D10208, doi:10.1029/2004JD005206, 2005b.
Laskin, A., Cowin, J. P., and Iedema, M. J.: Analysis of individ-ual environmental particles using modern methods of electron microscopy and X-ray microanalysis, Journal of Electron Spec-troscopy and Related Phenomena, 150, 260–274, 2006. Lee, D. S. and Pacyna, J. M.: An industrial emissions inventory of
calcium for Europe, Atmos. Environ., 33, 1687–1697, 1999. Lee, S. H., Murphy, D. M., Thomson, D. S., and Middlebrook,
A. M.: Chemical components of single particles measured with Particle Analysis by Laser Mass Spectrometry (PALMS) during the Atlanta SuperSite Project: Focus on organic/sulfate, lead, soot, and mineral particles, J. Geophys. Res., 107(D1), 4003, doi:10.1029/2000JD000011, 2002.
Li, J., Anderson, J. R., and Buseck, P. R.: TEM study of aerosol particles from clean and polluted marine boundary lay-ers over the North Atlantic, J. Geophys. Res., 108, 4189, doi:10.1029/2002JD002106, 2003a.
Li, J., P´osfai, M., Hobbs, P. V., and Buseck, P. R.: Individual aerosol particles from biomass burning in southern Africa: 2, Compo-sitions and aging of inorganic particles, J. Geophys. Res., 108, 8484, doi:10.1029/2002JD002310, 2003b.
Liu, X. D., Van Espen, P., Adams, F., Cafmeyer, J., and Maen-haut, W.: Biomass burning in southern Africa: Individual par-ticle characterization of atmospheric aerosols and savanna fire samples, J. Atmos. Chem., 36, 135–155, 2000.