HAL Id: hal-00296236
https://hal.archives-ouvertes.fr/hal-00296236
Submitted on 23 May 2007
HAL is a multi-disciplinary open access
archive for the deposit and dissemination of
sci-entific research documents, whether they are
pub-lished or not. The documents may come from
teaching and research institutions in France or
abroad, or from public or private research centers.
L’archive ouverte pluridisciplinaire HAL, est
destinée au dépôt et à la diffusion de documents
scientifiques de niveau recherche, publiés ou non,
émanant des établissements d’enseignement et de
recherche français ou étrangers, des laboratoires
publics ou privés.
monitors in a polluted urban environment
E. J. Dunlea, S. C. Herndon, D. D. Nelson, R. M. Volkamer, F. San Martini,
P. M. Sheehy, M. S. Zahniser, J. H. Shorter, J. C. Wormhoudt, B. K. Lamb,
et al.
To cite this version:
E. J. Dunlea, S. C. Herndon, D. D. Nelson, R. M. Volkamer, F. San Martini, et al.. Evaluation of
ni-trogen dioxide chemiluminescence monitors in a polluted urban environment. Atmospheric Chemistry
and Physics, European Geosciences Union, 2007, 7 (10), pp.2691-2704. �hal-00296236�
www.atmos-chem-phys.net/7/2691/2007/ © Author(s) 2007. This work is licensed under a Creative Commons License.
Chemistry
and Physics
Evaluation of nitrogen dioxide chemiluminescence monitors in a
polluted urban environment
E. J. Dunlea1,*, S. C. Herndon2, D. D. Nelson2, R. M. Volkamer1,**, F. San Martini1, P. M. Sheehy1, M. S. Zahniser2, J. H. Shorter2, J. C. Wormhoudt2, B. K. Lamb3, E. J. Allwine3, J. S. Gaffney4, N. A. Marley4, M. Grutter5,
C. Marquez6, S. Blanco6, B. Cardenas6, A. Retama7, C. R. Ramos Villegas7, C. E. Kolb2, L. T. Molina1,8, and M. J. Molina1,**
1Department of Earth, Atmospheric and Planetary Sciences, Massachusetts Institute of Technology, Bldg. 54, 77
Massachusetts Ave, Cambridge, MA 02139, USA
2Aerodyne Research Inc., 45 Manning Road, Billerica, MA 01821-3876, USA
3Laboratory for Atmospheric Research, Department of Civil and Environmental Engineering, Washington State University,
101 Sload Hall, Spokane Street, Pullman, WA 99164-2910, USA
4University of Arkansas at Little Rock, 2801 South University Avenue, Little Rock, AR 72204-1099, USA 5Centro de Ciencias de la Atmysfera, Universidad Nacional Aut´onoma de M´exico, Mexico, D.F., Mexico
6Centro Nacional de Investigacion y Capacitacion Ambiental-INE, Av. Perif´erico 5000, Col. Insurgentes Cuicuilco, CP
04530, Mexico, D.F., Mexico
7Gobierno del Distrito Federal, Agricultura 21, Piso 1, Col. Escandon, Del. M. Hidalgo, CP 11800, Mexico, D. F., Mexico 8Molina Center for Energy and the Environment, 3262 Holiday Ct. Suite, 201 La Jolla CA, 92037, USA
*now at: University of Colorado at Boulder, Cooperative Institute for Research in Environmental Sciences, UCB 216,
Boulder, CO 80309, USA
**now at: University of California at San Diego, 9500 Gilman Drive, 0356 La Jolla, CA 92093-0356, USA
Received: 13 December 2006 – Published in Atmos. Chem. Phys. Discuss.: 16 January 2007 Revised: 5 April 2007 – Accepted: 11 May 2007 – Published: 23 May 2007
Abstract. Data from a recent field campaign in Mexico City
are used to evaluate the performance of the EPA Federal Ref-erence Method for monitoring the ambient concentrations of NO2. Measurements of NO2 from standard
chemilumines-cence monitors equipped with molybdenum oxide converters are compared with those from Tunable Infrared Laser Differ-ential Absorption Spectroscopy (TILDAS) and DifferDiffer-ential Optical Absorption Spectroscopy (DOAS) instruments. A significant interference in the chemiluminescence measure-ment is shown to account for up to 50% of ambient NO2
con-centration during afternoon hours. As expected, this interfer-ence correlates well with non-NOxreactive nitrogen species
(NOz) as well as with ambient O3 concentrations,
indicat-ing a photochemical source for the interferindicat-ing species. A combination of ambient gas phase nitric acid and alkyl and multifunctional alkyl nitrates is deduced to be the primary cause of the interference. Observations at four locations at varying proximities to emission sources indicate that the per-centage contribution of HNO3to the interference decreases
with time as the air parcel ages. Alkyl and multifunctional alkyl nitrate concentrations are calculated to reach
concen-Correspondence to: E. J. Dunlea
trations as high as several ppb inside the city, on par with the highest values previously observed in other urban loca-tions. Averaged over the MCMA-2003 field campaign, the chemiluminescence monitor interference resulted in an av-erage measured NO2 concentration up to 22% greater than
that from co-located spectroscopic measurements. Thus, this interference has the potential to initiate regulatory action in areas that are close to non-attainment and may mislead atmo-spheric photochemical models used to assess control strate-gies for photochemical oxidants.
1 Introduction
Nitrogen oxides (NOx = sum of nitrogen oxide (NO) and
nitrogen dioxide (NO2)) are primarily emitted as
byprod-ucts of combustion and participate in ozone (O3) formation
and destruction, thus playing a key role in determining the air quality in urban environments (Finlayson-Pitts and Pitts, 2000). NO2 is designated as one of the United States
En-vironmental Protection Agency’s (US EPA) “criteria pollu-tants”, which also include O3, carbon monoxide (CO),
sul-fur dioxide (SO2), airborne lead (Pb) and particulate
area has criteria pollutant concentrations that exceed a cer-tain threshold (either one hour averaged daily maxima, eight hour averaged daily maxima or annually averaged concen-trations), referred to as being in “non-attainment”. While no counties in the US are currently in non-attainment for NO2,
the US EPA has recently announced sweeping new regula-tions aimed at reducing NOxlevels by 2015 (Environmental
Protection Agency, 2005). Therefore, accurately measuring the concentration of NO2, as mandated under the 1990 Clean
Air Act Amendments, Section 182 (c)(1) (Demerjian, 2000), will become increasingly important. Positive interferences in the measurement of NO2may lead to the false classification
of an urban area as being in non-attainment.
In addition to the regulatory purposes of monitoring, am-bient measurements are also used by air quality models (AQM) for characterization and prediction of future high ozone episodes (Demerjian, 2000) and in validations of satel-lite measurements of NO2(Ord´o˜nez et al., 2006; Schaub et
al., 2006). Adequate diagnostic testing of AQM’s requires uncertainties in NO2measurements of less than ±10%
Envi-ronmental Protection Agency, 2001; McClenny et al., 2002). There has also been considerable attention paid recently to the direct emissions of NO2from diesel vehicles (Friedeburg
et al., 2005; Jenkin, 2004a; Jimenez et al., 2000; Latham et al., 2001; Pundt et al., 2005) and their resulting health effects (Beauchamp et al., 2004). These and other studies that rely on the data from monitoring networks, such as recent NO2
source apportionment (Carslaw and Beevers, 2004, 2005) and oxidant partitioning (Jenkin, 2004b) studies, could be significantly affected by interferences in the standard meth-ods for NO2measurement. Satellite measurements of NO2
are often most sensitive to surface NO2concentrations;
vali-dation of these measurements requires accurate NO2surface
measurements. In summary, assuring that NO2monitors
rou-tinely achieve a high level of precision is important for the accurate prediction of air quality and validation of satellite measurements.
Of the various techniques for measuring in situ NO and NO2concentrations, the most prevalent, and the Federal
Ref-erence Method as designated by the US EPA, is the chemi-luminescence instrument (CL NOx monitors) (Demerjian,
2000). This technique has been described in detail elsewhere (Fontjin et al., 1970; Ridley and Howlett, 1974). Briefly, it is based on the chemiluminescent reaction of NO with O3
to form electronically excited NO2, which fluoresces at
vis-ible and near infrared wavelengths. The technique is sim-ple and relatively reliable. The detection sensitivity ben-efits from small background signal levels because no light source is necessary to initiate the fluorescence. Only an O3
-generating lamp and a modestly cooled photomultiplier (typ-ically ∼−4◦C) are required; thus CL NOxmonitors are
rel-atively inexpensive. Calibration involves the sampling of a known standard to determine the absolute response of the in-strument; such standards are readily acquired. CL NOx
mon-itors typically operate in a mode that alternates between two
states: one that measures the concentration of NO by sam-pling ambient air directly, and one that measures the sum of NO and NO2 by passing the ambient air stream over a
cat-alyst (usually gold or molybdenum oxide, often heated) to convert NO2to NO. The difference of the two values is
re-ported as the NO2concentration. Although instruments are
available that utilize a flash lamp or laser to convert NO2to
NO, this study only examines CL NOxmonitors with
molyb-denum oxide catalysts, which are the most prevalent type (Parrish and Fehsenfeld, 2000).
In addition to the advantages of CL NOxmonitors listed
above, however, there are known interferences for this stan-dard technique (see several recent reviews (Cavanagh and Verkouteren, 2001; Demerjian, 2000; Environmental Pro-tection Agency, 1993; McClenny et al., 2002; Parrish and Fehsenfeld, 2000; Sickles, 1992)). The most significant is-sue with standard CL NOxmonitors is their inability to
di-rectly and specifically detect NO2. It has been well
estab-lished that other gas phase nitrogen containing compounds are converted by molybdenum oxide catalysts to NO and therefore can be reported as NO2 by a standard CL NOx
monitor (Winer et al., 1974). As stated by the US EPA, “chemiluminescence NO/NOx/NO2 analyzers will respond
to other nitrogen containing compounds, such as peroxy-acetyl nitrate (PAN), which might be reduced to NO in the thermal converter. Atmospheric concentrations of these po-tential interferences are generally low relative to NO2 and
valid NO2 measurements may be obtained. In certain
ge-ographical areas, where the concentration of these poten-tial interferences is known or suspected to be high relative to NO2, the use of an equivalent method for the
measure-ment of NO2 is recommended.” (Environmental
Protec-tion Agency, 2006) AddiProtec-tionally, manufacturers now use this same technology to make total reactive nitrogen (NOy)
mea-surements. Molybdenum oxide catalysts are known to effi-ciently reduce compounds such as NO2, NO3, HNO3, N2O5,
CH3ONO2, CH3CH2ONO2, n-C3H7ONO2, n-C4H9ONO2,
and CH3CHONO and to a lesser extent also reduce HO2NO2,
HONO, RO2NO2, NH3and particulate phase nitrate. These
catalysts do not efficiently reduce N2O, HCN, CH3CN or
CH3NO2at typical operating converter temperatures lower
than 400◦C (Fehsenfeld et al., 1987; Williams et al., 1998). To emphasize this point, consider that the only difference be-tween CL NOxand NOymonitors is the position of the
cat-alyst: in a CL NOymonitor, the catalyst is placed very close
to the front of sampling inlet so as to convert all NOyspecies,
whereas in a CL NOxmonitor, the catalyst is placed after a
particulate filter and just before the detection chamber, allow-ing the conversion and detection as “NO2” of any gas phase
nitrogen containing compounds not removed by passive loss on surfaces upstream of the converter.
Other more specific NO2detection techniques have been
developed, including a photolysis technique to specifically convert NO2to NO that avoids using a metal catalyst while
McFarland, 1980), an LIF technique (Thornton et al., 2000; Thornton et al., 2003), a fast gas chromatography luminol chemiluminescence detection (Marley et al., 2004), Differen-tial Optical Absorption Spectroscopy (DOAS) (Platt, 1994; Platt and Perner, 1980), cavity ring down (Osthoff et al., 2006) and a Tunable Infrared Laser Differential Absorption Spectroscopy (TILDAS) technique (Li et al., 2004) (also de-scribed below). Several recent reviews provide a more com-plete description of these and other NO2measurement
tech-niques (Demerjian, 2000; McClenny et al., 2002; Parrish and Fehsenfeld, 2000). Although several of these instru-ments have been shown to perform well in intercomparisons (Fehsenfeld et al., 1990; Gregory et al., 1990; Osthoff et al., 2006; Thornton et al., 2003), the majority of these techniques are, at this time, research grade instruments unsuitable for use in routine monitoring. A newer technique, Cavity At-tenuated Phase Shift (CAPS) spectroscopy, has shown the potential to provide accurate spectroscopic measurements of NO2 (0.3 ppb detection limit in <10 s) at a reasonable cost
(Kebabian et al., 2005), but it is still in the development phase. Even if these other techniques gain prevalence in the coming years, the current widespread use of CL NOx
mon-itors makes understanding and quantifying interferences to this technique critical. Recent field studies have begun to quantify the magnitude of interferences to this technique, for example (Li et al., 2004) have shown a consistent positive measurement bias from CL NOxmonitors relative to an
ab-solute TILDAS measurement of NO2. Additionally,
Stein-bacher et al. (2007) have shown a persistent bias in CL NOx
monitors with molybdenum oxide converters over a time pe-riod of more than 10 years at rural locations in Switzerland. However, our study is one of the first field intercomparisons to directly quantify this interference and characterize the spe-cific compounds responsible for it.
Our study uses data from the recent Mexico City Metropolitan Area (MCMA) field campaign during April of 2003 (MCMA-2003), which featured a comprehensive suite of both gas and particle phase instrumentation from numer-ous international laboratories, including multiple measure-ments of NO2 (Molina et al., 2007). Here, we utilize this
unique data set to evaluate the performance of standard CL NOx monitors in a heavily polluted urban atmosphere,
ex-amine possible interferences and make recommendations for monitoring networks in general. Data from an exploratory field mission in the MCMA during February of 2002 are also presented. The meteorology during these campaigns has been discussed in detail elsewhere (de Foy et al., 2005; Molina et al., 2007).
2 Measurements
A major part of the MCMA-2002 and 2003 campaigns was the deployment of the Aerodyne Research, Inc. Mobile Lab-oratory (ARI Mobile Lab), a van equipped with a
compre-hensive suite of research grade gas and particle phase instru-mentation (Herndon et al., 2005a; Kolb et al., 2004). The ARI Mobile Lab had two modes of operation during the cam-paigns: mobile and stationary. In mobile mode, the main ob-jectives were either sampling of on-road vehicle exhaust or mapping of emission sources. In stationary mode, the ARI Mobile Lab was parked a chosen site, typically making mea-surements for several days in a row. Stationary mode data in this study will be presented from four sites from the 2002 and 2003 field campaigns, which are described in detail else-where (Dunlea et al., 2006); briefly they are (1) CENICA (Centro Nacional de Investigacion y Capacitacion Ambien-tal) – the “supersite” for the MCMA-2003 campaign located on a university campus to the south of the city center, which receives a mix of fresh pollution from area traffic corridors and aged pollution from more downtown locations, (2) La Merced – a downtown location near an open market and a large traffic corridor, (3) Pedregal – an affluent residential neighborhood downwind of the city center, and (4) Santa Ana – a boundary site outside of the city, which receives mostly aged urban air during the day and rural air overnight.
The instruments on board the ARI Mobile Lab most rel-evant to this study were a TILDAS NO2 instrument and
a standard CL NOx monitor. The TILDAS technique for
measuring NO2 has been described in detail elsewhere (Li
et al., 2004) and only a brief description is presented here. TILDAS is a tunable infrared laser differential absorption measurement that employs a low volume, long path length astigmatic Herriott multipass absorption cell (McManus et al., 1995) with liquid nitrogen cooled laser infrared diodes and detectors. The laser line width is small compared to the width of the absorption feature and the laser frequency position is rapidly swept over an entire absorption feature of the molecule to be detected, NO2 in this case.
Accu-rate line strengths, positions and broadening coefficients are taken from the HITRAN data base (Rothman et al., 2003). Reference cells containing the gas of interest are used to lock the laser frequency position. Of the species in the HITRAN database in the NO2ν2wavelength region (1600 cm−1), the
next strongest absorber (CH4) has nearby absorption lines
which are six orders of magnitude weaker than the NO2lines
used in these measurements. Additionally, the CH4lines are
frequency shifted away from the main NO2features and this
is resolved with the typical linewidth of the lead salt diode lasers used. Therefore, the measurements of NO2 by
tun-able diode laser spectroscopy are believed to be interference-free. The mode purity of the diode was verified by mea-suring ’black’ NO2 lines in a reference cell along another
optical path present in the instrument. The absolute accu-racy of the concentrations measured by TILDAS is largely determined by how well the line strengths are known. For the absorption lines used in the two instrument channels, measuring NO and NO2respectively, the presently accepted
band strengths are known to within 6% for NO and 4% for NO2 (Smith et al., 1985). It is important to note that this
technique is an absolute concentration measurement, which does not require a calibration, and thus served as the bench-mark against which to compare other NO2measurements. In
general, calibrations in the field do greatly improve the con-fidence in the measurement and assist in evaluating the over-all performance of the instrument. Though field calibrations have become routine now, via permeation sources and gas cylinders on the Mobile Lab platform, they were not done during the MCMA-2003 field campaign. On the particular instrument that did go to MCMA-2003, however, the second channel of the instrument was used to measure HCHO (Gar-cia et al., 2006; Herndon et al., 2005b); calibrations for this species demonstrated the pathlength was correct, and labo-ratory measurements of the pathlength using a pulsed light source indicate the cell was correctly aligned. Fortunately, for NO2measurements, the spectroscopy (and potential other
absorbers) near 1600 cm−1is fairly well understood by virtue of being used so commonly.
Standard CL NOxmonitors have been described above and
here we briefly describe the calibrations performed during the MCMA-2003 campaign. The standard calibration pro-cedure involves zeroing the monitors while measuring NOx
-free air and then adding several specified amounts of NO to the instrument covering the desired operating range. The CL NOxmonitor on board the ARI Mobile lab was calibrated six
times during the campaign, utilizing several different stan-dardized mixtures of NO in nitrogen and NO/CO/SO2 in
nitrogen and resulting in no greater than an 8% deviation. Early in the campaign, technicians from RAMA, Red Au-tom´atica de Monitoreo Ambiental (RAMA, 2005), calibrated both the CL NOxmonitor on board the Mobile Lab and the
one on the CENICA rooftop during the same afternoon for consistency. RAMA operates 32 monitoring sites around the MCMA, many of which are equipped with standard CL NOx
monitors, all of which are calibrated via this same method. The RAMA network has been audited by the US EPA (Envi-ronmental Protection Agency, 2003), and was concluded to be “accurate and well-implemented”.
For the discussion below, it is important to establish that ambient concentrations of O3do not interfere with measured
NO2 concentrations from a CL NOx monitor. O3 levels
within the detection chamber of these CL NOxmonitors are
three orders of magnitude higher than ambient levels (Shiv-ers, personal communication, 2004); thus ambient O3levels
will not significantly influence the detection of NO in the CL NOxmonitors. The difference in residence time in the
sam-pling lines to the CL NOxmonitor compared to the TILDAS
instrument was small enough (<3 s) to preclude the reaction of ambient NO with ambient O3 from contributing
signifi-cantly to the measured differences in NO2concentrations.
For this study, measurements from the ARI Mobile Lab are used in conjunction with measurements from instruments at the various stationary sites. The instrumentation at the CENICA site included two long-path DOAS (LP-DOAS) in-struments (Platt, 1994; Platt and Perner, 1980; Volkamer et
al., 1998) which measured NO2 amongst a suite of other
compounds. The detection limits for NO2 were 0.80 and
0.45 ppb for DOAS-1 and DOAS-2 respectively. The La Merced site also included side-by-side open path Fourier transform infrared (FTIR) and DOAS instruments (Grut-ter, 2003). Both instruments measured numerous gas-phase compounds, but only data from the FTIR measurement of nitric acid (HNO3; detection limit of 4 ppb) and from the
DOAS measurement of NO2 (detection limit of 3 ppb) are
shown here. See companion paper (Dunlea et al., 2006) for more details on these stationary sites, including information about the inlets used for various measurement locations.
Additional measurements are presented here from Aero-dyne Aerosol Mass Spectrometers (AMSs) (Jayne et al., 2000) that were on board the ARI Mobile lab and on the roof of the CENICA building. The AMS measures the size-resolved chemical composition of the non-refractory com-ponent of ambient particles smaller than 1.0 µm, including particulate phase nitrate (pNO−3).
3 Results and discussions
3.1 Observation of interference
Simultaneous measurements of NO2on board the ARI
Mo-bile Lab by the CL NOxmonitor and the TILDAS instrument
revealed a recurring discrepancy where the CL NOxmonitor
reported a higher NO2 concentration than the TILDAS
in-strument. We consider the TILDAS measurement to be an absolute concentration measurement and thus this discrep-ancy is concluded to be an interference in the CL monitor. We define this “CL NOx monitor interference” as the CL
NOxmonitor NO2measurement minus a co-located
spectro-scopic NO2measurement.
CL NOxmonitor interference=
[NO2](CLmonitor)−[NO2](spectroscopic) (1)
Figure 1 shows the CL NOx monitor interference as
ob-served during specific periods in both the 2002 and 2003 field campaigns. The periods in Fig. 1 are typical of the observa-tions during both campaigns. The CL NOxmonitor
interfer-ence was observed to occur daily, peaking in the afternoons during periods when ambient O3 levels were highest. The
CL NOxmonitor interference accounted for as much as 50%
of the total NO2concentration reported by the CL NOx
mon-itor (30 ppb out of a reported 60 ppb for the 2002 campaign and 50 ppb out of 100 ppb for the 2003 campaign). The in-terference was observed at all fixed site locations visited by the ARI Mobile Lab, but was more readily detectable at the urban sites than the Santa Ana boundary site, owing simply to the lower overall NO2levels at the boundary site.
Addi-tionally, this CL NOxmonitor interference was present when
comparing DOAS long path measurements of NO2 to CL
these sites, the CL NOxmonitor interference was more
vari-able in time owing to the loss of spatial coherence when com-paring a long path measurement with a point sampling data for a reactive species (for further discussion of open path ver-sus point sampling comparison, see Dunlea et al. (2006) and San Martini et al. (2006a)).
The observation of such large CL NOx monitor
interfer-ence levels directly contradicts previous conclusions that this will only be an issue at rural or remote locations (Jenkin, 2004b). In summary, the CL NOxmonitor interference was
observed to occur regularly and to roughly correlate with the ambient O3 concentration; the subsequent section will
ex-plore the cause of this interference in more detail. 3.2 Examination of possible sources of interference Potential sources for the interference in the chemilumines-cence NO2 measurement using the available data from the
MCMA 2003 campaign are explored: (1) some portion of the non-NOxfraction of reactive nitrogen (NOz) and (2) gas
phase olefinic hydrocarbons or gas phase ammonia. 3.2.1 The Non-NOxFraction of Reactive Nitrogen (NOz)
It has been long established that molybdenum converters within standard CL NOxmonitors have a potential
interfer-ence in the NO2measurement due to gas phase reactive
ni-trogen compounds (Demerjian, 2000; Environmental Protec-tion Agency, 2006; Parrish and Fehsenfeld, 2000). The ARI Mobile Lab as configured for the MCMA-2003 campaign in-cluded a total NOyinstrument (TECO 49C), which measures
both NOyand NO using the chemiluminescence technique,
but configured differently than a standard CL NOxmonitor
so as to purposely exploit the molybdenum converter’s abil-ity to detect more gas phase reactive nitrogen species. From the CL NOymonitor NOyand NO measurements, along with
the TILDAS NO2measurement, we calculated the non-NOx
fraction of NOy, referred to as NOz. Table 1 lists the results
of linear least-squares fits of the correlation plots of the CL NOx monitor interference versus NOz at the various
loca-tions visited by the ARI Mobile Lab. The CL NOxmonitor
interference level varied linearly with the NOzconcentration,
and was smaller in magnitude, indicating that some portion of NOz was responsible for the interference. Fair to good
correlation (R2=0.32–0.79) was observed at all sites visited by the ARI Mobile Lab, with ratios of the CL NOxmonitor
interference to NOz=(0.44–0.66). Thus, the obvious and
ex-pected conclusion is that some reactive nitrogen compound or compounds are the cause of the observed CL NOx
moni-tor interference.
This type of comparison has a number of inherent limita-tions. Negative values for the CL NOxmonitor interference
are often recorded because this calculated value is the sub-traction of two measurements. In general, more variance in this subtracted quantity is expected when an open path
spec-(b) (a)
Fig. 1. (a) Time series of NO2measurements by standard CL NOx
monitor and TILDAS spectroscopic instruments on board ARI Mo-bile Lab at the Pedregal fixed monitoring site during 2002 campaign for a specific period highlighting when the chemiluminescence in-strument showed an interference. (b) Time series for one-minute averaged measurements made on board ARI Mobile Lab at the Pe-dregal fixed monitoring site during MCMA-2003 field campaign for a specific period. The CL NOxmonitor interference is plotted on its
own axis in this figure to show the correlation in time with ambient O3levels, which indicates a photochemical source of the interfering
compound(s).
troscopic measurement is subtracted from a point sampling CL NOx monitor measurement, limiting the achievable R2
values for these correlation plots. We also note here that the onset of the daily rise of the CL NOxmonitor at CENICA is
delayed relative to the other three sites by ∼2 h: from 10 AM onset elsewhere to 12 PM onset at CENICA. CENICA also experiences the highest percentage of negative CL NOx
mon-itor interference measurements indicating that the open path DOAS light paths may be influenced by NOxsources, such
as roadways underneath the light paths, which do not advect to the CENICA rooftop sampling location. San Martini et
Table 1. Slopes of linear least squares fit of correlation plots of observed CL NOxmonitor interference versus other measured species at
series of locations. R2values for fits are given in parentheses. All concentrations for correlation plots are 15 min averages and are reported in ppb or equivalent ppb. Maxima, minima, and averages for slopes are listed. Abbreviations: NA = measurement data Not Available at particular location, ID = Insufficient Data available at particular location, ML = data from ARI Mobile Lab in stationary mode, Roof = long path instruments at fixed site locations. Stationary sites are: STA = Santa Ana, PED = Pedregal, MER = La Merced and CEN = CENICA headquarters; see text for description. NOz, O3and HNO3are highlighted as showing the best correlations.
Species Correlated with CL ML STA ML PED ML MER ML CEN Roof CEN Roof MER Min Max Avg NOxMonitor Interference
PTRMS Olefin Proxy m/z 71 1.19 (0.05) −1.56 (0.03) −0.86 (0.03) ID NA NA −1.56 1.19 −0.41 PTRMS Olefin Proxy m/z 43 0.36 (0.12) −0.2 (0.01) −0.15 (0.06) ID NA NA −0.2 0.36 0.00 FIS Monitor Total Olefins NA NA NA −0.13 (0.04) −0.15 (0.32) NA −0.15 −0.13 −0.14 NH3 −0.03 (0.03) 0.34 (0.04) −0.06 (0.17) 0.14 −0.05 (0.01) 0.49 (0.01) −0.06 0.49 0.14
PAN NA NA NA ID 4.07 (0.09) NA 4.07
AMS Particulate Nitrate 2.44 (0.15) 1.74 (0.12) −0.44 (0.01) 1.68 (0.01) 0.28 (0.01) NA −0.44 2.44 1.14
NOz 0.54 (0.65) 0.66 (0.79) 0.44 (0.32) 0.49 (0.35) NA NA 0.44 0.66 0.53
O3 0.06 (0.30) 0.09 (0.54) 0.09 (0.19) ID 0.11 (0.21) 0.15 (0.21) 0.06 0.19 0.10
HNO3 NA NA NA NA NA 1.83 (0.44) 1.83
al. (2006b) have discussed the limitations of this NOz
mea-surement in more detail.
As shown in Figs. 1 and 3, the CL NOx monitor
inter-ference peaked in magnitude during the afternoons, corre-sponding to peaks in the ambient O3 concentration. The
CL NOx monitor interference shows a fair correlation with
the co-located measured O3 concentration at all locations
(R2=0.19–0.54); see Fig. 2 and Table 1. The magnitude of the CL NOxmonitor interference concentration was
approx-imately 10% of the ambient O3concentration. We have
es-tablished above that ambient O3does not represent an
inter-ference to the NO2measurement; this is further corroborated
by the poor correlation of the measured CL NOx monitor
interference with the product of ambient concentrations of [NO]*[O3] (regression R2=0.03). Thus, we conclude that
the CL NOxmonitor interference was primarily due to
re-active nitrogen species that are produced photochemically along with O3.
We now examine the individual species that make up NOz in order to determine the most likely contributors to
the CL NOx monitor interference. We start by removing
from consideration those reactive nitrogen species which are not converted by the molybdenum oxide catalyst, e.g., amines (Winer et al., 1974), or whose concentrations do not peak during the afternoon, specifically nitrous acid (HONO), other organic nitrites, the nitrate radical (NO3) and N2O5.
HONO was measured directly by the DOAS instrument at the CENICA supersite and observed to have its highest con-centrations during the morning. Other organic nitrites are unlikely to have concentrations that approach ppb levels and will have photolytic loss rates that maximize in the afternoon, making it very unlikely that they could contribute signifi-cantly to the observed CL NOxmonitor interferences. Lastly,
measured concentrations of NO3and N2O5are observed
al-most exclusively at night, excluding them from possible
con-tribution to the observed daytime interference. Thus, our most likely candidates are (a) particulate nitrate, (b) peroxy-acetyl nitrate and other peroxyacyl nitrates, (c) nitric acid (d) alkyl and multifunctional alkyl nitrates and (e) a combination of more than one of these species.
(a) Particulate phase nitrate (pNO−3) may be converted by
the CL NOxmonitor and reported as NO2if sufficiently
par-ticles penetrate the particulate filter on the CL NOxmonitor
to reach the molybdenum oxide converter. The particulate filter on a CL NOxmonitor typically filters out particles with
diameters larger than 200 nm. Measurements from MCMA-2003 with two AMS instruments reveal that only a small frac-tion of the particle mass was found to be contained in parti-cles with diameters <200 nm (Salcedo et al., 2006). Thus, of the measured levels of submicron pNO−3, only a small frac-tion would be expected to enter a CL NOx monitor
result-ing in a potential interference. Additionally, the dissociation of particulate NH4NO3to gas phase HNO3from either the
filter or surfaces within the instrument and/or sampling line could contribute to this interference. None of the inlets for the NO2 instruments listed in the experiment section were
heated, such that this effect is likely to have been minimal. Thus, we do not expect pNO−3 do contribute significantly to the CL NOxmonitor interference.
This is confirmed by comparing the diurnal profiles of pNO−3 and the CL NOx monitor interference (Fig. 3); con-centrations of submicron pNO−3 (as converted to its equiva-lent gas phase concentration) were significantly smaller than the CL NOx monitor interference and peaked a few hours
before the maximum in the CL NOx monitor interference.
Table 1 reports only a weak correlation (R2<0.15) of the CL
NOx monitor interference with the measured ambient
sub-micron pNO−3 levels for all sites. Overall, it is clear that pNO−3 does not contribute significantly to the observed CL NOxmonitor interference in Mexico City.
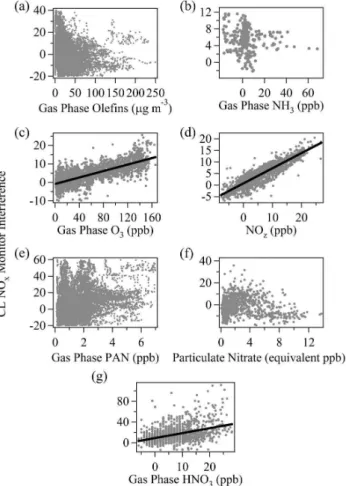
Fig. 2. Linear regression plots for the CL NOxmonitor interference
plotted versus (a) gas phase olefins (CENICA), (b) gas phase NH3
(Santa Ana), (c) gas phase O3(Pedregal), (d) NOz(Pedregal), (e)
gas phase PAN (CENICA), (f) particulate nitrate (La Merced), and (g) gas phase HNO3(La Merced). See text for description of
mea-surements. Results of the linear regressions are listed in Table 1.
(b) Peroxyacetyl nitrate (PAN) is often found in large quantities in urban atmospheres and concentrations >30 ppb have been observed in the past in Mexico City (Gaffney et al., 1999) The MCMA-2003 field campaign included a PAN measurement at the CENICA supersite (Marley et al., 2007) reveling much lower PAN concentrations (maximum
<15 ppb) that peak in mid-morning (Fig. 3b); this does not
match the diurnal pattern of the CL NOx monitor
interfer-ence. The results of the correlation plots of the CL NOx
mon-itor interference versus the measured PAN concentrations on the CENICA rooftop show an R2=0.09. Modeling studies of the outflow of pollution from Mexico City (Madronich, 2006) and more recent measurements downwind of the city (Farmer, D. K., Wooldridge, P. J., and Cohen, R. C., per-sonal communication, 2006) show that peroxyacyl nitrate compounds can account for a significant fraction of the NOz
budget in the outflow from Mexico City. Although PAN is known to be converted to NO2 on heated surfaces, and as
such, PAN may contribute more significantly to this interfer-ence in other locations that experiinterfer-ence higher PAN concen-trations, we conclude that PAN does not contribute signifi-cantly to the observed CL NOxmonitor interference in this
study because of its low ambient concentrations.
(c) Nitric acid (HNO3) is photochemically produced
within urban atmospheres and has been observed in signifi-cant concentrations in Mexico City (Moya et al., 2004). Pro-duction of HNO3is generally on the same time scale as
pro-duction of O3, since both involve the formation of NO2. O3
is formed when NO2photolyzes via a two step process:
NO2+hν → NO + O (2)
O + O2+M → O3+M (3)
(where M represents a third body colliding molecule, pre-sumably N2 or O2). HNO3is formed from the association
reaction of OH with NO2
NO2+OH + M → HNO3+M (4)
The measured concentrations of NO2 and OH
dur-ing MCMA-2003 (Volkamer et al., 2005) indicate that HNO3 production rates via reaction (4) are quite large
(>15 ppb hr−1 at maximum). However, losses for HNO3
within an urban area are also significant, and the ambient concentration depends on the balance between the produc-tion and loss rates. In the presence of NH3, HNO3will
read-ily form particle phase ammonium nitrate (NH4NO3). HNO3
is also readily lost on surfaces by dry deposition (Neuman et al., 1999), but there is a large range of deposition velocities in the literature (4–26 cm s−1) and an exact loss rate is difficult
to estimate (Neuman et al., 2004; Wesely and Hicks, 2000). It is thus preferable to rely on measurements of HNO3 as
much as possible. During the MCMA-2003 campaign, the only direct HNO3 concentration measurements were from
the open path FTIR operated by the UNAM group at the La Merced site (Flores et al., 2004; Moya et al., 2004). Al-though the measured HNO3concentrations show reasonably
good correlation with the CL NOxmonitor interference
con-centrations (R2=0.44), the slope of the correlation plot (1.41) indicates that HNO3accounts for ∼60% of the CL NOx
mon-itor interference.
For the locations that did not have a measurement of HNO3, we use modeled values to estimate the possible
con-tribution of HNO3to the CL NOx monitor. San Martini et
al. (2006a, b) have used an ISORROPIA model embedded in a Markov Chain Monte Carlo algorithm to analyze aerosol data and to predict the gas phase HNO3concentrations at the
locations included in this study. Diurnal profiles of these pre-dicted HNO3concentrations are included in Fig. 3. In
gen-eral, HNO3 levels are shown to be large enough to account
for the measured CL NOxmonitor interference. However, we
note that the measured HNO3concentrations at La Merced
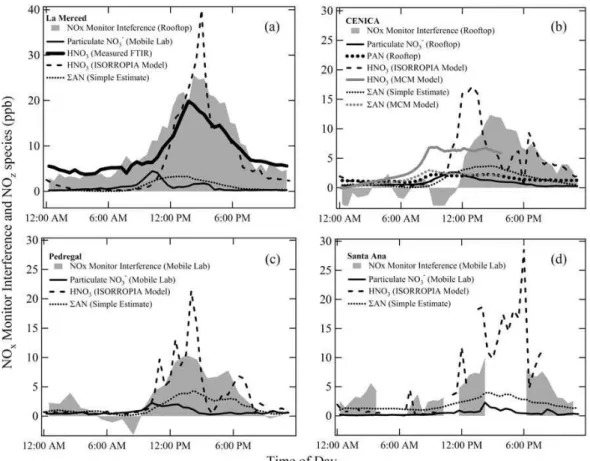
Fig. 3. Diurnally averaged profiles for measured CL NOxmonitor interference, calculated alkyl nitrate concentrations, measured PAN
concentrations and measured particulate nitrate in equivalent gas phase concentration as observed at the four fixed sites. Note that only a small fraction of particulate nitrate mass, from particles with diameters <200 nm, could potentially contribute to the NOxmonitor interference.
Time of day is for local time. Profiles averaged over the entire MCMA-2003 campaign where possible; exceptions are for Mobile Lab data which were available for several day periods while the Mobile Lab was at particular fixed locations (see text). Gaps in profiles are due to limited data.
conclude that HNO3 accounts for most, but not all, of the
observed CL NOxmonitor interference.
As an added complication, HNO3 is efficiently lost on
stainless steel and other surfaces (Neuman et al., 1999). The efficiency with which HNO3 will reach the molybdenum
converter within a particular CL NOxmonitor is then
depen-dent on the amount of stainless steel surface area in the inlet manifold, and thus unique to each monitor. Thus, it is not possible to easily extrapolate this result to all CL NOx
mon-itors. We generally conclude, however, that HNO3accounts
for a significant portion of the CL NOxmonitor interference.
(d) Alkyl and multifunctional organic nitrates (from hereon referred to as “alkyl nitrates”) are known to be pro-duced simultaneously with O3from the minor branch (5b) of
the reaction of NO with peroxy radicals (Day et al., 2003; Rosen et al., 2004; Trainer et al., 1991).
RO2+NO → NO2+RO (5a)
RO2+NO + M → RONO2+M (5b)
There were no direct measurements of alkyl nitrates as part of the MCMA-2003 campaign of which we are aware. In-stead, to study the formation of alkyl nitrates (and HNO3),
we employ a flexible top photochemical box model, which was constrained by measurements conducted at the CENICA supersite for OH sources and sinks from VOC and NOx.
Model simulations were performed with the Master Chem-ical Mechanism (MCMv3.1) (Jenkin et al., 2003; Saunders et al., 2003) on a 24-h basis constrained with 10-minute av-eraged measurements of major inorganic species (NO, NO2,
HONO, O3and SO2), CO, 102 volatile organic compounds
(VOC), HOx(=OH+HO2) measurements, temperature,
pres-sure, water vapor concentration, photolysis frequencies, and dilution. MCMv3.1 is a near-explicit mechanism, i.e. with minimized lumping of VOC reaction pathways, and thus well suited for source-apportionment of organic nitrates and HNO3 (Sheehy et al., 20071). Figure 3 shows the diurnal 1Sheehy, P. M., Volkamer, R. M., Molina, L. T., and Molina,
profile of the modeled concentrations of alkyl nitrates and HNO3from the MCM model. Note that the model does not
account for horizontal transport and thus modeled concentra-tions of stable species begin accruing above realistic values after 4 PM local time due to planetary boundary layer dy-namics.
Preliminary results from observations from a recent field campaign in 2006 (Farmer, D. K., Wooldridge, P. J., and Cohen, R. C., personal communication, 2006) as well as modeling of the outflow of pollution from Mexico City (Madronich, 2006) show that the sum of all alkyl nitrates,
6AN, comprises roughly (10–30)% of NOz in the outflow
of Mexico City. Additionally, preliminary results from air-craft measurements of alkyl nitrates made during this same field campaign confirm the presence of alkyl nitrates in the outflow from Mexico City (Blake, D. R. and Atlas, E. L., per-sonal communication, 2006). Alkyl nitrates are thus a non-negligible part of the NOzbudget.
For the locations where measurements of OH and other radicals were not available to constrain the MCM model, we make simple estimates of the alkyl nitrate concentrations based on the measured [O3]. Using the notation of Day et
al. (2003), the branching ratio for the formation of an alkyl nitrate in channel (5b) is defined as α. A general correla-tion of alkyl nitrates with O3 is expected because both are
photochemically generated in the atmosphere. Subsequent reactions of the alkoxy radical (RO2) in channel (5a) with
O2lead to the formation of an HO2molecule which reacts
to form a second NO2molecule, which then produces O3via
reactions (2) and (3) above. Thus, for each reaction of RO2
with NO in reaction (5), there is either the formation of one alkyl nitrate or two O3molecules. As a result, the slope of a
plot of ambient [O3] versus calculated [6AN] is 2(1−α)/α.
We use this relationship to make a simple estimate of [6AN] based on the measured [O3].
We estimate a value for α within Mexico City (αMCMA)
based on the measured volatile organic carbon (VOC) speci-ation. The MCMA-2003 campaign included numerous mea-surements of the overall VOC loading and speciation thereof (Velasco et al., 2007). Using average speciated VOC con-centrations as measured during the campaign and measure-ments and/or estimates for the branching ratios for chan-nel (5b) of the individual VOC compounds, we calculate
αMCMA in a similar manner to the calculations of Rosen et
al. (2004) for La Porte, Texas. The ambient VOC mix in Mexico City is heavily dominated by propane (29% by vol-ume) and lighter alkanes (≤C5, 25%), with additional con-tributions from alkenes (9%), aromatics (8%), heavier alka-nes (8%), acetylene (3%) and MTBE (2%), with 15% of the VOC loading left as unidentified. This unidentified portion of the VOC mixture most likely consists of oxygenated VOCs, with branching ratios for reaction (5b) similar to the analo-(MCMA): Modeling ROx Using a Detailed Mechanism, to be sub-mitted, 2007.
gous alkanes and alkenes. We assume a value of α for this unidentified portion of the VOC loading equal to the aver-age of the identified VOCs. We then weight the value of α for each VOC compound by its OH reactivity to determine a best estimate for αMCMA=0.063. Multiplying the measured
[O3] by this αMCMAgives a time series of the estimated total
concentration of alkyl nitrates, [6AN], for the various loca-tions in this study. Diurnal profiles of the estimated [6AN] are shown in Fig. 3. This simple estimate reveals maxima in [6AN] of nearly 5 ppb, which are as large as the largest observed [6AN] in other locations (Rosen et al., 2004). Al-though ambient VOC concentrations in MCMA are larger than in other urban locations, the MCMA VOC speciation is dominated by light alkanes that do not form alkyl nitrates as readily as longer chain VOCs. For the CENICA supersite, the MCM modeled profile of alkyl nitrates shows a maximum value in the morning, while this simple estimate based on the measured [O3] shows a peak in afternoon (corresponding to
the peak in the O3 concentration). This is likely due to the
suppression of O3 concentrations at the CENICA site
dur-ing the morndur-ing hours due to nearby NOxsources mentioned
earlier. Overall, the simple estimate provides a rough gauge to the magnitude of [6AN] expected in a given location.
(e) From the previous sections, we have concluded that HNO3and alkyl nitrates contribute to the CL NOxmonitor
interference in Mexico City. There is an observable trend in going from “fresh” to “aged” sites, where the contribu-tion of alkyl nitrates relative to the magnitude of the CL NOx
monitor increases moving from the sites in closest proximity to high emissions levels (La Merced and then CENICA) to the sites that are furthest away from large emission sources (Pedregal and then Santa Ana). The estimated [6AN] is roughly constant at all locations such that the decreasing magnitude of the CL NOxmonitor interference in going from
fresh to aged sites is explained by decreasing amounts of HNO3, i.e., as the air parcel ages, HNO3 is lost from the
gas phase to either particulate nitrate or via dry deposition. If we examine the La Merced (the “freshest” site), the sum of the measured HNO3and the estimated 6AN results in a
significantly better agreement of the linear correlation plot (slope=0.97, R2=0.53). The diurnal profile shown in Fig. 4 closely matches that of the interference. In summary, we conclude that close to the sources of the emissions, the com-bination of HNO3and 6AN account for the CL NOx
moni-tor interference, and as the urban air parcel ages, 6AN com-prises a larger percentage of the interference.
3.2.2 Gas phase olefins and ammonia
The chemiluminescent reaction of ambient gas phase olefins with excess O3 within the CL NOxmonitor reaction
cham-ber, where the resulting fluorescence is recorded as NO2, is
a potential interference to the CL NOx monitor. However,
no correlation of the measured CL NOxmonitor interference
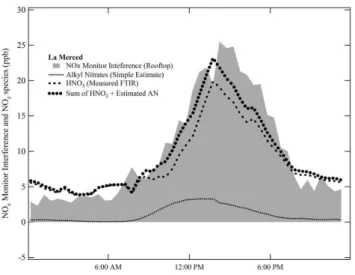
Fig. 4. Diurnally averaged profiles for measured CL NOxmonitor
interference, measured HNO3concentrations and calculated alkyl
nitrate concentrations at La Merced site. Profiles averaged over the entire MCMA-2003 campaign. Also included is a profile of the sum of the measured HNO3concentration plus the estimated alkyl
nitrate concentration (see text). Time of day is for local time.
MCMA-2003 field campaign from either a Proton Transfer Reaction Mass Spectrometer (PTRMS) on board the ARI Mobile Lab (Rogers et al., 2006) or a Fast Isoprene Sensor (FIS) at the CENICA supersite (Velasco et al., 2007). Re-sults from the linear correlation plots are listed in Table 1. The daily peak in the olefin levels was observed during the morning hours, which does not coincide with the afternoon peak in the CL NOxmonitor interference.
Another possibility for the cause of the CL NOxmonitor
interference is gas phase ammonia (NH3), which has been
shown to be converted by molybdenum oxide catalysts with an efficiency somewhere between a few percent (Williams et al., 1998) and 10% (Shivers, personal communication, 2004). A TILDAS system utilizing a Quantum Cascade Laser (QCL) to monitor gaseous ammonia was deployed on board the ARI Mobile Lab for the MCMA-2003 campaign. Measured ambient NH3concentrations were not sufficient to
account for the observed CL NOxmonitor interferences
(typ-ical [NH3]<30 ppb) and NH3concentrations peaked during
the morning before the break up of the boundary layer (ear-lier than 11 AM local time), indicating a significant source from automobiles (San Martini et al., 2006a), which does not correspond to the afternoon maxima in the CL NOx
moni-tor interference. The slopes of correlation plots of the CL NOxmonitor interference versus the measured NH3
concen-trations were less than 0.34 and R2 values did not exceed
0.17, indicating no significant correlation (see Table 1). Based on these observations, we conclude that neither gas phase olefins nor ammonia contributed significantly to the observed CL NOxmonitor interference.
3.3 Impact of CL NOxmonitor interference
The CL NOx monitor interference has been shown to
ac-count for up to 50% of the measured NO2 concentration in
Mexico City; interferences of this order could impact the non-attainment status of urban areas. The diurnal profile of the CL NOxmonitor interference peaks in the afternoon
when NO2 concentrations are relatively low, impacting
an-nual standards for NO2, such as those used by Canada and
the United States (Demerjian, 2000), more so than daily 1-h maxima standards. For t1-he MCMA-2003 campaign, t1-he averaged NO2concentration (the closest comparison to the
annual standard we can do with this data) as measured by CL NOxmonitors was higher than co-located spectroscopic
techniques by up to 22% at the four sites in this study (see Table 2). For example, the averaged NO2 concentration
measured at La Merced by the CL NOx monitor was 49.5
ppb versus 40.6 ppb measured by the co-located DOAS in-strument; the former measurement comes much closer to the 53 ppb US EPA annually averaged threshold for non-attainment (Environmental Protection Agency, 1993). (We note that our maximum observed NO2concentration in this
study for a 1-h averaged of 185 ppb was significantly lower than the Mexican air quality standard of 210 ppb for a 1-h averaged concentration (Finlayson-Pitts and Pitts, 2000).)
Air quality models require uncertainties in NO2
measure-ments of roughly ±10%. As such, the observed interferences of up to 50% are unacceptable for the proper evaluation of air quality models (McClenny et al., 2002). In the following sec-tion we make several recommendasec-tions for how to avoid this interference in the future.
4 Conclusions
It has been shown that high levels of ambient reactive nitro-gen species can lead to a severe overestimation of ambient NO2 concentrations by standard chemiluminescence
moni-tors equipped with molybdenum oxide converters. This study is one of the first to quantify this CL NOxmonitor
interfer-ence and explore its causes in detail. In Mexico City, the ob-served CL NOxmonitor interference was shown to have no
significant contribution from gas phase olefins or ammonia. The good correlation of the CL NOx monitor interference
with ambient O3and NOz concentrations and poor
correla-tion with PAN and particulate nitrate lead to the conclusion that a combination of photochemically produced gas phase nitric acid and alkyl and multifunctional alkyl nitrates is pri-marily responsible for this interference in this study. It is ex-pected that in other environments with larger ambient PAN concentrations, PAN will contribute to this CL NOxmonitor
interference even though it did not in this study. The per-centage contribution of HNO3 to the interference decreases
as the air parcel moves away from fresh emission sources. Modeling and calculations reveal that ambient alkyl nitrates
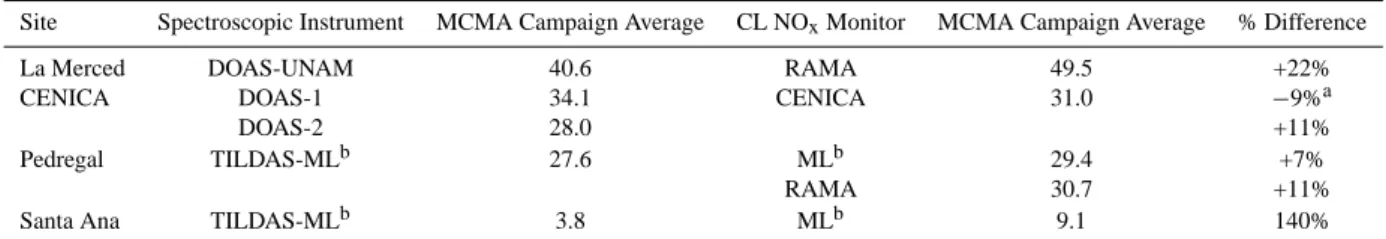
Table 2. Averaged measured NO2concentrations for 5 week MCMA-2003 campaign by spectroscopic techniques compared to co-located
CL NOxmonitors at 4 locations.
Site Spectroscopic Instrument MCMA Campaign Average CL NOxMonitor MCMA Campaign Average % Difference
La Merced DOAS-UNAM 40.6 RAMA 49.5 +22%
CENICA DOAS-1 34.1 CENICA 31.0 −9%a
DOAS-2 28.0 +11%
Pedregal TILDAS-MLb 27.6 MLb 29.4 +7%
RAMA 30.7 +11%
Santa Ana TILDAS-MLb 3.8 MLb 9.1 140%
aDOAS-1 believed to have larger NO
xconcentrations than CENICA rooftop owing to major roadway beneath the light path, see discussion
above and (Dunlea et al., 2006).
bThe ARI Mobile Lab visit each location for only a few days, which may not be a representative sample of the average NO
2concentration
at each location.
concentrations in the MCMA are significant, up to several ppb, which is as high as those observed in other urban lo-cations, and plausible given the high VOC loadings in Mex-ico City. During the MCMA-2003 field campaign, the CL NOxmonitor interference caused the average measured NO2
concentration to be larger than co-located spectroscopic mea-surements by up to 22%. This magnitude of interference is inappropriately large for use in modeling studies and may lead to a non-attainment status for NO2to be incorrectly
as-signed in certain urban areas.
To finish, we make several recommendations: (1) There exists the possibility that currently employed CL NOx
mon-itors could be retrofitted with photolytic converters to re-place molybdenum oxide converters. Such photolytic con-verters have been shown to perform well in the field (Thorn-ton et al., 2003; Williams et al., 1998). (2) In order to avoid this interference in the long term, instrument man-ufacturers should pursue low-cost, interference-free tech-niques for measuring NO2, which would significantly
im-prove the quality of data from ambient monitoring networks. These include photolytic converters and spectroscopic tech-niques, including instruments that are already on the market (www.ecophysics.com and www.dropletmeasurement.com). We are not aware, however, of any that have been thoroughly tested in a polluted urban environment. (3) CL NOx
moni-tors are capable of measuring NO reliably; rather than dis-card currently in-use CL NOx monitors, it is possible that
those instruments with molybdenum oxide converters could be configured to exploit the ability of the molybdenum oxide converter to reduce reactive nitrogen species to NO, i.e., to measure NO and NOy. As mentioned above, commercially
instruments are currently available that do just this. Moni-toring networks could then report NO and NOywith this
in-strument instead of NO and NO2. (4) Post-correction of NO2
measurements from CL NOxmonitors with molybdenum
ox-ide converters may prove effective in certain circumstances, but must be done carefully, as discussed in Steinbacher et al. (2007).
Acknowledgements. The authors would like to thank M. J. Elrod, K. Dzepina, and J. L. Jimenez for helpful discussions. Financial support from Comision Ambiental Metropolitana (Mexico), the National Science Foundation (308748, ATM-0528170 and ATM-0528227) and the Department of Energy (DE-FG02-05ER63980 and DE-FG02-05ER63982) is gratefully acknowledged. R. Volkamer is a Dreyfus Postdoctoral Fellow. J. Gaffney and N. Marley acknowledge support of the Department of Energy’s Atmospheric Science Program.
Edited by: U. P¨oschl
References
Beauchamp, J., Wisthaler, A., Grabmer, W., Neuner, C., Weber, A., and Hansel, A.: Short-term measurements of CO, NO, NO2,
or-ganic compounds and PM10 at a motorway location in an Aus-trian valley, Atmos. Environ., 38, 2511–2522, 2004.
Carslaw, D. C. and Beevers, S. D.: Investigating the potential im-portance of primary NO2emissions in a street canyon, Atmos.
Environ., 38, 3585–3594, 2004.
Carslaw, D. C. and Beevers, S. D.: Estimations of road vehicel pri-mary NO2 exhaust emission fractions using monitoring data in London, Atmos. Environ., 39, 167–177, 2005.
Cavanagh, R. R. and Verkouteren, R. M., Improving the Scien-tific Basis for Informed Decisions on Atmospheric Issues, NIST-NOAA-Industry Workshop on Atmospheric Measures and Stan-dards, National Institute of Standards and Technology, 2001. Day, D. A., Dillon, M. B., Wooldridge, P. J., Thornton, J. A.,
Rosen, R. S., Wood, E. C., and Cohen, R. C.: On alkyl nitrates, O3, and the “missing NOy”, J. Geophys. Res., 108(D16), 4501,
doi:10.1029/2003JD003685, 2003.
de Foy, B., Caetano, E., Maga˜na, V., Zit´acuaro, A., Cardenas, B., Retama, A., Ramos, R., Molina, L. T., and Molina, M. J.: Mexico City basin wind circulation during the MCMA-2003 field cam-paign, Atmos. Chem. Phys., 5, 2267–2288, 2005,
http://www.atmos-chem-phys.net/5/2267/2005/.
Demerjian, K. L.: A review of national monitoring networks in North America, Atmos. Environ., 34, 1861–1884, 2000. Dunlea, E. J., Herndon, S. C., Nelson, D. D., Volkamer, R. M.,
Mar-quez, C., Blanco, S., Cardenas, B., Kolb, C. E., Molina, L. T., and Molina, M. J.: Evaluation of Standard Ultraviolet Absorp-tion Ozone Monitors in a Polluted Urban Environment, Atmos. Chem. Phys., 6, 3163–3180, 2006,
http://www.atmos-chem-phys.net/6/3163/2006/.
Environmental Protection Agency, U.S.: Air Quality Criteria for Oxides of Nitrogen, Office of Research and Development, http: //www.epa.gov/ttn/naaqs/standards/nox/s nox index.html, 1993. Environmental Protection Agency, U.S.: Recommended Methods for Ambient Air Monitoring of NO, NO2, NOy, and Individual NOz Species, National Exposure Research Laboratory, 2001. Environmental Protection Agency, U.S.: US EPA Audit
of RAMA Network, http://www.sma.df.gob.mx/sma/download/ archivos/auditoria epa ingles.pdf, 2003.
Environmental Protection Agency, U.S.: National Ambient Air Monitoring Strategy, Office of Air Quality Planning and Stan-dards, http://www.epa.gov/ttn/amtic/files/ambient/monitorstrat/ naamstrat2005.pdf, 2005.
Environmental Protection Agency, U.S.: Electronic Code of Federal Regulations, ecfr.gpoaccess.gov/, 2006.
Fehsenfeld, F. C., Dickerson, R. R., Hubler, G., Luke, W. T., Nun-nermacker, L. J., Williams, E. J., Roberts, J. M., Calvert, J. G., Curran, C. M., Delany, A. C., Eubank, C. S., Fahey, D. W., Fried, A., Gandrud, B. W., Langford, A. O., Murphy, P. C., Norton, R. B., Pickering, K. E., and Ridley, B. A.: A Ground-Based Inter-comparison of NO, NOx, and NOyMeasurement Techniques, J.
Geophys. Res., 92(D12), 14 710–14 722, 1987.
Fehsenfeld, F. C., Drummand, J. W., Roychowdhury, U. K., Galvin, P. J. W., E.J., Burh, M. P., Parrish, D. D., Hubler, G., Langford, A. O., Calvert, J. G., Ridley, B. A., Grahek, F., Heikes, B. G., Kok, G. L., Shetter, J. D., Walega, J. G., Elsworth, C. M., Nor-ton, R. B., Fahey, D. W., Murphy, P. C., Hovermale, C., Mohnen, V. A., Demerjian, K. L., Mackay, G. I., and Schiff, H. I.: Inter-comparison of NO2Measurement Techniques, J. Geophys. Res.,
95(D4), 3579–3597, 1990.
Finlayson-Pitts, B. J. and Pitts, J. N.: Chemistry of the Upper and Lower Atmosphere, Academic Press, 2000.
Flores, E., Grutter, M., Galle, B., Mellqvist, J., Samuelsson, J., Knighton, B., Jobson, B. T., Volkamer, R., Molina, L. T., and Molina, M. J., American Geophysical Union Fall Meeting, EOS Trans., 85(47), Abstract A11A-0003, 2004.
Fontjin, A., Sabadell, A. J., and Ronco, R. J.: Homogeneous chemi-luminescence measurement of nitric oxide with ozone, Anal. Chem., 42, 575–579, 1970.
Friedeburg, C. v., Pundt, I., Mettendorf, K.-U., Wagner, T., and Platt, U.: Multi-axis-DOAS measurements of NO2during the
BAB II motorway emission campaign, Atmos. Environ., 39, 977–985, 2005.
Gaffney, J. S., Marley, N. A., Cunningham, M. M., and Doskey, P. V.: Measurements of peroxyacyl nitrates (PANS) in Mexico City: implications for megacity air quality impacts on regional scales, Atmos. Environ., 33, 30, 5003–5012, 1999.
Garcia, A. R., Volkamer, R., Molina, L. T., Molina, M. J., Samuel-son, J., Mellqvist, J., Galle, B., Herndon, S. C., and Kolb, C. E.: Separation of emitted and photochemical formaldehyde in Mex-ico City using a statistical analysis and a new pair of gas-phase tracers, Atmos. Chem. Phys., 6, 4545–4557, 2006,
http://www.atmos-chem-phys.net/6/4545/2006/.
Gregory, G. L., Hoell, J. M., Carroll, M. A., Ridley, B. A., Davis,
D. D., Bradshaw, J., Rodgers, M. O., Sandholm, S. T., Schiff, H. I., Hastie, D. R., Karecki, D. R., Mackay, G. I., Harris, G. W., Torres, A. L., and Fried, A.: An Intercomparison of Air-borne Nitrogen Dioxide Instruments, J. Geophys. Res., 95(D7), 10 103–10 127, 1990.
Grutter, M.: Multi-Gas analysis of ambient air using FTIR spec-troscopy over Mexico City, Atmosfera, 16, 1, 1–13, 2003. Herndon, S. C., Jayne, J. T., Zahniser, M. S., Worsnop, D. R.,
Knighton, W. B., Alwine, E., Lamb, B., Zavala, M., Nelson, D. D., McManus, B., Shorter, J. H., Canagaratna, M. R., Onasch, T. B., and Kolb, C. E.: Characterization of urban pollutant emis-sion fluxes and ambient concentration distributions using a mo-bile laboratory with rapid response instrumentation, Faraday Dis-cuss., 130, 327–339, 2005a.
Herndon, S. C., Yongquan, L., Nelson, D. D., and Zahniser, M. S.: Determination of line strengths for selected transitions in the ν2 band relative to the U1 and N2 bands of H2CO, J. Quant.
Spectros. Radiat. Transfer, 90, 207–216, 2005b.
Jayne, J. T., Leard, D. C., Zhang, X., Davidovits, P., Smith, K. A., Kolb, C. E., and Worsnop, D. R.: Development of an Aerosol Mass Spectrometer for Size and Composition Analysis of Sub-micron Particles, Aerosol Sci. Technol., 33, 1–2, 49–70, 2000. Jenkin, M. E.: Analysis of sources and partitioning of oxidant in
the UK – Part 2: contributions of nitrogen dioxide emissions and background ozone at a kerbside location in London, Atmos. Env., 38, 5131–5138, 2004a.
Jenkin, M. E.: Analysis of sources andpartitioning of oxidant in the UK – Part 1: the NOX-dependence of annual mean concentra-tions of nitrogen dioxide and ozone, Atmos. Environ., 38, 5117– 5129, 2004b.
Jenkin, M. E., Saunders, S. M., Wagner, V., and Pilling, M. J.: Pro-tocol for the development of the Master Chemical Mechanism, MCM v3 (Part B): tropospheric degradation of aromatic volatile organic compounds, Atmos. Chem. Phys., 3, 181–193, 2003, http://www.atmos-chem-phys.net/3/181/2003/.
Jimenez, J. L., McCrae, G. J., Nelson, D. D., Zahniser, M. S., and Kolb, C. E.: Remote Sensing of NO and NO2Emissions from
Heavy-Duty Diesel Trucks Using Tunable Diode Lasers, Envi-ron. Sci. Technol., 34, 12, 2380–2387, 2000.
Kebabian, P. L., Herndon, S. C., and Freedman, A.: Detection of Ni-trogen Dioxide by Cavity Attenuated Phase Shift Spectroscopy, Anal. Chem., 77, 724–728, 2005.
Kley, D. and McFarland, M.: Chemiluminescence detector for NO and NO2, Atmos. Tech., 12, 63–69, 1980.
Kolb, C. E., Herndon, S. C., Mcmanus, J. B., Shorter, J. H., Zah-niser, M. S., Nelson, D. D. J., Jayne, J. T., Canagaratna, M. R., and Worsnop, D. R.: Mobile Laboratory with Rapid Re-sponse Instruments for Real-Time Measurements of Urban and Regional Trace Gas and Particulate Distributions and Emission Source Characteristics, Environ. Sci. Technol., 38, 5694–5703, 2004.
Latham, S., Kollamthodi, S., Boulter, P. G., Nelson, P. M., and Hickman, A. J.: Assessment of primary NO2emissions, hydro-carbon speciation and particulate sizing on a range of road ve-hicles, Report PR/SE/353/2001, Transport Research Laboratory (TRL), 2001.
Li, Y. Q., Demerjian, K. L., Zahniser, M. S., Nelson, D. D., Mc-Manus, J. B., and Herndon, S. C.: Measurement of formalde-hyde, nitrogen dioxide, and sulfur dioxide at Whiteface
Moun-tain using a dual tunable diode laser system, J. Geophys. Res., 109, D16S08, doi:10.1029/2003JD004091, 2004.
Madronich, S.: Chemical evolution of gaseous air pollutants down-wind of tropical megacities: Mexico City case study, Atmos. En-viron., 40, 6012–6018, 2006.
Marley, N. A., Gaffney, J. S., Ramos-Villegas, R., and Cardenas Gonzalez, B.: Comparison of measurements of peroxyacyl ni-trates and primary carbonaceous aerosol concentrations in Mex-ico City determined in 1997 and 2003, Atmos. Chem. Phys., 7, 2277–2285, 2007,
http://www.atmos-chem-phys.net/7/2277/2007/.
Marley, N. A., Gaffney, J. S., White, R. V., Rodriguez-Cuadra, L., Herndon, S. C., Kolb, C. E., Dunlea, E. J., Volkamer, R. M., Molina, L. T., and Molina, M. J.: Fast Gas Chromatography with Luminol Chemiluminescent Detection for the Simultaneous De-termination of Nitrogen Dioxide (NO2) and Peroxyacetyl Nitrate
(PAN) in the Atmosphere, Rev. Sci. Inst., 75, 4595–4605, 2004. McClenny, W. A., Williams, E. J., Cohen, R. C., and Stutz, J.:
Preparing to Measure the Effects of the NOxSIP Call – Methods
for Ambient Air Monitoring of NO, NO2, NOy, and Individual
NOzSpecies, J. Air Waste Manage. Assoc., 52, 542–562, 2002.
McManus, J. B., Kebabian, P. L., and Zahniser, M. S.: Astigmatic mirror multiple pass absorption cells for long pathlength spec-troscopy, Appl. Opt., 34, 3336–3348, 1995.
Molina, L. T., Kolb, C. E., De Foy, B., Lamb, B. K., Brune, W. H., Jimenez, J. L., and Molina, M. J.: Air quality in North Amer-ica’s most populous city– overview of MCMA-2003 Campaign, Atmos. Chem. Phys., 7, 2447–2473, 2007,
http://www.atmos-chem-phys.net/7/2447/2007/.
Moya, M., Grutter, M., and Baez, A.: Diurnal variability of size-differentiated inorganic aerosols and their gas-phase precursors during January and February of 2003 near downtown Mexico City, Atmos. Environ., 38, 5651–5661, 2004.
Neuman, J. A., Huey, L. G., Ryerson, T. B., and Fahey, D. W.: Study of Inlet Materials for Sampling Atmospheric Nitric Acid, Environ. Sci. Technol., 33, 1133–1136, 1999.
Neuman, J. A., Parrish, D. D., Ryerson, T. B., Brock, C. A., Wiedin-myer, C., Frost, G. J., Holloway, J. S., and Fehsenfeld, F. C.: Ni-tric acid losss rates measured in power plant plumes, J. Geophys. Res.-Atmos., 109(D23), D23304, doi:10.1029/2004JD005092, 2004.
Ord´o˜nez, C., Richter, A., Steinbacher, M., Zellweger, C., N¨uss, H., Burrows, J. P., and Pr´evˆot, A. S. H.: Comparison be-tween 7-years of satellite-borne and ground-based tropospheric NO2 measurements around Milan, Italy, J. Geophys. Res., 111, D05310, doi:05310.01029/02005JD006305, 2006.
Osthoff, H. D., Brown, S. S., Ryerson, T. B., Fortin, T. J., Lerner, B. M., Williams, E. J., Pettersson, A., Baynard, T., Dube, W. P., Ciciora, S. J., and Ravishankara, A. R.: Measurement of atmo-spheric NO2 by pulsed cavity ring-down spectroscopy, J. Geo-phys. Res., 111, D12305, doi:12310.11029/12005JD006942, 2006.
Parrish, D. D. and Fehsenfeld, F. C.: Methods for gas-phase mea-surements of ozone, ozone precursors and aerosol precursors, At-mos. Environ., 34, 1921–1957, 2000.
Platt, U.: Chapter 2, Sigrist, M. W., Monitoring by Spectroscopic Techniques, Wiley & Sons, 1994.
Platt, U. and Perner, D.: Direct Measurements of Atmospheric CH2O, HNO2, O3, NO2 and SO2 by Differential Optical
Ab-sorption in the Near UV, J. Geophys. Res., 85, 7453–7458, 1980. Pundt, I., Mettendorf, K.-U., Laepple, T., Knab, V., Xie, P., Losch, J., Friedeburg, C. v., Platt, U., and Wagner, T.: Measurements of trace gas distributions using Long-path DOAS-Tomography during the motorway campaign BAB II: experimental setup and results for NO2, Atmos. Environ., 39, 967–975, 2005.
RAMA: Red Automatica de Monitoreo Atmosferico, http://148. 243.232.103/imecaweb/base datos.htm, 2005.
Ridley, B. A. and Howlett, L. C.: An instrument for nitric oxide measurements in the stratosphere, Rev. Sci. Inst., 45, 742–746, 1974.
Rogers, T. M., Grimsrud, E. P., Herndon, S. C., Jayne, J. T., Kolb, C. E., Allwine, E., Westberg, H., Lamb, B. K., Zavala, M., Molina, L. T., Molina, M. J., and Knighton, W. B.: On-road measurement of volatile organic compounds in the Mexico City metropoli-tan area using proton transfer reaction mass spectrometry, Int. J. Mass Spec., 252, 26–37, 2006.
Rosen, R. S., Wood, E. C., Wooldridge, P. J., Thornton, J. A., Day, D. A., Kuster, W., Williams, E. J., Jobson, B. T., and Cohen, R. C.: Observations of total alkyl nitrates dur-ing Texas Air Quality Study 2000: Implications for O3 and
alkyl nitrate photochemistry, J. Geophys. Res., 109, D07303, doi:10.1029/2003JD004227, 2004.
Rothman, L. S., Barbe, A., Benner, D. C., Brown, L. R., Camy-Peyret, C., Carleer, M. R., Chance, K., Clerbaux, C., Dana, V., Devi, V. M., Fayt, A., Flaud, J. M., Gamache, R. R., Goldman, A., Jacquemart, D., Jucks, K. W., Lafferty, W. J., Mandin, J. Y., Massie, S. T., Nemtchinov, V., Newnham, D. A., Perrin, A., Rins-land, C. P., Schroeder, J., Smith, K. M., Smith, M. A. H., Tang, K., Toth, R. A., Vander Auwera, J., Varanasi, P., and Yoshino, K.: The HITRAN molecular spectroscopic database: edition of 2000 including updates through 2001, J. Quant. Spectros. Radiat. Transfer, 82, 5–44, 2003.
Salcedo, D., Onasch, T. B., Dzepina, K., Canagaratna, M. R., Zhang, Q., Huffman, J. A., DeCarlo, P. F., Jayne, J. T., Mor-timer, P., Worsnop, D. R., Kolb, C. E., Johnson, K. S., Zuberi, B., Marr, L. C., Volkamer, R., Molina, L. T., Molina, M. J., Car-denas, B., Bernabe, R. M., Marquez, C., Gaffney, J. S., Marley, N. A., Laskin, A., Shutthanandan, V., Xie, Y., Brune, W., Lesher, R., Shirley, T., and Jimenez, J. L.: Characterization of Ambi-ent Aerosols in Mexico City during the MCMA-2003 Campaign with Aerosol Mass Spectrometry: Results at the CENICA Super-site, Atmos. Chem. Phys., 6, 925–946, 2006,
http://www.atmos-chem-phys.net/6/925/2006/.
San Martini, F. M., Dunlea, E. J., Grutter, M., Onasch, T. B., Jayne, J. T., Canagaratna, M. R., Worsnop, D. R., Kolb, C. E., Shorter, J. H., Herndon, S. C., Zahniser, M. S., Ortega, J. M., McRae, G. J., Molina, L. T., and Molina, M. J.: Implementation of a Markov Chain Monte Carlo Method to inorganic aerosol mod-eling of observations from the MCMA-2003 Campaign. Part I: Model description and application to the La Merced Site, Atmos. Chem. Phys., 6, 4867–4888, 2006a.
San Martini, F. M., Dunlea, E. J., Volkamer, R., Onasch, T. B., Jayne, J. T., Canagaratna, M. R., Worsnop, D. R., Kolb, C. E., Shorter, J. H., Herndon, S. C., Zahniser, M. S., Salcedo, D., Dzepina, K., Jimenez, J. L., Ortega, J. M., Johnson, K. S., McRae, G. J., Molina, L. T., and Molina, M. J.: Implementa-tion of a Markov Chain Monte Carlo Method to inorganic aerosol modeling of observations from the MCMA-2003 Campaign. Part