HAL Id: insu-03134012
https://hal-insu.archives-ouvertes.fr/insu-03134012
Submitted on 8 Feb 2021HAL is a multi-disciplinary open access
archive for the deposit and dissemination of sci-entific research documents, whether they are pub-lished or not. The documents may come from teaching and research institutions in France or abroad, or from public or private research centers.
L’archive ouverte pluridisciplinaire HAL, est destinée au dépôt et à la diffusion de documents scientifiques de niveau recherche, publiés ou non, émanant des établissements d’enseignement et de recherche français ou étrangers, des laboratoires publics ou privés.
Record of trace organic contaminants in a river sediment
core: from historical wastewater management to
historical use
Thomas Thiebault, Fabrice Alliot, Thierry Berthe, Hélène Blanchoud,
Fabienne Petit, Elodie Guigon
To cite this version:
Thomas Thiebault, Fabrice Alliot, Thierry Berthe, Hélène Blanchoud, Fabienne Petit, et al.. Record of trace organic contaminants in a river sediment core: from historical wastewater man-agement to historical use. Science of the Total Environment, Elsevier, 2021, 773, pp.145694. �10.1016/j.scitotenv.2021.145694�. �insu-03134012�
1
Record of trace organic contaminants in a river sediment core: from
1historical wastewater management to historical use
2Thomas Thiebaulta*, Fabrice Alliota, Thierry Bertheb, Hélène Blanchouda, Fabienne Petitb, Elodie
3
Guigona
4
a EPHE, PSL University, UMR 7619 METIS Sorbonne University, CNRS, EPHE, F-75005, 4 place
5
Jussieu, Paris, France 6
b Normandie Université, UR, UMR CNRS 6143 M2C, FED 4116, 76821 Mont-Saint-Aignan,
7
*To whom correspondence should be addressed. E-mail: thomas.thiebault@ephe.psl.eu Phone: +33 8
(0) 1 44 27 59 97 9
Abstract
10Some trace organic contaminants (TrOCs) can be considered as ubiquitous contaminants since 11
the 1950s, and the study of their historical distribution within river sediments allows us to 12
betterunderstand the temporal variation of the chemical quality of sediments, and make 13
assumptionsabout the most insightful forcings impacting these distributions. In this study, the 14
occurrence of 41 TrOCs of various classes (i.e. pharmaceutical products and pesticides) was 15
studied in a sedimentary core sampled in a disused dock along the Seine River, France.This 16
core covers a 60 year-long period between 1944 and 2003, and 23 TrOCs were detected at 17
least once. Their concentrations mainly ranged between 1 and 10 ng g-1 within the core,
18
except for tetracycline that exhibited higher concentrations (~hundreds of ng.g-1). The dating 19
of the core, based on previous studies, enabled the characterization of the changes since 1945, 20
potentially impacted by (i) the sewer connectivity, (ii) the upgrading of wastewater treatment 21
technologies, (iii) historical modifications in the use of each TrOC, and (iv) the sedimentary 22
composition. In every case the deepest occurrence of each TrOC in the core matched its 23
market authorization date, indicating the potential of TrOC to be used as chronomarkers. This 24
study also reveals that the recent upgrading of wastewater treatment technologies within the 25
2 watershed decreased the concentrations of each TrOC, despite an increase in TrOC diversity 26
in the most recent years. 27
Keywords
28Sediments, Wastewater treatment, Trace Organic Contaminants, Pharmaceuticals, 29 Pesticides 30 31
1. Introduction
32Since WWII, a large number of trace organic contaminants (TrOCs) have been regularly 33
launched on the market for different uses (Bernhardt et al., 2017), e.g. pharmaceutical products, 34
crop protection products, and personal care products. These contaminants are generally 35
classified as contaminants of emerging concern, meaning that their detection in environmental 36
compartments is “recent” and raises serious issues about their ecotoxicological impact 37
(Daughton, 2004; Välitalo et al., 2017). 38
Moreover, as no environmental impact evaluation was performed prior to market launch (until 39
a pesticide directive by the European Commission ( 1991a)), a significant and growing number 40
of TrOCs (as main products or metabolites) have been detected in numerous environmental 41
compartments, for example since the 1960s and 1970s for some pesticides (Robeck et al., 1965) 42
and pharmaceutical products (Garrison et al., 1976; Hignite and Azarnoff, 1977), and still at 43
the present time, despite strict legislations. 44
In the European Union, two political decisions had a major effect in raising awareness about 45
the quality of water bodies: firstly, the urban wastewater treatment directive in 1991 (European 46
Commission, 1991b), and then, in 2000, the water framework directive (European Commission, 47
2000). These two texts aimed at improving the quality of water environments in Europe by 48
targeting the collection and treatment of wastewater, and ensuring a good ecological status of 49
3 water bodies in the future, respectively. These political decisions were accompanied by 50
technical evolutions allowing the detection and quantification of numerous TrOCs in natural 51
environments (Altenburger et al., 2015; Loos et al., 2009; McCance et al., 2018). However, 52
depending on the TrOC targeted, the contamination of environmental compartments can be 53
much older than the first detection, hindering the proper understanding of the historical 54
contamination of water bodies. 55
In order to reconstruct the historical contamination of water bodies, sedimentary archives are 56
considered as particularly relevant, especially concerning PAHs or PCBs (Ayrault et al., 2020; 57
Dendievel et al., 2020; Santschi et al., 2001), which are hydrophobic and persistent organic 58
contaminants. However, recent studies have demonstrated that more hydrophilic contaminants, 59
such as pesticides (excluding organo-chlorine pesticides such as DDT) and pharmaceutical 60
products, may also be recorded in sedimentary archives (Lahti and Oikari, 2012; Lara-Martín 61
et al., 2015), showing the relevance of sedimentary archives to study the temporal record of 62
TrOC deposition associated with particulate matter. 63
Yet, once the vertical distribution of contaminants has been obtained, interpreting the patterns 64
may be challenging. Generally, most authors concur that the oldest detection of a specific 65
contaminant is concurrent with or posterior to the market launch date of the investigated 66
contaminant (Kerrigan et al., 2018; Klaminder et al., 2015), in view of their weak mobility 67
within the sedimentary column and limited degradation due to adsorption onto solids (Keil et 68
al., 1994). Another strong assumption is that the sedimentary occurrence of contaminants is 69
related to their dissolved concentration and solid/water partition coefficient (Lara-Martín et al., 70
2015; Thiebault et al., 2017). However, unlike hydrophobic contaminants, for which the 71
sedimentary occurrences are considered to be proportional to the historical environmental 72
contamination through the organic content of sediment (Castro and Vale, 1995), for hydrophilic 73
contaminants, variations in both watercourse conditions (da Silva et al., 2011; Zhou and 74
4 Broodbank, 2014) or sedimentary compositions (Al-Khazrajy and Boxall, 2016; Kodešová et 75
al., 2015; Stein et al., 2008) may impact the solid/water partition non-linearly. It is therefore 76
important to assess the vertical variation of the sediment composition (granulometry, organic 77
content) in order to avoid misunderstanding the observed pattern. Moreover, it is also 78
mandatory to develop an appropriate age model to date such sedimentary archives in order to 79
assess the temporal continuity of sediment deposition, and the potential presence of major 80
disturbances or hiatuses along the core (Fuller et al., 1999; Vrel et al., 2013). 81
The vertical variation in the concentration of rather hydrophilic contaminants therefore depends 82
on several factors, as already mentioned, (i) the adsorption potential of the sediment; (ii) the 83
amount of contaminant used in the watershed; and finally, (iii) the impact of potential filters 84
between the place of use and the watercourse. On the latter point, it is very important to have a 85
proper evaluation of the main sources of the contaminants investigated. For example, it has 86
been known for some time that most pharmaceutical products (except livestock production 87
sources) are discharged into the environment through wastewater treatment plants (WWTP), in 88
which their removal are incomplete (Verlicchi et al., 2012). However, both sewer networks and 89
wastewater treatment technologies have considerably evolved in the last 60 years (De Feo et 90
al., 2014; Hara et al., 2016). Pesticides discharged into the environment are more difficult to 91
trace, as even though most pesticides are used in the field for crop protection, generating a 92
diffuse source toward water bodies, a significant amount of pesticides is also rejected by point 93
sources, such as wastewater and stormwater discharge points (Blanchoud et al., 2004; Botta et 94
al., 2009; Zgheib et al., 2012). 95
Moreover, the vertical distribution of TrOCs such as pharmaceutical products and pesticides 96
within sedimentary archives is the result of multiple factors and a careful investigation into the 97
historical evolution of the watershed is needed. In this study, therefore, we investigated the 98
occurrence of 41 TrOCs in a sedimentary archive located in a highly anthropized estuary (Seine 99
5 estuary, downstream the cities of Rouen and Paris, France). The targeted TrOCs are 100
pharmaceutical products and pesticides, both parent compounds and some major metabolites. 101
From an analysis of their vertical distribution, the aim was (i) to investigate the use of TrOCs 102
as chronomarkers; (ii) to access a long term chronology of TrOC contamination; and (iii) to 103
evaluate the respective impact of the sedimentary composition, the WWTP evolution and the 104
change in use in the watershed on TrOC sedimentary occurrences. 105
2. Material and Methods
106
2.1. Site Settings
107The coring site is located in the upper estuary of the Seine River (Figure 1), in a disused dock 108
at Rouen called “Darse des Docks”. Historical bathymetric charts and data provided by the 109
Grand Port Maritime de Rouen (GPMR; Rouen harbor authority) allowed us to assume that the 110
site chosen for the coring had remained undisturbed since 1960 (Kaci et al., 2014; Vrel et al., 111
2013). Sediments from the harbor basin were lying on semi-confined gravel and chalk aquifers 112
that were connected to groundwater. The coring site is located in the Rouen agglomeration 113
(110 000 inh. for the city and 660 000 inh. for the entire urban area) and is situated downstream 114
the discharge points of two major WWTPs, E and GQ, and upstream the discharge of GC 115
effluents (Figure 1). The Seine river is also impacted upstream (i.e. > 100 km) by the discharge 116
of the effluent of SA, the largest WWTP in France. 117
This site was also selected as the Seine estuary is the outlet of contamination of the Seine 118
watershed, where nearly 40% of the French population is concentrated, including the Paris 119
megacity, 30% of French industrial activity until recent decades and nearly 40% of national 120
agricultural activity. It therefore appeared that this site should be particularly relevant for the 121
analysis of the historical contamination by TrOCs of various classes. 122
6 123
Figure 1: Aerial photograph (www.geoportail.gouv.fr) showing the coring site “Darse des docks” (yellow star)
124
within the urban area of Rouen. Local wastewater effluent inputs into the Seine River and their current treatment
125
capacities and technologies are highlighted (E, GQ, GC), and the upstream SA WWTP is also indicated. PE for
126
Population-Equivalent.
127 128
2.2. Sediment coring and sampling 129
The core sampling was performed in 2010, using a percussion corer adapted for use on a barge, 130
allowing the collection of a 580-cm core of consolidated mud. Then, a long box-corer (gravity 131
corer) was also used to collect the superficial unconsolidated mud, thus making it possible to 132
retrieve a 105-cm-long core which included the soft surface mud (not analyzed in this study, 133
but useful for the age-modeling). Subsequently, the two cores were combined together into a 134
single profile. The loss of sediment at the interface and the compaction induced by the 135
percussion corer were corrected by assuming that no such sampling artefacts occurred using the 136
gravity corer, and combining water content profiles (Vrel et al., 2013). Compaction was not 137
estimated for deeper sediments. 138
7 Immediately after the coring, the cores were aseptically cut in half lengthwise in a confined 139
chamber. One half of each core was used for geochemical analyses and sediment dating, while 140
the other half was subsampled into 5cm-thick sub-fractions using a sterile sub-corer and further 141
placed in storage at -80°C in less than an hour as previously described (Kaci et al., 2014). 142
2.3. Sediment analysis and dating 143
The particle size was determined by an enhanced laser diffraction particle size analyzer
144
(Beckman Coulter, LS230). The total organic carbon (TOC) content of sediment samples was
145
determined by elementary analysis after decarbonation of the bulk sediment with HCl (3M).
146
Fourier transform infrared (FTIR) measurements in the range 400-4000 cm-1, were recorded
147
using a Bruker 55 FT-IR spectrometer equipped with an Nd:YAG laser operating at 1064 nm 148
and a Ge detector. The analyses were performed in transmission mode and each spectrum was 149
the average of 256 scans collected at 2 cm-1 resolution. About 0.01 g of material was mixed 150
with 0.99 g of potassium bromide (KBr) and pelletized with a hydraulic press at 10 kPa during 151
5 minutes. 152
The analyses of artificial radionuclides (137Cs and plutonium isotopes) coupled with 153
hydrological and bathymetric data made it possible to constrain a precise age-model, previously 154
published (Vrel et al., 2013). This age-model allows the characterization of two sedimentary 155
hiatuses along the profile, the first one between 1949 and 1960, and the second one between 156
1962 and 1965, explaining the lack of samples for these dates. 157
Hereafter, samples are labelled according to the date of the layer. 158
2.4. Chemical reagents 159
LC-MS grade acetonitrile (AcN) and methanol (MeOH) were purchased from VWR and ultra-160
pure water (H2O) was prepared with a Pure Lab Chorus water purification system (Veolia
161
Water). Formic acid (99% purity) was purchased from Sigma-Aldrich. Isotopically labeled 162
8 internal standards (ILIS) and reference standards were purchased from LGC Standards, 163
assuming a purity ≥ 97%. TrOCs were selected following the most frequently detected organic 164
contaminants in European river waters (Loos et al., 2013). 165
2.5. Enrichment and clean-up of sediment extracts 166
Sediments were collected on cores following a regular sampling step (5 cm). After freezing at 167
-80°C, they were then freeze-dried during 24 h before being crushed in a mortar, and 1± 0.1 g 168
was subsampled. Samples were then spiked with 100 ng of each ILIS at 4°C overnight. Spiked 169
samples were then extracted by pressurized liquid extraction, using ASE-350 (Thermo). The 170
extraction mixture was MeOH/H2O (1:1 v/v) and the operating temperature and pressure were
171
100°C and 1000 psi respectively. Extracts were then reduced to 1 mL using an EZ-2 evaporator 172
(Biopharma Technologies), prior to refilling at 100 mL of H2O before purification by
solid-173
phase extraction (SPE) on Oasis-HLB columns (6 mL x 150 mg, Waters). Cartridges were 174
conditioned with 5 mL of MeOH followed by 5 mL of ultra-pure water. Then, the cartridges 175
were filled with the sample (100 mL) prior to flushing with 2 x 5 mL of ultra-pure water before 176
drying for 30 minutes under vacuum. Finally, elution of TrOCs was performed with 2 x 5 mL 177
of MeOH before drying under nitrogen flow and filtration at 0.22 µm. Extracts were finally 178
recovered in MeOH before injection. The analytical and quantification procedure is further 179
detailed in the supplementary data (Tables S1-S2). 180
Table 1: General properties of the targeted TrOCs, with Ab. the abbreviation, Mw the molecular weight in g.mol-1, 181
Solw the water solubility at 25°C and pH=7 in mg.L-1, Charge the charge state at pH=7 and MAD the market 182
authorization date, deriv. for derivatives, * indicates by-products. Data extracted from Chemspider Database
183
Type Chemical Group Name Ab. Formula CAS-Number Mw pKa log Kow log Koc Solw Charge MADa,b
Pharmaceutical Products
Antibiotics β-Lactam Amoxicillin AMO C16H19N3O5S 26787-78-0 365.40 3.2-7.4 0.97 2.94 2,702 +/- 1972 Cycline Tetracycline TET C22H24N2O8 60-54-8 444.43 8.2 -1.33 1.76 231 + 1948 Diaminopyrimidine Trimethoprim TMP C14H18N4O3 738-70-5 290.32 7.2 0.73 2.96 400 0/+ 1968 Fluoroquinolone Ciprofloxacin CIP C17H18FN3O3 85721-33-1 331.34 5.8-8.7 0.28 1.55 1,350 +/- 1987
Enrofloxacin ENR C19H22FN3O3 93106-60-6 359.39 5.7-6.7 0.70 1.92 612 - 1970's
Norfloxacin NOR C16H18FN3O3 70458-96-7 319.33 5.8-8.7 -0.31 1.96 280 +/- 1985
Ofloxacin OFL C18H20FN3O4 82419-36-1 361.37 5.5-6.2 -2.00 1.65 4,000 - 1986
Macrolide Erythromycin ERY C37H67NO13 114-07-8 733.93 8.4-12.4 3.06 1.00 4.2 + 1952
Quinolone Flumequine FLQ C14H12FNO3 42835-25-6 261.25 6.0 2.60 1.85 308 - 1976
Oxolinic Acid OXO C13H11NO5 14698-29-4 261.23 5.6 1.70 1.00 3.2 - 1974
Sulfonamide Sulfamethoxazole SMX C10H11N3O3S 723-46-6 253.28 2.0-6.2 0.89 3.19 610 - 1968
Analgesics Acetylaniline Acetaminophen ACM C8H9NO2 103-90-2 151.16 9.6 0.46 1.79 14,000 0 1957
Opioids Codeine COD C18H21NO3 76-57-3 299.36 8.2 1.28 3.12 577 + 1840s
Tramadol TRA C16H25NO2 27203-92-5 263.37 9.4 3.01 2.91 1,151 + 1997 Anticonvulsants Dibenzazepine Carbamazepine CBZ C15H12N2O 298-46-4 236.27 13.9 2.45 3.56 18 0 1974 β-blockers Ethanolamine Atenolol ATE C14H22N2O3 29122-68-7 266.34 9.6 0.16 2.17 13,300 + 1978
9 Propranolol PRP C16H21NO2 525-66-6 259.34 9.7 2.60 3.09 61.7 + 1965
Hypolipidemic Fibrate Bezafibrate BZB C16H20ClNO4 41859-67-0 361.82 3.87 4.25 3.17 1.55 - 1982
Non-Steroidial Anti-Inflamm.
Acetic acid deriv. Diclofenac DCF C14H11Cl2NO2 15307-79-6 296.15 4.2 4.02 2.92 2.37 - 1950's
Propionic acid deriv. Ketoprofen KET C16H14O3 22071-15-4 254.28 4.5 3.00 2.46 51 - 1970's
Psychotropic drugs
Benzodiazepine Diazepam DIA C16H13ClN2O 439-14-5 284.74 3.4 2.70 4.05 50 0 1963 Oxazepam OXA C15H11ClN2O2 604-75-1 286.71 1.7-11.6 3.34 3.08 150 0 1965 Diphenydramine deriv. Fluoxetine FLX C17H18F3NO 54910-89-3 309.33 9.8 4.65 5.32 1.7 + 1989 Phenetylamine deriv. Venlafaxine VEN C17H27NO2 93413-69-5 277.40 8.9 3.28 3.17 267 + 1993
Pesticides
Fungicide Benzimidazole Carbendazim CBD C9H9N3O2 10605-21-7 191.19 4.5 1.55 2.24 8 0 1967
Triazole Tebuconazole TEB C16H22ClN3O 107534-96-3 307.82 5.0 3.89 4.32 36 0 1986
Biocide Triazine Irgarol IRG C11H19N5S 28159-98-0 253.37 4.1 4.07 2.38 7.52 0 -
Herbicide Organochlorine Metazachlor MTZ C14H16ClN3O 67129-08-2 277.75 - 2.38 2.80 430 0 1983
Metolachlor MTC C15H22ClNO2 51218-45-2 283.79 - 3.24 2.47 530 0 1975
Oxadiazole Oxadiazon OXD C15H18Cl2N2O3 19666-30-9 345.22 2.7 4.81 3.54 0.7 - 1969
Phenoxynicotinanilide Diflufenican DFF C19H11F5N2O2 83164-33-4 394.30 - 3.53 5.04 0.05 0 1988
Phenylurea 3,4 Dichloroaniline* DCA C6H5Cl2N 95-76-1 162.02 3.0 2.37 2.08 92 0 - Chlortoluron CHT C10H13ClN2O 15545-48-9 212.67 14.0 2.58 2.13 70 0 1970 Isoproturon ISO C12H18N2O 34123-59-6 206.28 0.1 2.84 2.40 70 0 1974
Sulfonylurea Nicosulfuron NIC C15H18N6O6S 111991-09-4 410.41 4.3 -1.15 1.33 1,200 - 1993
Prosulfuron PRS C15H16F3N5O4S 94125-34-5 419.38 3.8 3.56 3.54 4,000 - 1999
Triazine & deriv. Atrazine ATZ C8H14ClN5 1912-24-9 215.68 1.7 2.82 2.36 33 0 1959
Desethylatrazine* DEA C6H10ClN5 6190-65-4 187.63 1.4 1.78 1.94 3,200 0 -
Deisopropylatrazine* DIA C5H8ClN5 1007-28-9 173.60 1.5 1.36 1.75 670 0 -
Hydroxyatrazine* HTZ C8H15N5O 2163-68-0 197.24 4.6 2.09 2.25 5.9 0 -
Simazine SIM C7H12ClN5 122-34-9 201.66 1.6 2.40 2.17 6.2 0 1957 References: aChast, (2012); bChauvel et al., 2012)
184
2.6. Quantification procedure 185
TrOC separation was achieved at 40°C with a Zorbax Eclipse Plus C18 chromatographic 186
column (2.1 mm x 150 mm x 3.5µm; Agilent) using a 1200 SL HPLC system (Agilent). The 187
injection volume was 10 µL and the flow rate 0.3 mL.min-1. Two solvents were used as mobile
188
phase; AcN (solvent A) and Milli-Q water (solvent B) both acidified with 0.1% of formic acid. 189
The elution gradient was a transition from 95% to 0% of B in 9.5 min followed by 4 min of 190
100% of A and then a return to the initial conditions (95% of B) during 3.5 min for a total 191
analysis time of 18.5 min. The chromatography system was coupled to a 6410B triple 192
quadrupole mass spectrometer (Agilent) equipped with a heated electrospray ionization (H-193
ESI) interface operating in positive mode and at a flow rate of 0.3 mL.min-1. The multiple 194
reaction monitoring (MRM) transitions and further details on the detection and quantification 195
procedures are given in the supplementary data (Tables S1-S2). During each analytical run, 196
blanks and quantification controls were regularly used in order to crosscheck the quantification 197
quality. 198
2.7. Validation 199
The limits of quantification (LOQ) and limits of detection (LOD) of the method were calculated 200
using the signal-to-noise (S/N) ratios (Table S3). LOD and LOQ were determined by extracting 201
10 spiked (100 ng.g-1) matrix-matched (n = 5) sediment samples. Then, LOD and LOQ were 202
respectively calculated based on a ratio between spiked amount and S/N ratios multiplied by 3 203
and 10 for LOD and LOQ respectively. The recovery ratios were also evaluated in these 204
experiments (spiking concentration = 100 ng.g-1, n = 5), using the same extraction and
205
quantification protocol as for the samples. 206
3. Results
2073.1. Sedimentary composition 208
The qualitative composition of the samples according to their deposition date was evaluated 209
using FTIR analyses (Figure S1). The main bands are associated with the main components of 210
the sediments; i.e. carbonates, silicates and organic matter (Tinti et al., 2015). The relative 211
proportion of each is not the point here, although it is worth noting that no significant variations 212
in the spectra were visible for the samples selected. This means that no sudden variations 213
occurred in the whole sedimentary composition, at least using this qualitative analysis, 214
confirming a relatively homogeneous organo-mineral composition along the sedimentary 215
profile. 216
The grainsize distributions of the sampled sediments are presented in Figure 2. All along the 217
vertical profile, the grainsize is dominated by silts which are almost steady around 70%. 218
Conversely, the relative proportion of sands overall increased from a mean value of 12% 219
between 1945 and 1980 to a mean value of 21 % in the most recent layers. The opposite pattern 220
is visible for clay grainsize, for which the relative proportion decreased from 17% between 221
1945 and 1980 to a mean value of 9% since 1980. 222
11 223
Figure 2: Total organic carbon (yellow squares, in %) and grain size distribution in three major fractions 224
in % (clays in light green, silts in green and sands in light brown) of the sampled sediments 225
The change in TOC values along the core seems to be closely connected with the grainsize 226
variations, as TOC is almost steady between 1945 and 1980 with a mean value of 10%, followed 227
by a decrease in the TOC value between 1980 and 1990, and since then, an almost constant 228
TOC value around 6.5%. 229
These similar temporal fluctuations of clay grainsize and TOC are significantly correlated (p < 230
0.001), and even if the TOC content does not exclusively depend on the clay proportion (i.e. R² 231
= 0.41), the higher surface area of the finest grainsize fractions plays an important role in the 232
organic carbon storage. 233
3.2. Occurrences of TrOCs in sediments 234
Among the 41 targeted TrOCs, 23 were quantified at least once. Most of the concentrations 235
ranged between 1 and 10 ng.g-1 except for COD and several antibiotics. The maximum 236
concentrations were 256 and 550 ng.g-1 for COD and TET, respectively. Whatever the TrOC, 237
the vertical distribution was characterized by a first occurrence, at different depths depending 238
on the molecule, followed by an almost continuous detection until the most recent sedimentary 239
12 layers. Two main patterns were displayed: (i) an increase in the concentrations followed by a 240
decrease in the most recent sediments (e.g. FLQ and TET, Figure 3); and (ii) a continuous 241
increase in the concentrations since the first detection (e.g. TRA, Figure 4 and CBD, Figure 5). 242
It is noteworthy that for the TrOCs investigated, the market authorization date was 243
systematically older than their first detection. In this archive, other authors have indicated the 244
possible connection with groundwaters (Kaci et al., 2016), which is not confirmed here as the 245
oldest sampled layers (respectively dating from 1944.5 and 1945) were deprived of any TrOC 246
contamination (Figures 3, 4 and 5). For clarity, the vertical distribution of TrOC will be 247
hereafter discussed within three main groups, antibiotics, pharmaceutical products and 248
pesticides. 249
250
Figure 3: Distribution of antibiotics along the sedimentary profile by year. Concentrations are expressed in ng g-1 251
of dried sediment. Grey squares indicate concentrations below LOD, whereas red squares indicate concentrations
252
below LOQ. The yellow star refers to the market authorization date (MAD, Table 1).
253
3.2.1. Antibiotics
254
Among 11 targeted antibiotics, 7 were quantified and displayed in general an increase in 255
concentration followed by a decrease in the most recent sedimentary layers (Figure 3). The 256
maximum concentrations were reached between 1980 and 1985 for FLQ, OXO, SUL, TET and 257
TMP, whereas the maximum concentrations of NOR and OFL were more recent, i.e. between 258
1991 and 1997 due to their later market authorization date. A significant decrease in the 259
concentrations of all the compounds can be observed in the latest layers, especially since 1990 260
for TMP, since 1992 for TET and since 1997 for the other antibiotics. This decrease is 261
13 particularly noticeable on OXO which has been <LOQ since 1998 and TMP, which has been 262
mostly <LOD since 1990. 263
3.2.2. Other Pharmaceuticals
264
Within this group, 7 compounds were detected amongst 13 (Figure 4). The MADs of these 265
TrOCs range from ~1842 for COD, to 1997 for TRA. COD displays an atypical pattern with 266
several occurrences between 1968 and 1980 with a very high concentration (i.e. 256 ng.g-1) in 267
1973 whereas this molecule was not detected in the other samples. 268
269
Figure 4: Distribution of PPs (other than ATBs) along the sedimentary profile by year. Concentrations are
270
expressed in ng g-1 of dried sediment. Grey squares indicate concentrations below LOD, whereas red squares 271
indicate concentrations below LOQ. The yellow star refers to the market authorization date (MAD, Table 1),
272
whereas the orange star refers to another MAD event.
273
FLX, VEN and TRA were the most recently marketed pharmaceuticals, respectively in 1989, 274
1993 and 1997. Whereas for VEN and TRA only 3 quantifications were made, in the three latest 275
sedimentary layers, FLX displayed an increase in concentration until 1997, followed by a 276
regular decrease in concentration. The same pattern (i.e. global increase until the late 1990s) is 277
visible for PRP, despite an older MAD. ACM was initially launched for pediatric use only, 278
before an extension to the entire population in 1964. Its pattern displays a first increase in 279
concentration between 1965 and 1979, followed by a steady profile between 1980 and 1992, a 280
second increase between 1993 and 1998, and a final decrease. 281
3.2.3. Pesticides
14 Among the 16 pesticides and derivatives investigated, 9 were detected (Figure 5). The highest 283
concentrations were observed for CBD, DCA and DFF with several tens of ng.g-1. DCA and 284
DFF displayed limited recovery ratios respectively due to a significant volatility (Crossland, 285
1990; Gatidou et al., 2004) and a high affinity with solids (Table 1). 286
The MAD of the detected pesticides ranged between 1951 for diuron (which with propanil and 287
linuron launched in 1960 and 1965, and other biocides or industrial products, are the potential 288
parent compounds of DCA) and 1988 for DFF. As observed for other TrOCs, no detection 289
occurred before the MAD. The historical distribution of pesticides followed two types of 290
patterns: (i) an almost constant increase in concentration, as for ISO and CBD, and (ii) an 291
increase since the MAD until the beginning of the 1980s followed by a decrease which became 292
more pronounced in the most recent layers. 293
294
Figure 5: Distribution of pesticides along sedimentary profile by year. Concentrations are expressed in ng g-1 of 295
dried sediment. Grey squares indicate concentrations below LOD, whereas red squares indicate concentrations
15
below LOQ. The yellow star refers to the market authorization date (MAD, Table 1), whereas the orange star refers
297
to other MAD events (e.g. by-products).
298 299
3.3. WWTP technology evolution 300
WWTP effluents can be considered as the main environmental source of pharmaceuticals (Tran 301
et al., 2019), and depending on the sewage network (i.e. separative or unitary), a significant 302
amount of pesticides may also be present (Paijens et al., 2021). Located in an urban area, the 303
coring site is impacted by the effluent discharge of the main WWTP of the Rouen conurbation, 304
3.5 km upstream, with a treatment capacity of 550,000 PE. Two minor effluent discharges, 2 305
km upstream and 6 km downstream (indicated here due to the tide effect), QG and GC 306
respectively, also impacted the coring site. Finally, the effluents of the largest French WWTP, 307
SA, located downstream Paris with a maximum treatment capacity of almost 7,500,000 PE in 308
normal conditions are discharged into the Seine River more than 100 km upstream. 309
310
Figure 6: Temporal evolution of the main WWTPs (both treatment capacities and technologies) 311
impacting the coring site (yellow star) along the Seine River. Data from Rocher et al. (2017) for SA and 312
from Rouen sanitation service (personal communication) for E, GC and GQ. 313
16 The evolution of the treatment technology used in these WWTPs primarily focused on 314
improving the removal of classical parameters such as BOD5, N (mostly organic) or suspended
315
solids. As shown in Figure 6, for SA and E, there was a progressive increase in the treatment 316
capacity following the increase in urbanization and the decline in agricultural spreading of 317
wastewaters. This increase in the treatment capacity was accompanied by an evolution of the 318
treatment technology, especially since the mid-1990s. For example, between 1954 and 1997 the 319
E treatment chain was only a physico-chemical treatment with a focus on suspended solids and 320
carbonaceous load, whereas since then a biological treatment, allowing a correct removal of N 321
and P loads, was implemented. 322
It is difficult to gain precise historical knowledge of the feeding water in a sewage network. 323
From the oldest available information (i.e. 2017) almost one third of the sewage network of the 324
Rouen agglomeration is unitary, whereas two thirds are separative. However, it is most likely 325
that these relative proportions have varied since 1945. Specifically, the unitary network might 326
have been predominant during a long, but unknown, period of time. 327
4. Discussion
3284.1. A 50 years overview? 329
Several authors have assumed that the vertical distribution of TrOCs within sedimentary 330
archives may be connected with their historical occurrences in the dissolved phase, and thus 331
their use in the watershed (Chiaia-Hernández et al., 2020). Considering this assumption, an 332
increasing impact of two factors are expected since 1945: (i) the number of TrOCs detected 333
should increase, in view of the exponential increase in the number of TrOCs marketed since 334
this date, and (ii) the global concentration of TrOCs should also increase extensively as a result 335
of the increase in the use of TrOCs. Of these two assumptions, the first one is verified in the 336
sampled archive (Figure 7), with only one TrOC (i.e. TET) detected in the level 1961.5 and 21 337
17 since the level 1999.2. This increase is consistent with the market authorization dates of the 338
targeted TrOCs, which are distributed all along the last 50 years. Consequently, it can be 339
assumed that sediments reflect the diversity of TrOC contamination well, at least for the most 340
persistent or the most concentrated of them. However, the comparison between the sedimentary 341
occurrences of TrOCs and their historical use in the watershed is not so obvious. First of all, 342
the historical use of pharmaceuticals and pesticides is not available at such a time scale (e.g. 343
records of the amounts of antibiotics sold in France began in 1999, Fig S3), and while it can be 344
considered that there has been an overall increase in the use of TrOCs in general since 1945, 345
this does not take into account the historical variation for one product, which can be more 346
complex (i.e. banning, substitution, competition). 347
18 Figure 7: Total TrOC concentration (red line, ΣTrOCs), Total TrOC concentration without COD and TET
349
(blue line ΣTrOCs – (TET+COD)) and number of detected individual TrOCs (black line, nTrOC) along the
350
core. COD (grey dotted line) and TET (green dotted line) distribution. 351
Looking at the sum of all TrOC occurrences, the layers with the highest concentrations dated 352
from the late 1970s and middle 1980s (Figure 7). Yet, this pattern is heavily influenced by two 353
TrOCs, TET and COD respectively (Figure S2), which can represent up to 88% of the total 354
TrOC concentration for specific layers. Removing the concentrations of these two TrOCs, the 355
total concentration reveals a progressive increase since the first occurrences in the middle 356
1960s. The concentrations of TET and COD are so much higher than the concentrations of other 357
TrOCs that it directly affects the hierarchical cluster distribution of each sample when using 358
raw concentration data (Figure S2). Indeed, each cluster only reflects the relative occurrence of 359
TET or COD, and to a minor extent, SMX. 360
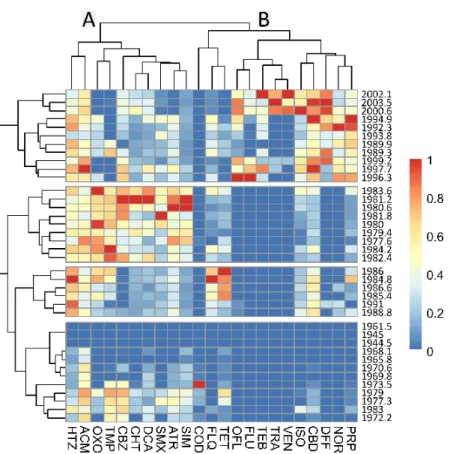
As a result, a second hierarchical cluster analysis was carried out on normalized concentrations 361
between 0 and 1 for each TrOC (0 for <LOD and 1 for the highest concentration, Figure 8). 362
Two main TrOC clusters emerged from this analysis, mostly impacted by the market 363
authorization dates on the one hand and by the historical increase in the sedimentary 364
occurrences on the other hand. From this point of view, cluster A mostly accounts for TrOCs 365
that exhibited their highest concentrations in the 1970s and the 1980s whereas cluster B mostly 366
accounts for TrOCs that have exhibited their highest concentrations since 1990s. The sediment 367
samples are also grouped in four distinct clusters that appear to be affected by TrOC diversity 368
in sediments. There is a cluster for the oldest samples, containing the lowest diversity of TrOCs 369
(< 1979), another for the most recent samples (since 1989) and two other clusters in the 1980s 370
impacted by the relative contribution of each TrOC cluster. This approach confirms that the 371
1980s were a period of significant modifications in the diversity and relative occurrence of 372
TrOCs in this core that need to be addressed. 373
19 374
Figure 8: Heatmap analysis between the normalized occurrence of TrOCs and each analyzed layer by 375
using R software (pheatmap package). The distance matrix was based on the Euclidian distance. 376
377
4.2. Atypical patterns 378
Several TrOCs displayed an atypical vertical distribution, considering that a typical pattern is 379
an expected one and comparable between TrOCs. While in general we can observe an overall 380
increase between the MAD and the late 1990s, this pattern is not visible for several TrOCs. For 381
example, TMP has mostly been consumed in association with SMX since their common MAD 382
in 1968 (Salter, 1982; Thiebault, 2020). However, although SMX, a persistent molecule often 383
detected in the environment, was continuously detected since its first detection in 1973, TMP 384
concentrations have been below LOQ or LOD since 1990. Yet, TMP was briefly sold alone on 385
the French market between 1983 and 1990, the date at which TMP alone was withdrawn (Caron 386
et al., 2017), unlike in other European countries such as the UK and Sweden where TMP alone 387
remains available for medication purposes. Even if this factor alone is probably not sufficient 388
to explain the non-detection of TMP in the most recent layers, this withdrawal may play a 389
20 significant role. Moreover, the impact of wastewater treatment technologies may impact the 390
removal of TMP and SMX differently as a monitoring study of the antibiotics’ occurrence in 391
the Seine River (Tamtam et al., 2008) revealed high concentrations of SMX (~100 ng.L-1) and 392
very limited concentrations of TMP (<10 ng.L-1), consistent with their sedimentary occurrences
393
in the recent layers. 394
Regarding antibiotics, the maximum concentration of FLQ and OXO occurred in the middle 395
1980s, which is older than for most TrOCs. Both these antibiotics belong to the quinolone 396
group, it is worth noting that the latter was progressively substituted by fluoroquinolones 397
especially in human medicine (Figure S2), such as OFL, NOR and CIP (non-detected in this 398
work) launched in 1985, 1986 and 1987, respectively (Zhanel et al., 2002). 399
Lastly, the distribution of TET is original and exhibited very significant concentrations. This 400
molecule is heavily used in veterinary medicine, where its use represents more than 98% of the 401
total use in France (Figure S2), and also displays a high affinity with solid matrices (Zhou et 402
al., 2016). In several studies, tremendous amounts of TET were observed in livestock feces (e.g. 403
~10µg.g-1 in pig feces in Zhou et al. (Zhou et al., 2013)) at concentrations a hundred times 404
higher than other antibiotics such as fluoroquinolones and sulfonamides. Also, in France, the 405
use of tetracyclines largely exceeds the use of the other antibiotics detected in this work, 406
especially for veterinary purposes (Figure S2). Therefore, this high use associated with high 407
excretion and affinity with solid particles may be key factors in explaining these very significant 408
concentrations of TET (Kuang et al., 2020). Moreover, livestock effluent management may 409
directly impact the water quality in the absence of any treatment (Chiffre et al., 2016). The 410
antibiotic loads of the effluents may be very high and contribute significantly to the total 411
environmental loads of some veterinary antibiotics, such as TET (Jaffrézic et al., 2017). 412
Among pharmaceutical products, the most atypical pattern is displayed by COD, with very 413
significant concentrations in the middle 1970s and no detection until this date. These erratic 414
21 occurrences are largely impossible to explain, but were also observed in other sedimentary cores 415
(Thiebault et al., 2017). 416
Finally, another atypical pattern is displayed by herbicides in general, and specifically ATR. 417
This is one of the most frequently detected TrOCs in French water bodies due to its high 418
mobility and persistency. It was widely used on maize and vineyard but also in urban areas with 419
maximal application reported in the 80’s in France. Then, uses slowly decreased due to lower 420
maize areas and limited application rates from 3 to successively 1.5 kg.ha-1 in 1992 and 1 kg.ha -421
1 in 1997 before its ban in 2003 (Blanchoud et al., 2019). Furthermore, urban uses of ATR and
422
SIM were restricted in 1998 due to high contamination of surface waters by direct runoff 423
(Blanchoud et al., 2004). Yet, in the sampled cores, ATR occurrences were below the 424
quantification limit between 2000 and 2003, and in addition, were the highest in the early 1980s, 425
as for some other herbicides. This may reflect mostly an agricultural origin in the 1980s, and 426
then, a mostly urban source until 1997. A precise knowledge of the sewer connectivity may 427
confirm such assumption, but is unreachable. Some other pesticides were more recently banned 428
to limit pesticide contamination like diuron (2003), CBD (2009) and ISO (2017), and new 429
products are now in use like DFF and TEB, which were detected in the most recent layers. 430
4.3. What can we learn from the historical distribution of TrOCs? 431
The sedimentary occurrence of TrOCs is the result of several driving factors: (i) the use of the 432
molecule in the watershed, (ii) the sewer connectivity (depending on the main source of the 433
product), (iii) the wastewater treatment technology, (iv) the distance from the sources, (v) the 434
physico-chemical properties of the targeted molecule and (vi) the sediment composition. As a 435
result, a direct interpretation of a sedimentary occurrence into a historical use is somewhat 436
speculative and requires a correct understanding of the contribution of each driving factor. 437
22 In this work, the sedimentary composition varied weakly in the analyzed samples, as only a 438
slight decrease in the organic content, associated with an increase in the clay content was 439
observed between 1980 and 1990 (Figure 2). Such a small variation may not significantly 440
impact the sorption of TrOCs. As the targeted molecules were in general intermediately 441
hydrophilic/hydrophobic, a KOC normalization appeared unnecessary for a correct
442
understanding of the vertical variations, unlike studies working on hydrophobic contaminants 443
(Alegria et al., 2016; Peters et al., 2020). 444
Another important driving factor may be the TrOC discharge in environmental compartments. 445
Some of them are directly discharged in water bodies, without any treatment (e.g. pesticides, 446
and some veterinary antibiotics), while for others, such as pharmaceuticals, the almost exclusive 447
source is human consumption/excretion and discharge through wastewater effluents. For the 448
latter TrOCs, the historical wastewater management and treatment technology is of great 449
importance. 450
Lastly, the location of the core sampling is of prime importance as some contaminants are 451
sparsely persistent in aquatic environments, especially amongst pharmaceutical products (Zhi 452
et al., 2020). A previous study analyzed the occurrences of antibiotics in sediments of the same 453
watershed, but 50 km upstream (Tamtam et al., 2011). In their study, the authors found a global 454
increase in antibiotic concentrations until the late 1980s, since when a global decrease was 455
observed. The same pattern was found in the present work for the three common molecules 456
(SMX, FLQ, OXO). Yet, we have detected several antibiotics that were not detected in 457
upstream sediments, such as NOR and TMP. It can therefore be assumed that the main drivers 458
of the human-excreted TrOCs vertical distribution are the WWTP effluents nearby (E, GQ) 459
rather than WWTP effluents farther upstream (i.e. SA) even if the former represent a much 460
lower volume. 461
23 This assumption is also validated by the decreasing concentrations of almost all TrOCs since 462
1996, the date at which the water treatment technology of WWTP E was significantly upgraded 463
by the addition of a biological treatment (Figure 6). It can be considered that this supplementary 464
treatment is more efficient than physico-chemical treatment alone for the removal of TrOCs 465
(Joss et al., 2005; Petrie et al., 2014). Yet, no precise knowledge of the sewer connectivity prior 466
to this date was available. Consequently, it is possible to discriminate the main sources of 467
TrOCs only with this date, 1997. What is particularly interesting considering this key date is 468
that beyond pharmaceuticals and most antibiotics, for which the main source is well-known to 469
be wastewater effluents, several pesticides (e.g. ATR) also display decreasing concentrations 470
since 1997. This can be attributed to the fact that pesticide occurrences in river waters result 471
from a mix between agricultural and urban uses (i.e. between diffuse and point sources). Yet, 472
several studies revealed that some pesticides (e.g. ATR, ISO) were more concentrated in the 473
combined sewer systems of urban areas than in agricultural catchments (Paijens et al., 2021), 474
even during the application period of these products (Wittmer et al., 2010). The urban 475
contribution to the total pesticide contamination must therefore not be neglected, especially in 476
an urban context where sediments were sampled close to the discharge of urban effluents. 477
Therefore, counter to the claim made in a recent study dealing with lacustrine sediments in a 478
less anthropized catchment (Chiaia-Hernández et al., 2020), in a more anthropized context, a 479
proper understanding of the vertical variations of pesticides is challenging, because the 480
distribution patterns were not expected. The only regular pattern was for CBD, whose 481
concentrations have increased regularly since the 1970s. It is therefore possible that this 482
molecule presents a more regular source than other pesticides, as agricultural use only for 483
example. 484
5. Conclusion
48524 This study assessed the sedimentary occurrences of TrOCs between 1944 and 2003 with an 486
almost yearly resolution. Various classes of contaminants, such as pesticides and 487
pharmaceutical products were evaluated. Their oldest occurrence was closely related to their 488
historical use, as the first occurrence of each TrOC was systematically later than the market 489
authorization of the product, highlighting the contaminants’ preservation and their non-mobility 490
within sedimentary layers and confirming their possible use as chronomarkers in sedimentary 491
archives. 492
The picture is less straightforward, however, when looking at the vertical distribution of each 493
molecule. In general, the highest occurrences were found during the 1980s, even if it is well-494
known that the use of pharmaceutical products has dramatically increased since this date, which 495
is validated by the increase in TrOC diversity in the most recent sediments. There is therefore 496
an offset between the sedimentary occurrences of some TrOCs, and their use in the watershed. 497
As the cores were sampled close to the discharge of one major WWTP, it can be considered 498
that the evolution of sewage collection, and sewage treatment technology has dramatically 499
modified the concentrations of TrOCs in surface waters, and in turn, their sedimentary 500
occurrences. This is especially highlighted by the overall decrease in TrOC occurrences since 501
the implementation of a biological treatment (i.e. for N and P removal) since 1997. Yet, other 502
modifications (such as sewage collection improvement) were not recorded by the local 503
authorities, making further assumptions about the occurrences of TrOCs in the older layers 504
speculative. 505
Hence, this work provides some clues to the meaning of the vertical distribution of TrOCs from 506
various classes in sedimentary environments. Further analyses remain necessary, however, in 507
order to fully understand how historical sedimentary concentrations can be used beyond the use 508
of the market authorization date. The possibility to sample new cores at the same site for the 509
most recent period (i.e. since 2003) therefore represents a great potential for improving our 510
25 understanding of the historical distribution as the information about the national use of TrOCs 511
in tonnage and a precise record of the sewage collection and treatment have been recorded since 512
this date. 513
Acknowledgements
514This study was supported by the CONTORG project, funded by the UMR METIS. This work 515
also benefits from previous projects, supported by the Seine-Aval scientific research program. 516
References
517Alegria, H., Martinez-Colon, M., Birgul, A., Brooks, G., Hanson, L., Kurt-Karakus, P., 2016. 518
Historical sediment record and levels of PCBs in sediments and mangroves of Jobos Bay, 519
Puerto Rico. Sci. Total Environ. 573, 1003–1009. 520
https://doi.org/10.1016/j.scitotenv.2016.08.165 521
Al-Khazrajy, O.S.A., Boxall, A.B.A., 2016. Impacts of compound properties and sediment 522
characteristics on the sorption behaviour of pharmaceuticals in aquatic systems. J. Hazard. 523
Mater. 317, 198–209. https://doi.org/10.1016/j.jhazmat.2016.05.065 524
Altenburger, R., Ait-Aissa, S., Antczak, P., Backhaus, T., Barceló, D., Seiler, T.-B., Brion, F., Busch, 525
W., Chipman, K., de Alda, M.L., de Aragão Umbuzeiro, G., Escher, B.I., Falciani, F., Faust, 526
M., Focks, A., Hilscherova, K., Hollender, J., Hollert, H., Jäger, F., Jahnke, A., Kortenkamp, 527
A., Krauss, M., Lemkine, G.F., Munthe, J., Neumann, S., Schymanski, E.L., Scrimshaw, M., 528
Segner, H., Slobodnik, J., Smedes, F., Kughathas, S., Teodorovic, I., Tindall, A.J., Tollefsen, 529
K.E., Walz, K.-H., Williams, T.D., Van den Brink, P.J., van Gils, J., Vrana, B., Zhang, X., 530
Brack, W., 2015. Future water quality monitoring — Adapting tools to deal with mixtures of 531
pollutants in water resource management. Sci. Total Environ. 512–513, 540–551. 532
https://doi.org/10.1016/j.scitotenv.2014.12.057 533
Ayrault, S., Meybeck, M., Mouchel, J.-M., Gaspéri, J., Lestel, L., Lorgeoux, C., Boust, D., 2020. 534
Sedimentary Archives Reveal the Concealed History of Micropollutant Contamination in the 535
Seine River Basin, in: The Handbook of Environmental Chemistry. Springer, Berlin, 536
Heidelberg, pp. 1–32. https://doi.org/10.1007/698_2019_386 537
Bernhardt, E.S., Rosi, E.J., Gessner, M.O., 2017. Synthetic chemicals as agents of global change. 538
Front. Ecol. Environ. 15, 84–90. https://doi.org/10.1002/fee.1450 539
Blanchoud, H., Farrugia, F., Mouchel, J.M., 2004. Pesticide uses and transfers in urbanised 540
catchments. Chemosphere 55, 905–913. https://doi.org/10.1016/j.chemosphere.2003.11.061 541
Blanchoud, H., Schott, C., Tallec, G., Queyrel, W., Gallois, N., Habets, F., Viennot, P., Ansart, P., 542
Desportes, A., Tournebize, J., Puech, T., 2019. How Should Agricultural Practices Be 543
Integrated to Understand and Simulate Long-Term Pesticide Contamination in the Seine River 544
Basin?, in: The Handbook of Environmental Chemistry. Springer, Berlin, Heidelberg, pp. 1– 545
22. https://doi.org/10.1007/698_2019_385 546
Botta, F., Lavison, G., Couturier, G., Alliot, F., Moreau-Guigon, E., Fauchon, N., Guery, B., 547
Chevreuil, M., Blanchoud, H., 2009. Transfer of glyphosate and its degradate AMPA to 548
surface waters through urban sewerage systems. Chemosphere 77, 133–139. 549
https://doi.org/10.1016/j.chemosphere.2009.05.008 550
Caron, F., Wehrle, V., Etienne, M., 2017. The comeback of trimethoprim in France. Médecine Mal. 551
Infect. 47, 253–260. https://doi.org/10.1016/j.medmal.2016.12.001 552
26 Castro, O.G., Vale, C., 1995. Total PCB-organic matter correlation in sediments from three estuarine 553
areas of Portugal. Netherland J. Aquat. Ecol. 29, 297–302. 554
https://doi.org/10.1007/BF02084228 555
Chast, F., 2012. Histoire contemporaine des médicaments, La Découverte. ed. La Découverte, Paris. 556
Chauvel, B., Guillemin, J.-P., Gasquez, J., Gauvrit, C., 2012. History of chemical weeding from 1944 557
to 2011 in France: Changes and evolution of herbicide molecules. Crop Prot. 42, 320–326. 558
https://doi.org/10.1016/j.cropro.2012.07.011 559
Chemspider Database, n.d. http:\\chemspider.com [WWW Document]. URL 560
http://www.chemspider.com/ (accessed 5.16.19). 561
Chiaia-Hernández, A.C., Zander, P.D., Schneider, T., Szidat, S., Lloren, R., Grosjean, M., 2020. High-562
Resolution Historical Record of Plant Protection Product Deposition Documented by Target 563
and Nontarget Trend Analysis in a Swiss Lake under Anthropogenic Pressure. Environ. Sci. 564
Technol. https://doi.org/10.1021/acs.est.0c04842 565
Chiffre, A., Degiorgi, F., Buleté, A., Spinner, L., Badot, P.-M., 2016. Occurrence of pharmaceuticals 566
in WWTP effluents and their impact in a karstic rural catchment of Eastern France. Environ. 567
Sci. Pollut. Res. 1–15. https://doi.org/10.1007/s11356-016-7751-5 568
Crossland, N.O., 1990. A review of the fate and toxicity of 3,4-dichloroaniline in aquatic 569
environments. Chemosphere 21, 1489–1497. https://doi.org/10.1016/0045-6535(90)90054-W 570
da Silva, B.F., Jelic, A., López-Serna, R., Mozeto, A.A., Petrovic, M., Barceló, D., 2011. Occurrence 571
and distribution of pharmaceuticals in surface water, suspended solids and sediments of the 572
Ebro river basin, Spain. Chemosphere 85, 1331–1339. 573
https://doi.org/10.1016/j.chemosphere.2011.07.051 574
Daughton, C.G., 2004. Non-regulated water contaminants: emerging research. Environ. Impact 575
Assess. Rev., Environment and Health: new answers, new questions. 24, 711–732. 576
https://doi.org/10.1016/j.eiar.2004.06.003 577
De Feo, G., Antoniou, G., Fardin, H.F., El-Gohary, F., Zheng, X.Y., Reklaityte, I., Butler, D., 578
Yannopoulos, S., Angelakis, A.N., 2014. The Historical Development of Sewers Worldwide. 579
Sustainability 6, 3936–3974. https://doi.org/10.3390/su6063936 580
Dendievel, A.-M., Mourier, B., Coynel, A., Evrard, O., Labadie, P., Ayrault, S., Debret, M., Koltalo, 581
F., Copard, Y., Faivre, Q., Gardes, T., Vauclin, S., Budzinski, H., Grosbois, C., Winiarski, T., 582
Desmet, M., 2020. Spatio-temporal assessment of the polychlorinated biphenyl (PCB) 583
sediment contamination in four major French river corridors (1945–2018). Earth Syst. Sci. 584
Data 12, 1153–1170. https://doi.org/10.5194/essd-12-1153-2020 585
European Commission, 2000. Directive 2000/60/EC of the European Parliament and of the Council of 586
23 October 2000 establishing a framework for Community action in the field of water policy. 587
Off. J Eur. Union L327 1–77. 588
European Commission, 1991a. Directive 91/414/EEC concerning the placing of plant protection 589
products on the market. Off. J Eur. Union L230 20. 590
European Commission, 1991b. Directive 91/271/CEE of the Council of 21 May 1991, related to Urban 591
Waste Water Treatment. Off. J Eur. Union L135 40–52. 592
Fuller, C.C., van Geen, A., Baskaran, M., Anima, R., 1999. Sediment chronology in San Francisco 593
Bay, California, defined by 210Pb, 234Th, 137Cs, and 239,240Pu. Mar. Chem. 64, 7–27. 594
https://doi.org/10.1016/S0304-4203(98)00081-4 595
Garrison, A.W., Pope, J.D., Allen, F.R., Keith, L.H., 1976. GC/MS analysis of organic compounds in 596
domestic wastewaters, in: Identification and Analysis of Organic Pollutants in Water. Ann 597
Arbor Science Publishers, Ann Arbor, MI, pp. 517–556. 598
Gatidou, G., Kotrikla, A., Thomaidis, N.S., Lekkas, T.D., 2004. Determination of two antifouling 599
booster biocides and their degradation products in marine sediments by high performance 600
liquid chromatography–diode array detection. Anal. Chim. Acta, Papers presented at the 3rd 601
Aegean Analytical Chemistry Days 505, 153–159. https://doi.org/10.1016/S0003-602
2670(03)00412-4 603
Hara, K., Kuroda, M., Yabar, H., Kimura, M., Uwasu, M., 2016. Historical development of 604
wastewater and sewage sludge treatment technologies in Japan – An analysis of patent data 605
from the past 50 years. Environ. Dev. 19, 59–69. https://doi.org/10.1016/j.envdev.2016.05.001 606
27 Hignite, C., Azarnoff, D.L., 1977. Drugs and drug metabolites as environmental contaminants:
607
chlorophenoxyisobutyrate and salicyclic acid in sewage water effluent. Life Sci. 20, 337–341. 608
https://doi.org/10.1016/0024-3205(77)90329-0 609
Jaffrézic, A., Jardé, E., Soulier, A., Carrera, L., Marengue, E., Cailleau, A., Le Bot, B., 2017. 610
Veterinary pharmaceutical contamination in mixed land use watersheds: from agricultural 611
headwater to water monitoring watershed. Sci. Total Environ. 609, 992–1000. 612
https://doi.org/10.1016/j.scitotenv.2017.07.206 613
Joss, A., Keller, E., Alder, A.C., Göbel, A., McArdell, C.S., Ternes, T., Siegrist, H., 2005. Removal of 614
pharmaceuticals and fragrances in biological wastewater treatment. Water Res. 39, 3139– 615
3152. https://doi.org/10.1016/j.watres.2005.05.031 616
Kaci, A., Petit, F., Fournier, M., Cécillon, S., Boust, D., Lesueur, P., Berthe, T., 2016. Diversity of 617
active microbial communities subjected to long-term exposure to chemical contaminants along 618
a 40-year-old sediment core. Environ. Sci. Pollut. Res. 23, 4095–4110. 619
https://doi.org/10.1007/s11356-015-4506-7 620
Kaci, A., Petit, F., Lesueur, P., Boust, D., Vrel, A., Berthe, T., 2014. Distinct diversity of the czcA 621
gene in two sedimentary horizons from a contaminated estuarine core. Environ. Sci. Pollut. 622
Res. 21, 10787–10802. https://doi.org/10.1007/s11356-014-3029-y 623
Keil, R.G., Montlucon, D.B., Prahli, F.G., 1994. Sorptive preservation of labile organic matter in 624
marine sediments. Nature 370, 18. https://doi.org/10.1038/370549a0 625
Kerrigan, J.F., Sandberg, K.D., Engstrom, D.R., LaPara, T.M., Arnold, W.A., 2018. Sedimentary 626
record of antibiotic accumulation in Minnesota Lakes. Sci. Total Environ. 621, 970–979. 627
https://doi.org/10.1016/j.scitotenv.2017.10.130 628
Klaminder, J., Brodin, T., Sundelin, A., Anderson, N.J., Fahlman, J., Jonsson, M., Fick, J., 2015. 629
Long-term persistence of an anxiolytic drug (oxazepam) in a large freshwater lake. Environ. 630
Sci. Technol. 49, 10406–10412. https://doi.org/10.1021/acs.est.5b01968 631
Kodešová, R., Grabic, R., Kočárek, M., Klement, A., Golovko, O., Fér, M., Nikodem, A., Jakšík, O., 632
2015. Pharmaceuticals’ sorptions relative to properties of thirteen different soils. Sci. Total 633
Environ. 511, 435–443. https://doi.org/10.1016/j.scitotenv.2014.12.088 634
Kuang, Y., Guo, X., Hu, J., Li, S., Zhang, R., Gao, Q., Yang, X., Chen, Q., Sun, W., 2020. Occurrence 635
and risks of antibiotics in an urban river in northeastern Tibetan Plateau. Sci. Rep. 10, 20054. 636
https://doi.org/10.1038/s41598-020-77152-5 637
Lahti, M., Oikari, A., 2012. Vertical distribution of pharmaceuticals in lake sediments—citalopram as 638
potential chemomarker. Environ. Toxicol. Chem. 31, 1738–1744. 639
https://doi.org/10.1002/etc.1901 640
Lara-Martín, P.A., Renfro, A.A., Cochran, J.K., Brownawell, B.J., 2015. Geochronologies of 641
Pharmaceuticals in a Sewage-Impacted Estuarine Urban Setting (Jamaica Bay, New York). 642
Environ. Sci. Technol. 49, 5948–5955. https://doi.org/10.1021/es506009v 643
Loos, R., Carvalho, R., António, D.C., Comero, S., Locoro, G., Tavazzi, S., Paracchini, B., Ghiani, 644
M., Lettieri, T., Blaha, L., Jarosova, B., Voorspoels, S., Servaes, K., Haglund, P., Fick, J., 645
Lindberg, R.H., Schwesig, D., Gawlik, B.M., 2013. EU-wide monitoring survey on emerging 646
polar organic contaminants in wastewater treatment plant effluents. Water Res. 47, 6475– 647
6487. https://doi.org/10.1016/j.watres.2013.08.024 648
Loos, R., Gawlik, B.M., Locoro, G., Rimaviciute, E., Contini, S., Bidoglio, G., 2009. EU-wide survey 649
of polar organic persistent pollutants in European river waters. Environ. Pollut. 157, 561–568. 650
https://doi.org/10.1016/j.envpol.2008.09.020 651
McCance, W., Jones, O.A.H., Edwards, M., Surapaneni, A., Chadalavada, S., Currell, M., 2018. 652
Contaminants of Emerging Concern as novel groundwater tracers for delineating wastewater 653
impacts in urban and peri-urban areas. Water Res. 146, 118–133. 654
https://doi.org/10.1016/j.watres.2018.09.013 655
Paijens, C., Bressy, A., Frère, B., Tedoldi, D., Mailler, R., Rocher, V., Neveu, P., Moilleron, R., 2021. 656
Urban pathways of biocides towards surface waters during dry and wet weathers: Assessment 657
at the Paris conurbation scale. J. Hazard. Mater. 402, 123765. 658
https://doi.org/10.1016/j.jhazmat.2020.123765 659
Peters, L.I., Rose, N.L., Yang, H., Klánová, J., Moehring, T., Harrad, S., 2020. Temporal Trends in 660
Radiometrically Dated Sediment Cores from English Lakes Show Polybrominated Diphenyl 661
28 Ethers Correlate with Brominated but not Mixed Bromo/Chloro Dioxins and Furans. Sci. 662
Total Environ. 143118. https://doi.org/10.1016/j.scitotenv.2020.143118 663
Petrie, B., McAdam, E.J., Lester, J.N., Cartmell, E., 2014. Obtaining process mass balances of 664
pharmaceuticals and triclosan to determine their fate during wastewater treatment. Sci. Total 665
Environ. 497–498, 553–560. https://doi.org/10.1016/j.scitotenv.2014.08.003 666
Robeck, G.G., Dostal, K.A., Cohen, J.M., Kreissl, J.F., 1965. Effectiveness of Water Treatment 667
Processes in Pesticide Removal. J. AWWA 57, 181–199. https://doi.org/10.1002/j.1551-668
8833.1965.tb01386.x 669
Rocher, V., Azimi, S., Syndicat interdépartemental pour l’assainissement de l’agglomération 670
parisienne, 2017. Evolution de la qualité de la Seine en lien avec les progrès de 671
l’assainissement de 1970 à 2015, Johanet. ed. Paris. 672
Salter, A.J., 1982. Overview. Trimethoprim-Sulfamethoxazole: An Assessment of More than 12 Years 673
of Use. Rev. Infect. Dis. 4, 196–236. https://doi.org/10.1093/clinids/4.2.196 674
Santschi, P.H., Presley, B.J., Wade, T.L., Garcia-Romero, B., Baskaran, M., 2001. Historical 675
contamination of PAHs, PCBs, DDTs, and heavy metals in Mississippi River Delta, Galveston 676
Bay and Tampa Bay sediment cores. Mar. Environ. Res. 52, 51–79. 677
https://doi.org/10.1016/S0141-1136(00)00260-9 678
Stein, K., Ramil, M., Fink, G., Sander, M., Ternes, T.A., 2008. Analysis and sorption of psychoactive 679
drugs onto sediment. Environ. Sci. Technol. 42, 6415–6423. 680
https://doi.org/10.1021/es702959a 681
Tamtam, F., Le Bot, B., Dinh, T., Mompelat, S., Eurin, J., Chevreuil, M., Bonté, P., Mouchel, J.-M., 682
Ayrault, S., 2011. A 50-year record of quinolone and sulphonamide antimicrobial agents in 683
Seine River sediments. J. Soils Sediments 11, 852–859. https://doi.org/10.1007/s11368-011-684
0364-1 685
Tamtam, F., Mercier, F., Le Bot, B., Eurin, J., Tuc Dinh, Q., Clément, M., Chevreuil, M., 2008. 686
Occurrence and fate of antibiotics in the Seine River in various hydrological conditions. Sci. 687
Total Environ. 393, 84–95. https://doi.org/10.1016/j.scitotenv.2007.12.009 688
Thiebault, T., 2020. Sulfamethoxazole/Trimethoprim ratio as a new marker in raw wastewaters: A 689
critical review. Sci. Total Environ. 715, 136916. 690
https://doi.org/10.1016/j.scitotenv.2020.136916 691
Thiebault, T., Chassiot, L., Fougère, L., Destandau, E., Simonneau, A., Van Beek, P., Souhaut, M., 692
Chapron, E., 2017. Record of pharmaceutical products in river sediments: A powerful tool to 693
assess the environmental impact of urban management? Anthropocene 18, 47–56. 694
https://doi.org/10.1016/j.ancene.2017.05.006 695
Tinti, A., Tugnoli, V., Bonora, S., Francioso, O., 2015. Recent applications of vibrational mid-Infrared 696
(IR) spectroscopy for studying soil components: a review. J. Cent. Eur. Agric. 16, 0–0. 697
https://doi.org/10.5513/JCEA01/16.1.1535 698
Tran, N.H., Reinhard, M., Khan, E., Chen, H., Nguyen, V.T., Li, Y., Goh, S.G., Nguyen, Q.B., Saeidi, 699
N., Gin, K.Y.-H., 2019. Emerging contaminants in wastewater, stormwater runoff, and surface 700
water: Application as chemical markers for diffuse sources. Sci. Total Environ. 676, 252–267. 701
https://doi.org/10.1016/j.scitotenv.2019.04.160 702
Välitalo, P., Kruglova, A., Mikola, A., Vahala, R., 2017. Toxicological impacts of antibiotics on 703
aquatic micro-organisms: A mini-review. Int. J. Hyg. Environ. Health, Special Issue: Eighth 704
PhD students workshop: Water and Health – Cannes 2016 220, 558–569. 705
https://doi.org/10.1016/j.ijheh.2017.02.003 706
Verlicchi, P., Al Aukidy, M., Zambello, E., 2012. Occurrence of pharmaceutical compounds in urban 707
wastewater: Removal, mass load and environmental risk after a secondary treatment—A 708
review. Sci. Total Environ. 429, 123–155. https://doi.org/10.1016/j.scitotenv.2012.04.028 709
Vrel, A., Boust, D., Lesueur, P., Deloffre, J., Dubrulle-Brunaud, C., Solier, L., Rozet, M., Thouroude, 710
C., Cossonnet, C., Thomas, S., 2013. Dating of sediment record at two contrasting sites of the 711
Seine River using radioactivity data and hydrological time series. J. Environ. Radioact. 126, 712
20–31. https://doi.org/10.1016/j.jenvrad.2013.06.005 713
Wittmer, I.K., Bader, H.-P., Scheidegger, R., Singer, H., Lück, A., Hanke, I., Carlsson, C., Stamm, C., 714
2010. Significance of urban and agricultural land use for biocide and pesticide dynamics in 715
surface waters. Water Res. 44, 2850–2862. https://doi.org/10.1016/j.watres.2010.01.030 716
29 Zgheib, S., Moilleron, R., Chebbo, G., 2012. Priority pollutants in urban stormwater: Part 1 – Case of 717
separate storm sewers. Water Res., Special Issue on Stormwater in urban areas 46, 6683– 718
6692. https://doi.org/10.1016/j.watres.2011.12.012 719
Zhanel, G.G., Ennis, K., Vercaigne, L., Walkty, A., Gin, A.S., Embil, J., Smith, H., Hoban, D.J., 2002. 720
A Critical Review of the Fluoroquinolones. Drugs 62, 13–59. 721
https://doi.org/10.2165/00003495-200262010-00002 722
Zhi, H., Kolpin, D.W., Klaper, R.D., Iwanowicz, L.R., Meppelink, S.M., LeFevre, G.H., 2020. 723
Occurrence and Spatiotemporal Dynamics of Pharmaceuticals in a Temperate-Region 724
Wastewater Effluent-Dominated Stream: Variable Inputs and Differential Attenuation Yield 725
Evolving Complex Exposure Mixtures. Environ. Sci. Technol. 54, 12967–12978. 726
https://doi.org/10.1021/acs.est.0c02328 727
Zhou, J., Broodbank, N., 2014. Sediment-water interactions of pharmaceutical residues in the river 728
environment. Water Res. 48, 61–70. https://doi.org/10.1016/j.watres.2013.09.026 729
Zhou, L.-J., Wu, Q.L., Zhang, B.-B., Zhao, Y.-G., Zhao, B.-Y., 2016. Occurrence, spatiotemporal 730
distribution, mass balance and ecological risks of antibiotics in subtropical shallow Lake 731
Taihu, China. Environ. Sci. Process. Impacts. https://doi.org/10.1039/C6EM00062B 732
Zhou, L.-J., Ying, G.-G., Liu, S., Zhao, J.-L., Yang, B., Chen, Z.-F., Lai, H.-J., 2013. Occurrence and 733
fate of eleven classes of antibiotics in two typical wastewater treatment plants in South China. 734
Sci. Total Environ. 452, 365–376. https://doi.org/10.1016/j.scitotenv.2013.03.010 735
736 737 738