HAL Id: hal-02383001
https://hal.archives-ouvertes.fr/hal-02383001
Submitted on 27 Nov 2020HAL is a multi-disciplinary open access archive for the deposit and dissemination of sci-entific research documents, whether they are pub-lished or not. The documents may come from teaching and research institutions in France or abroad, or from public or private research centers.
L’archive ouverte pluridisciplinaire HAL, est destinée au dépôt et à la diffusion de documents scientifiques de niveau recherche, publiés ou non, émanant des établissements d’enseignement et de recherche français ou étrangers, des laboratoires publics ou privés.
The crystal growth of smectite: A study based on the
change in crystal-chemistry and morphology of saponites
with synthesis time
Chaoqun Zhang, Sabine Petit, Hongping He, Frederic Villieras, Angelina
Razafitianamaharavo, Fabien Baron, Qi Tao, Jianxi Zhu
To cite this version:
Chaoqun Zhang, Sabine Petit, Hongping He, Frederic Villieras, Angelina Razafitianamaharavo, et al.. The crystal growth of smectite: A study based on the change in crystal-chemistry and morphol-ogy of saponites with synthesis time. ACS Earth and Space Chemistry, ACS, 2019, 4, pp.14–23. �10.1021/acsearthspacechem.9b00194�. �hal-02383001�
The crystal growth of smectite: A study based
on the change in crystal-chemistry and
morphology of saponites with synthesis time
Chaoqun Zhang†§‡#, Sabine Petit*§, Hongping He*†#, Frédéric Villiéras‖, Angelina
Razafitianamaharavo‖, Fabien Baron§, Qi Tao†#, Jianxi Zhu†#
† CAS Key Laboratory of Mineralogy and Metallogeny/Guangdong Provincial Key
Laboratory of Mineral Physics and Materials, Guangzhou Institute of Geochemistry, Chinese Academy of Sciences, Guangzhou 510640, PR China
§ Institut de Chimie des Milieux et Matériaux de Poitiers (IC2MP), UMR 7285 CNRS,
Université de Poitiers, F-86073 Poitiers Cedex 9, France
‖Laboratoire Interdisciplinaire des Environnements Continentaux Université de
Lorraine, CNRS, LIEC, F-54000 Nancy, France
‡ University of Chinese Academy of Sciences, Beijing 100049, PR China
# Institutions of Earth Science, Chinese Academy of Sciences, Beijing 100029, PR
China.
Corresponding Authors
*E-mail: sabine.petit@univ-poitiers.fr
ABSTRACT
Smectites are 2:1 type swelling clay minerals widely distributed in the Earth’s crust. The unique structures and properties endow them with various applications in many fields. However, their growth process and mechanism are still not completely understood. In this study, we tried to understand this growth process and pattern from the perspective of crystal-chemistry and morphology. Smectites were synthesized by hydrothermal treatment of starting materials at 220°C under autogenous pressure from 0.25 to 30 days. The starting materials were obtained from mixtures of Mg- and Ni- smectite precursors synthesized at 150°C for 1 day with identical molar weight. The starting materials, as well as further synthesized samples, are identified as smectite, saponite type, by X-ray diffraction analysis (XRD), and Fourier-transform infrared (FTIR) spectroscopy. The FTIR spectra of the starting material exhibited the vMg3OH and vNi3OH bands only. After the hydrothermal treatment (220°C) of the starting materials, the vMg2NiOH and vNi2MgOH bands appear and relatively increase with the prolonged treatment, indicating the appearance of Mg-Ni neighbouring in the octahedral sheet of saponite, and thus the crystallization of newly formed saponite with mixed composition. Argon adsorption and STEM results are consistent and indicate that the mean particle size of the synthesized saponites increases for the short duration and tends to remain stagnant from 14 days to 30 days. The evolution of the Mg and Ni distribution and of the particle size from argon adsorption and STEM imply the following: (i) the distribution of the octahedral cations tends to be random; (ii) the combination of argon adsorption and STEM offers powerful evidence for the increase of particle size; (iii) crystal growth proceeds via a lateral extension of the layers by surface-controlled growth. The experimental results indicate the viability and effectiveness of coupling FTIR, argon adsorption and STEM in illuminating the crystal-chemistry and morphology at the early stage of the crystal growth process of smectite.
Keywords: Smectite, Crystal Growth, Crystal-chemistry, Argon Adsorption,
INTRODUCTION
Smectite, which is ubiquitous on earth’s crust, has attracted many attentions because their chemic-physical nature endows them with various applications in many fields1. Their formation processes not only affect their usage but also respond to geochemistry environment2-4. Smectite formation is a complicated process related to transformation and growth. Smectite from the alteration of other minerals has been extensively studied 3, 5-7. However, there are limited reports about growth mechanisms of smectites. So far, abundant studies have poured intention into clay minerals formation, in which crystal-growth related are generally focused on minerals such as micas8, illite and illite/smectite9-11, kaolinite12-15 other than smectite. In the laboratory, the synthesis approach is advantageous to study the crystal growth of clay minerals and overcome the fact that the early-stage growth of natural clay minerals cannot reappear. However, publications dedicated to the synthesis of smectite mainly focused on composition or morphology with respect to synthesis conditions (temperature, pressure, pH, etc.)12, 16 and rarely with respect to the crystal-growth issue17. Thus, only a few studies dealing with smectite crystal growth are available once illite and illite/smectite are excluded4, 17. Unlike other clay minerals with large crystal size in tridimensional (3D) directions, smectite layers are separated by the hydrated and swelling interlayers, which precludes their 3D growth. In other words, the crystal growth of smectite proceeds merely by lateral extension of the layers, unlike the other clay minerals mentioned above that grow simultaneously in ab and c directions. Moreover, the specific properties of smectite, like crumpled sheets, small particle size, expansibility and flexibility18, 19, increase the difficulty in measuring their growth features. Therefore, it was necessary to explore new perspectives that enable to overcome these limitations to investigate the crystal growth of smectite.
The objective of this study was to explore the growth mechanism of smectites by using the parameters of crystal-chemistry and morphology. A series of trioctahedral smectites (saponites) were synthesized by hydrothermal treatment of starting materials, which included an equal ratio of two end-members saponite precursors (i.e., a pure Mg-saponite precursor and a pure Ni-saponite precursor), from several hours to 1 month. The crystal-chemistry which is mainly regarded as chemical composition and ions distribution in the crystal structure20 was studied by X-ray diffraction (XRD) and Fourier Transform Infrared (FTIR) spectroscopy and the
morphology related to particle shape and size by argon adsorption and scanning transmission electron microscopy (STEM).
Structurally, smectite consists basically of two Si-O tetrahedral sheets with isomorphous substitutions of Al3+, or Fe3+ for Si4+ and one octahedral sheet with substitutions of various cations (e.g., Ni2+ and Li+) for Al3+/Mg2+/Fe3+ 1. Saponite is typical tri-octahedral smectite with tetrahedral charge. Normally, its octahedral sites are occupied by some divalent cations. The given ideal structural formula is expressed as homogeneous Nax[Si4-xAlx][M3]O10(OH)2∙nH2O, where M corresponds to divalent cations, x is the fraction of aluminium present in the tetrahedral sheet (generally 0.3≤x≤0.6), Na is the interlayer cation compensating the tetrahedral charge and
n is the number of interlayer water molecules21-24. In the octahedral sheet, each OH group is linked to three neighbouring M atoms, which allows to systematically investigate the crystal-chemistry of saponite. Indeed, FTIR spectroscopy is available to characterize octahedral cations of smectite, due to the possibility of recognizing the cationic environment of their OH groups via specific OH stretching vibration (vOH) 20, 25-28. The relative absorbance of the vOH bands was used here to determine the variations of cations distribution associated with the crystal growth process of smectites.
The growth process is also necessarily accompanied by changes in morphology that encompass particle size and crystal shape. Coupling with the direct measurement of particle size by STEM, high resolution, low-pressure argon adsorption has been used to assess surface morphology of clay minerals14, 29-31. This enables the simultaneous investigations of all the clay mineral particles that contain basal and edge surfaces and gives an accurate determination of mean basal and edge surface areas32. This method has contributed to obtaining shape and mean size of smectite particles, such as saponite33, montmorillonite34, 35. The recent study of argon adsorption on synthetic nontronite reported that crystal growth brings about variations on mean particle sizes, which means that argon adsorption can be used to studying the growing process of smectite17.
METHODS
Powder XRD patterns were obtained from a Bruker D8 advance diffractometer (CuKα radiation, 40 kV and 40 mA) over the range 2-65° (2θ) with 0.025° (2θ) step size and 0.6 s per step. The patterns of the oriented samples and glycolated samples were collected over the range 2-50° (2θ) with 0.025° (2θ) step size and 0.6 s per step.
A Magna-IR 6700 Nicolet spectrometer was used for MIR spectra over the range 400-4000 cm-1, with an EverGlo source, a CsI beam splitter, a DTGS-CsI detector and a resolution of 4 cm-1 with co-additions of 100 scans. MIR spectra were obtained in transmission through KBr pellets, prepared with 1 mg of sample and 150 mg of KBr salt. The mixture was pressed for 5 min at 8 kbar and dried overnight in an oven at 150 °C. Spectral manipulations were performed using the OMNIC software package. To measure the octahedral cations distribution in the synthesized saponites, decomposition and curve-fitting have been used to obtain the integrated intensities (S) of the different OH-stretching bands20, 26, 27. The S of the bands is proportional to the concentration of absorbing centres of the given OH type assuming that the absorption coefficients are constant for all metal OH stretching vibration bands20, 26. The deconvolution of the stretching vibrations of structural-OH was undertaken using a Gauss–Lorentz cross-product function applied by the PEAKFIT software package. The positions and areas of peaks were obtained until the squared correlation coefficients r2 ≥ 0.995. The S of each decomposed band in each sample was also calculated using Peakfit software. The degree of random distribution of octahedral cations in octahedral sheet of the synthesized saponites (R) was measured by the ratio of the S of the bands involving Mg and Ni neighbouring such as R(IR) = (SvMg2NiOH + SvNi2MgOH) / (SvMg3OH + SvMg2NiOH + SvNi2MgOH + SvNi3OH). When the same number of Mg and Ni randomly distribute in three vacancies around structural-OH, the corresponding theoretical ratio is 12.5% for Mg3OH and 12.5% for Ni3OH, 37.5% for Mg2NiOH and 37.5% for Ni2MgOH, thus R(theory) equals 75%.
Scanning transmission electron microscopy (STEM) observations were performed to study the morphology of ab direction of saponite particle. Less than 1 mg sample was soaked in 10 ml deionized water with slightly stirring for one week to obtain a dilute colloid. Specimens were prepared by dispersing the colloid in 40 ml ethanol and ultrasonically treating them for 30 min. A drop of the resultant suspension was placed on a porous carbon film supported by a copper grid, after which the water and ethanol were evaporated. STEM images were carried out using a FEI Talos F200S high-resolution transmission electron microscope operated at 200 kV. Crystal size distribution (CSD) of the crystal length and width were measured using calibrated STEM images and Nanomeasure software. The number of crystal particles measured was 957 for 150-220-14d and 738 for 150-220-30d. A schematic measurement was shown in Figure S1. Parameter α describes the mean of the natural logarithms of the observations w (length or width)
and equals α = ∑(ln𝑤)f (𝑤) and β2 36describes the variance of the natural logarithms of the observations w and equals β2 = ∑[ln(𝑤) − α]2f(𝑤).
The experimental procedure for high-resolution and low-pressure argon adsorption and the derivative isotherm summation (DIS) methods were designed by Michot et al. (1990)37 and Villiéras et al. (1992, 1997) 29, 30. This method allows the study of surface heterogeneity of solids under appropriate conditions. In the case of phyllosilicates, it has been demonstrated that such adsorption experiments, coupled with a careful analysis of experimental adsorption isotherms, enable a derivation of a shape factor, i.e., edge and basal surface areas14, 29, 30, 32, 33, 38, 39. The quasi-equilibrium technique is based on the adsorbate introduction with a slow, constant, and continuous flow rate through a micro leak37. The flow rate was kept constant, at least up to the BET domain, and was controlled by the pressure imposed before the leak. If the introduction rate is low enough, the measured pressures can be considered quasi-equilibrium pressures. Then, from the recording of quasi-equilibrium pressures (in the range of 10-3 – 3×10⁴ Pa) as a function of time, the adsorption isotherm was derived. From the recording of quasi-equilibrium pressure as a function of time, high-resolution adsorption isotherms with more than 2000 data points were obtained for filling the first monolayer. Due to a large number of experimental data points, the experimental derivative of the adsorbed quantity can be calculated as a function of the logarithm of relative pressure, ln(P/P0), which corresponds to the free energy of adsorption expressed in kT or RT units14, 29, 30. The total derivative adsorption isotherm on a heterogeneous surface can be simulated by using concepts describing adsorption phenomena on heterogeneous surfaces and DIS procedure. The DIS fitting procedure has been described extensively by Villiéras et al. (1992, 1997) 29, 30 and, for swelling clays, by Tournassat et and al. (2003) 34 and Perronnet et al. (2007) 35. For each local isotherm, the following parameters are obtained: ω, the lateral interaction between two neighbouring adsorbed molecules, ln(P/P0), the position of the peak, and Vm, the monolayer capacity.
MATERIALS
1. Synthesis and characterization of saponite precursors
Two saponite precursors were synthesized using a co-precipitated gel as starting material. The co-precipitated gel of theoretical and homogeneous composition Na+0.3 [Si3.7Al0.3][M3]O10(OH)2·nH2O) (M= Mg, Ni) was obtained by mixing solutions of sodium
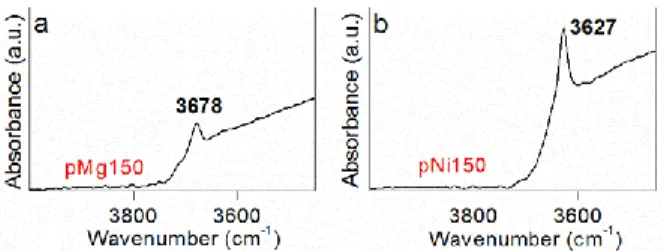
silicate, Al chloride and Mg or Ni chloride40, 41. After precipitation, the gel was collected by filtration and gently washed with deionized water to remove sodium chloride. Then the wet gel was transferred to a polytetrafluoroethylene-lined autoclave and hydrothermally heated at 150°C for 1 day under equilibrium vapour pressure (~1Mpa, pH~9-10). The obtained smectite precursors were washed by filtration then dried at 45°C for 1 week and named as P-Mg150 and P-Ni150. Powder XRD patterns of the Ni and Mg precursors display characteristic reflections of poorly crystallized trioctahedral smectite with the (06,33) diffraction bands at 1.53Å and asymmetric (hk) bands as generally observed for short time and/or low-temperature experiments42 (Figure 1). The precursors synthesized at 150°C are poorly crystallized with unresolved (001) reflection due to very few stacked layers 43. But the TOT-like layered structure with specific dissymmetric (hk) bands is recognizable42. The infrared spectra of the synthetic precursors are similar to those found in the literature for trioctahedral 2:1 clay minerals25, 44 (Figure 2). The band at 3648 cm-1 in Mg smectite precursor (Figure 2a) and at 3629 cm-1 in Ni smectite precursor (Figure 2b) is assigned vMg3OH and vNi3OH, respectively. The Al occupancy of synthetic saponites has been delicately studied in a previous paper40, the results indicate that Al prefer to occupy tetrahedral sites more than octahedral sites and only a little Al in the octahedral sheets whatever the original amount of Al. For the present system, the amount of Al(VI) is estimated to be near 0.0340. Therefore, the two P-Mg150 and P-Ni150 precursors are poorly crystallized Mg-saponite (Na+0.3 [Si3.7Al0.3]IV[Mg3]VIO10(OH)2·nH2O) and Ni-saponites (Na+0.3 [Si3.7Al0.3]IV[Ni3]VIO10(OH)2·nH2O), respectively.
2. Synthesis of saponites
The starting material was prepared by mixing the identical molar weight of Mg and Ni-saponite precursors as follows: the mixture of 0.11g of Na+0.3 [Si3.7Al0.3]IV[Mg3]VIO10(OH)2 (P-Mg150) and 0.14g Na+0.3 [Si3.7Al0.3]IV[Ni3]VIO10(OH)2 (P-Ni150) was added to 30 ml of deionized water with continuous stirring and kept at room temperature for 1 day for dispersion and mix. After that, the mixture and solution were transferred to a polytetrafluoroethylene-lined autoclave and heated at 220°C for different hydrothermal treatment times from 0.25 days to 30 days. The obtained samples were washed by filtration, dried at 45°C for 1 week, and named as 150-220-t (t, the hydrothermal time of synthesis samples). For comparison, a gel of mixed Mg-Ni composition Na+0.3·[Si3.7Al0.3][Mg1.5Ni1.5]O10·nH2O was also prepared by coprecipitation using the same
reactants in stoichiometric amount and was hydrothermally treated at 220°C for 14 days, and then studied as the other synthesized samples. The obtained samples were named gel-220-14d.
RESULTS 1. XRD patterns
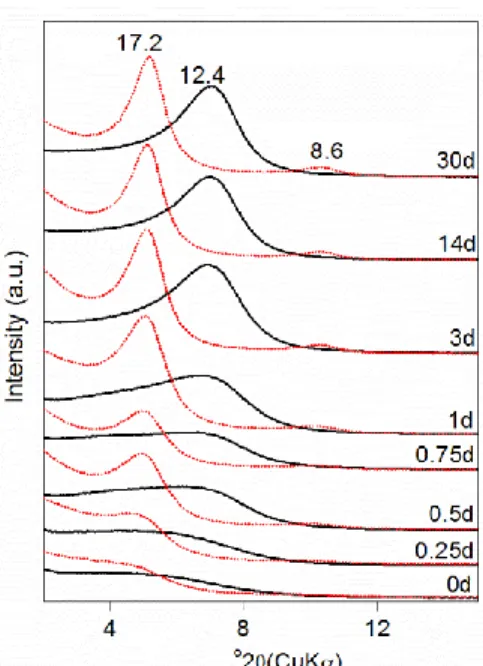
The XRD patterns of the oriented samples display the characteristic behaviour of Na-smectite with a basal spacing d(00l) at ~ 12.4 Å increasing to 17.2 Å after ethylene glycol (EG) intercalation45 (Figure 3). As the synthesis time increases, the (001) reflection becomes narrower, giving evidence that the layer stacking order increased40 (Figure 3). The EG samples exhibit rational 00l reflections, confirming the periodic structure of smectite without any interstratified talc-like layers.
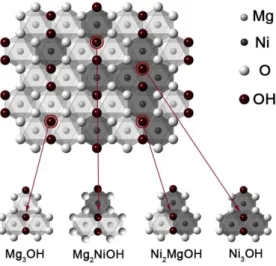
2. FTIR spectra
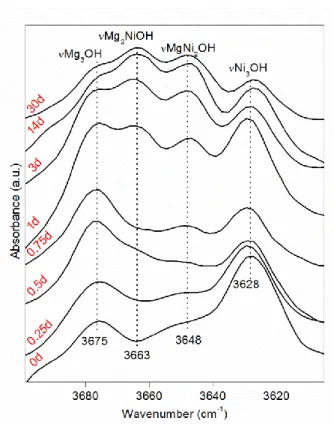
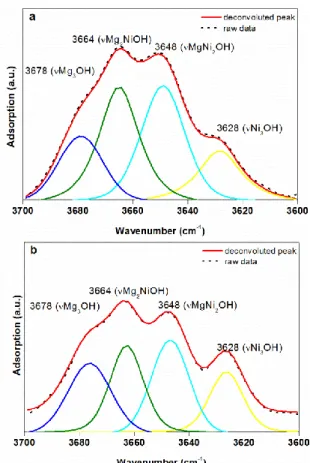
In clay minerals, the OH stretching vibrations are affected by the nature of the octahedral cations to which the hydroxyl groups are coordinated. For the saponite synthesized here, up to four OH stretching vibrations can be distinguished if Mg2+ is partially replaced by another divalent cation Ni2+. This corresponds to the four possible combinations of two different cations within the three octahedral sites that are directly linked to a hydroxyl group, i.e., Mg3OH, Mg2NiOH, MgNi2OH, Ni3OH (Figure 4). Then, the evolution of the relative absorbance of the vibration bands due to these OH groups is used to detect the variation of Ni and Mg distributions in the octahedral sheet of the saponite with the time of synthesis20, 21, 28, 46. The FTIR spectra in the OH-stretching region of the synthesized saponites vary a lot with synthesis time (Figure 5). For the starting material (150-220-0d), the vMg3OH (3675 cm-1) and vNi3OH (3628 cm-1) bands are dominant. A shoulder at 3648 cm-1 due to vMgNi2OH is also observed, giving evidence of some already existing neighbouring Mg-Ni in saponite probably formed during the 1 day at room temperature mixing step. The vMg3OH and vNi3OH bands remain dominant for the shortest synthesis times, but their relative absorbance decreased when synthesis time increased. Concomitantly, the absorbance of the vMg2NiOH (3663cm-1) and the vMgNi2OH (3648 cm-1) bands relatively increases. From 3 days, no more significant changes in the IR spectra is observed with the increase of synthesis time.
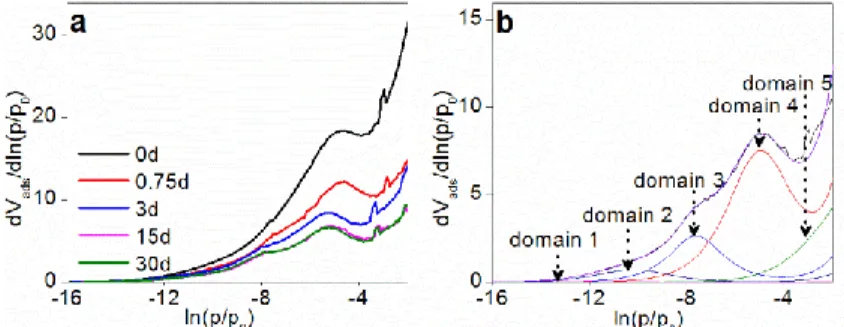
All derivative isothermals of low-pressure argon adsorption are presented in Figure 6a along with the illustration of the DIS fitting results (Figure 6b). Adsorption energy distributions can reveal the classical features of smectites. All the derivative isotherms of synthesized samples exhibit the same feature with the of the peak around ln(p/p0)≈-5, corresponding to the adsorption on the basal surfaces. The shoulder at a higher energy at around ln(p/p0)=6.5-7.5 is due to the adsorption on edge faces. These features are very similar to previous studies of argon adsorption on smectites17, 34, 35. The derivative adsorption isotherms of the two samples 0d and 0.75d reveal that the peaks at ln(p/p0)=6.5-7.5 are not well resolved (Figure 6a), indicating that the samples have less heterogeneous surfaces and they are poorly crystallized. For the sample with 3 days hydrothermal treatment, the peak at ln(p/p0)=6.5-7.5 appears, suggesting the crystallization of a complete structure of smectite17, 47. The derivative adsorption isotherm could be fitted by using the DIS procedure with five characteristic adsorption domains31, 35, 39 (Figure 6b). Similar fitting parameters were used for all samples (Table S1). The two peaks (ln(p/p0)≈-5 and ln(p/p0)=6.5-7.5) are regarded as determining criteria to give assignments of DIS fitting results.
According to the reported results, the derivative isotherms of our samples could be modelled with three high-energy domains (domain 1-3, Table S1) and two low-energy domains (domains 4-5, Table S1), which are attributed to the adsorption on the edge surface and the basal surface respectively. As shown in Figure S1, according to the adsorbed volume of argon, the basal surface area (BSA), edge surface area (ESA), and total surface area (TSA) are calculated on the basis of the adsorbed volume of argon (Figure 7a) and a 13.8Å2 cross-sectional area for each adsorbed argon molecule. The measured TSA of the initial sample (0d) is 429m2/g, and ESA and BSA by DIS procedure are 99 and 330 m2/g, respectively. For sample 3d, TSA, ESA and BSA are 176, 51 and 124m2/g, respectively, exhibiting a significant decrease with comparison to the value of the initial sample (0d). Then surface areas decrease less prominently with synthesis time to 14 days (TSA 136, ESA 33 and BSA 102m2/g) and no obvious change can be observed between the samples 14 and 30 days (Figure 7a). Considering a smectite particle as a circular disk33, the mean characteristic height (H) and diameter (D) of a particle can be calculated from the BSA and ESA by the equations:
H=2/BSA·ρ (1)
D=4/ESA·ρ (2)
Where ρ is the density (2.4g/cm3, according to the structural formula).
The H and D data develop significantly negative correlation with TSA, ESA and BSA from the beginning of synthesis to 14 days, then reach an apparent steady-state from 14 days to 30 days. The starting material (0d) has H and D of about 2.5 ± 0.2 and 17 ± 1 nm, respectively. From 0 to 3 days, H increases to ~6 nm, then increases more slowly to ~9 nm. D also increases with synthesis time until the mean size achieves 40-50 nm (Figure 7b). The increase of D value indicates the growth of smectite particles at least from 0 to 14 days.
4. STEM observations
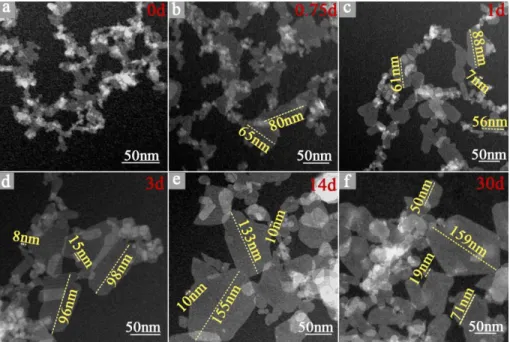
STEM images of the samples clearly display prominent morphological evolution with increasing synthesis time (Figure 8). The particles of sample 150-220-0d are as small as 5-20 nm with shapeless morphology, which indicates the mean particle diameter ~17nm measured from argon adsorption is reliable. The particles are difficult to disperse into detached single crystallites and form aggregates along the blurred edge area (Figure 8a). As the synthesis time increases, the morphology evolved dramatically. In the case of 3 days, small particles with a diameter around 10 nm diameter remain but particles with larger size (50 nm to 100 nm diameter) appear. Meanwhile, the mean diameter measured from argon adsorption is 33 nm for the 3 days sample, suggesting that numerous particles are below 33 nm in size (Figure 8d). After 14 days’ hydrothermal treatment, particles less than 10 nm are scarcely observed, while particles approaching 150 nm appear, which is consistent with the mean diameter ~49 nm measured by argon adsorption (150-220-14d) (Figure 8e). Some euhedral elongated particles of intermediary size are also observed. For the sample after 30 days’ hydrothermal treatment, no significant changes are observed compared to the 14 days sample (Figure 8f).
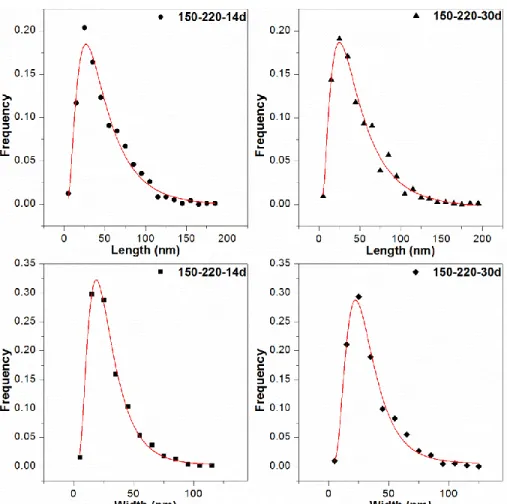
The CSD of length and width of the saponite particles from STEM for samples 14 days and 30 days were plotted in histograms in Figure 9. The four sets of experimental points can be well fitted using lognormal curves with theoretical lognormal ones because the χ2 test indicates that the significance level of all distributions exceeding 20%48. The theoretical lognormal curves calculated from the crystal-size distribution data describe the size distribution profiles. The mean length and width of the smectite particles, along with the parameters α and β2 36 are listed in Table 1.
The mean length and width from STEM images, α and β2 parameters are very similar for these two samples (150-220-14d and 150-220-30d), and the mean size from STEM are almost consistent with mean diameter from argon adsorption (Table 1). CSD and corresponding reduced profiles collected from STEM images for samples 150-220-14d and 150-220-30d are shown in Figure 9 and Figure S2, respectively. All of them displayed an asymmetrical lognormal shape.
DISCUSSION
1. Evolution of the crystal-chemistry of the saponite particles
The occurrence of vMg2NiOH and vMgNi2OH in FTIR spectra reveals that the Mg and Ni atoms locate at the neighbouring octahedral sites in the octahedral sheet of the synthesized saponites. The starting material was a mixture of pure Mg- and Ni- saponite precursors, the occurrence of neighbouring Mg and Ni in the synthesized saponite implies the dissolution of precursors and recrystallization of a neoformed Ni-Mg mixed saponite. The precursors and further hydrothermally synthesized samples are all saponites that possess the same TOT structure and tetrahedral cations but different location or distribution of octahedral cations. Thus, the evolution of the random distribution of octahedral cations in the octahedral sheet of synthetic saponites (R(IR)) records the dissolution-recrystallization processes (Table 2). The decomposition examples to obtain R(IR)) are shown in Figure 10.
The spectrum obtained from the gel-220-14d saponite sample, synthesized from a Ni-Mg co-precipitate for comparison, is assumed to be a reference for random distribution of the octahedral cations. The R(IR) measured for this gel-220-14d sample is 62% (Table 2) and is less than the theoretically R(theory) 75% for a totally random distribution of a 1.5Mg-1.5Ni octahedral sheet. This deviation is probably due to inevitable imprecision of the decomposition when applied to such smectite. Indeed, the contribution of residual interlayer water generates a band in this region in FTIR spectra of smectite49, and the tetrahedral charge induces a splitting of the OH-stretching bands of saponite when using KBr pellets50. For a mean tetrahedral charge of 0.3 per half unit cell, the contribution of the second bands due to perturbed structural OH is probably small50, but makes the results of decomposition with four bands as done here, approximately. Then, even if the existence of some Ni-Mg segregation cannot be totally excluded, the R(IR) measured for the sample gel-220-14d rather probably corresponds to the total random distribution of Mg and Ni in
the octahedral sheets in the synthesized saponite. The R(IR) for the sample 150-220-14d is lower than that of sample gel-220-14d, suggesting an incompletely random distribution of Ni and Mg in sample 150-220-14d. This lower R(IR) means that some starting materials remain in the sample 150-220-14d. R(IR) clearly increases with the hydrothermal treatment time up to 55% but less than 62% (Table 2), suggesting the incomplete dissolution-recrystallization of saponite precursors.
2. Lateral crystal growth
In the initial stage of hydrothermal treatment, the diameter of particles in (a,b) plane is much larger than their height in the same sample (Figure 7b). From literature13, 51-54, two processes may control the crystal growth in the c* direction of phyllosilicates, i.e., layer nucleation on the (001) face or continuous incorporation of atoms or ‘building blocks’ on a spiral step originating from a screw dislocation emerging on the (001) surface. Such phenomena have been observed in many kinds of phyllosilicates, such as spiral growth on (001) surface of phlogopite51, illite53, rectorite54, kaolinite13, and mixed-layer mica-smectite52. Two-dimensional nucleation was observed on the (001) growth surfaces of sudoite55, which produced an increase in the number of stacking layers. However, these 3D growth mechanisms are probably not valid for smectite. Indeed, interlayer hydration of smectite probably precludes their 3D growth56. The particle thickness measured by argon adsorption results to the stacking of layers of saponite in dry condition (argon-adsorption experimental condition) and its increase with time is unable to correspond to an actual growth along c* direction. The crystal growth process is mainly dominated by the lateral extension of the synthesized saponite layers. The PBCs theory of Hartman (1973) was suggested by Meunier (2006) to be applicable to clay minerals57, which implied a crystal growth process of clay minerals essentially bi-dimensional within the (001) plane. This two-dimensional growth was observed from nontronite synthesized in a closed hydrothermal system, as well as present saponite17. However, the detailed growth processes of synthetic nontronite were not described, notably due to the lack of STEM data. Here, it is possible to give some evidence of the growth in (a,b) plane according to the results of crystal-chemistry and morphology.
To date, there is no experimental study directly concerning the smectite layers growth in (a, b) plane. The closest studies are the rare reports about natural smectite growth4 and extensively publications concerning the 3D growth of natural illite and illite/smectite9, 11, 58. In this study, it is the first time that the smectite growth in (a, b) plane is recorded and elucidated by using appropriate methods (clay minerals synthesis, FTIR, STEM and Argon adsorption). The crystal-chemistry evolution recorded from structural OH comprehensively demonstrates an incomplete dissolution-recrystallization of precursors after 30 days’ hydrothermal treatment at 220°C and the morphology features outlined from argon adsorption and STEM indicate the growth of saponite crystals in a kinetic process. Saponite growth experiments were conducted in a sealed hydrothermal system at 220oC, thus, when the precursors formed at 150oC exposed to 220°C fluid, solid-solution reactions tend to take place to reduce the free energy of the whole system. Dissolution and recrystallization are the principles of driving mechanisms for all re-equilibration reactions in the presence of a fluid phase59. The neoformed saponite particles are the products of re-equilibration reactions of the hydrothermal system.
From 0 day to 14 days, the dissolution rate of precursors increases (Figure 11), simultaneously, the mean crystal size increases (Figure 7b) and small particles continuously disappear (Figure 8) with increasing time, illustrating the evolution of crystal-chemistry and morphology in the continuous growth process (Figure 11). Moreover, BSA and ESA from argon adsorption were based on the surface energy heterogeneity. Hence, the evolution of TSA (BSA+ESA) not only reflects the variation of particle size and morphology but also the trend of variation of total surface energy in this system. The initial rapid decline of TSA (Figure 7a) is the inevitable result of the growth of smaller particles (which have a larger specific surface free energy). All these phenomena result from the ripening process when precursors, formed at a lower temperature, are suddenly exposed to an environment with higher temperature36. From 14 days to 30 days, the mean diameter, length and width of crystal particles seem to be in a steady-state (Table1, Figure 7b). Correspondingly, the shape of the CSD (Figure 9), α and β2 parameters from crystal length and width are virtually constant with time increasing (Table 1). Interestingly, there is a slight increase in R(IR) during this period, suggesting that the ripening does not cease. During this period, the ripening of saponite becomes so slow so that the evolutionary process can be detected by R(IR) only instead of particle size.
Because CSD of mineral has distinctive shapes related to the mineral’s crystal-growth history, it offers possibilities to deduce the growth processes from measured CSD36. The smectite CSD may thus have interesting implications in inferring their growth processes. Based on Eberl et al. (1998)’s simulations, the shape of the CSD (Figure 9) and the reduced CSD (Figure S2) profiles obtained for our samples are indicative of random ripening in closed systems or surface-controlled growth in open systems36. These authors defined an open system as a system in which matter is supplied to the growing crystals by a source other than the growing phase, while they defined a closed system as a system where a single phase is involved, the less stable crystals dissolving for other crystals to grow. Following this definition, the experimental system studied here is an open system where the growing crystals refer to the Mg-Ni saponite and supplied matter derives from Mg- and Ni-saponite precursors. Consequently, the evolutionary mechanism of saponite in the present system is surface-controlled growth. The α and β2 values measured for the synthesized saponite, when plotted on the Eberl et al. (1998) diagram, confirm the growth mechanism of synthetic saponite as surface-controlled growth (Figure 12). Theoretically, surface-controlled growth proceeds through the incorporation of growth species adsorbed on the growth surface into the crystal structure, when the diffusion of the growth species from the source to the growth surface is sufficiently rapid, i.e., the concentration of growth species on the surface is the same as that in the source60. In the present case, saponite layer extension is controlled by edge surface-controlled growth, and the growth rate of newly formed Mg-Ni saponite could be limited by the concentration of growth species from precursors. This concentration of growth species is affected by the dissolution rate of precursors. Comparing to the theoretical open system simulated by Eberl et al. (1998), the present experiment is conducted on an experimental sealed system with temperature and pressure. In such systems, surface free energy then tends toward a minimum by the dissolution of small particles and the growth of large particles as matter is transferred from the former to the latter through the solution. As a result, the small particles gradually disappear and the mean crystallite size increases, at last, the level of supersaturation in the solution decreases61, 62. These can be supported by the trend of TSA and particle size (Figure 7, 8). Thus, the growth species could derive from the precursors with small particle size. The rapid growth in the initial period may benefit from the high concentration of growth species resulting from the rapid dissolution of small particles of precursors (Figure 11). As the ripening proceeds, the growth rate slows down gradually due to the lower amount of
available growth species or decreased free energy.
The metastable intermediates can transform into the next stable species according to non-classical crystal growth like nanoparticle attachment63. This non-classical crystal growth in solution is a widespread phenomenon in geochemical, biomineral, and synthetic material systems63. Theoretically, in the present system, the particle attachment can easily occur to eliminate the defects and free energy through the rearrangement in the contact area of precursors, especially in a nanoparticle reaction processes64. Notably, the Ni-Mg neighbouring is observed in the starting material (1 day at room temperature) (Figure 5) and mixed OH (R(IR)) slightly rises but the mean particle size dramatically increases from 3 days to 14 days (Figure 11). These could be the evidence that saponites grow accompanying by the particle attachment along the edge faces. Indeed, agglomeration may occur together simultaneously with ripening but may be imperceptible by CSD models36. As a result, some disharmonic particles observed on STEM images (Figure 8) could issue from solid attachment. Some euhedral elongated particles (Figure 8) may be related to the homogeneous nucleation65.
4. Comparison with previous studies
Chiristidis (2001) has used the CSD models of (Eberl et al., (1998)36 to investigate the growth mechanisms of smectite in bentonite in natural system4. The results indicated smectite experienced supply-controlled crystal growth in an open system or random ripening in a closed system. This previous publication was based on natural crystal particles with large size (several hundred nanometers) in a natural system, which could provide important reference to the morphology feature but may lack in studying on small particle size (few ten nanometers as in this study) smectite in the early stage of growth and their crystal-chemistry evolution in the growth history. In present system, it is difficult to obtain the CSD and corresponding parameters of small particle samples within 3 days. Thus, CSD was merely successfully applied to estimate the state of the system from 14 days to 30 days, failing to establish an integral process of saponite growth. Although these rare publications about smectite growth which are confined to theoretical speculations or natural systems offer valuable references to present study, they lack comprehensive analysis on the evolution of chemistry, structure and morphology, and rate of crystal growth. The present study used the amount of M-OH (M=Mg, Ni) to estimate the neighbouring Mg and Ni in the octahedral sheet, morphology to estimate the size of the basal
plane and TEM images to directly observe particle shapes and count CSD models. The crystal-chemistry and morphology on real time scale were recorded which infer the main growth mechanism of the synthetic saponites as surface-controlled growth. This approach also works for analyzing the growth processes of other minerals especially in an experimental system that could not be observed directly. Using these analyses in parallel should be important and unique in developing the argument in geochemistry and material sciences. Moreover, not only morphology can reverse the growth history, but crystal-chemistry also reflects the growth processes and geological environment. Comprehensively considering all the evolution factors could be of high significance in the explorations of geochemical, biomineral, and synthetic material systems.
ASSOCIATED CONTENT Supporting Information
Main parameters obtained from the application of DIS method to argon adsorption at 77 K on synthesized samples, measurement schematic of crystal size from STEM images and reduced profiles of crystal size distribution (CSD) of saponite crystal length and width.
ACKNOWLEDGEMENT
The authors acknowledge A. Decarreau and reviewers for their comments and suggestions which greatly improved this paper. The financial supports of National Natural Science Foundation of China (Grant Nos.41530313, 41772039), National Science Fund for Distinguished Young Scholars of China (Grant No.41825003), CAS Key Research Program of Frontier Sciences (Grant No. QYZDJ-SSW-DQC023-1), the CAS/SAFEA International Partnership Program for Creative Research Teams (Grant No. 20140491534), the European Union (ERDF), "Région Nouvelle Aquitaine", and French « Ministère de l’Enseignement Supérieur et de la Recherche » are greatly appreciated.
REFERENCES
(1) Brigatti, M. F.; Galan, E.; Theng, B. Developments in clay science: Structure and
mineralogy of clay minerals. Elsevier: Amsterdam, Netherlands, 2013; DOI: 10.1016/b978-0-08-098258-8.00002-x.
(2) Michalopoulos, P.; Aller, R. C. Rapid clay mineral formation in Amazon delta sediments:
reverse weathering and oceanic elemental cycles. Science 1995, 270 (5236), 614-617.
(3) Christidis, G. E.; Huff, W. D. Geological aspects and genesis of bentonites. Elements 2009, 5 (2), 93-98.
(4) Christidis, G. E. Formation and growth of smectites in bentonites: a case study from
Kimolos Island, Aegean, Greece. Clays Clay Miner. 2001, 49 (3), 204-215.
(5) Badaut, D.; Risacher, F. Authigenic smectite on diatom frustules in Bolivian saline lakes.
Geochim. Cosmochim. Acta 1983, 47 (3), 363-375.
(6) Banfield, J. F.; Barker, W. W. Direct observation of reactant-product interfaces formed in
natural weathering of exsolved, defective amphibole to smectite: Evidence for episodic, isovolumetric reactions involving structural inheritance. Geochim. Cosmochim. Acta 1994,
58 (5), 1419-1429.
(7) Cuadros, J. Clay crystal-chemical adaptability and transformation mechanisms. Clay
Miner. 2012, 47 (2), 147-164.
(8) Mottana, A.; Sassi, F. P.; Thompson, J. B.; Guggenheim, S. Micas: crystal chemistry &
metamorphic petrology. Walter de Gruyter GmbH & Co KG, 2018; Vol.46.
(9) Środoń, J.; Eberl, D. D.; Drits, V. A. Evolution of fundamental-particle size during
illitization of smectite and implications for reaction mechanism. Clay clay Miner. 2000, 48 (4), 446-458.
(10) Drits, V. A.; Eberl, D. D.; Środoń, J. XRD measurement of mean thickness, thickness
distribution and strain for illite and illite-smectite crystallites by the Bertaut-Warren-Averbach technique. Clay clay Miner. 1998, 46 (1), 38-50.
(11) Eberl, D. D.; Środoń, J.; Kralik, M.; Taylor, B. E.; Peterman, Z. E. Ostwald ripening of
clays and metamorphic minerals. Science 1990, 248 (4954), 474-477.
(12) Zhang, D.; Zhou, C. H.; Lin, C. X.; Tong, D. S.; Yu, W. H. Synthesis of clay minerals.
Appl. Clay Sci. 2010, 50 (1), 1-11.
(13) Sunagawa, I.; Koshino, Y. Growth spirals on koalin group minerals. Am. Mineral. 1975,
60 (5-6), 407-412.
(14) Cases, J. M.; Cunin, P.; Grillet, Y.; Poinsignon, C.; Yvon, J. Methods of analyzing
morphology of kaolinites: Relations between crystallographic and morphological properties.
Clay Miner. 1986, 21 (1), 55-68.
(15) Güven, N. Mica structure and fibrous growth of illite. Clays Clay Miner. 2001, 49 (3),
189-196.
(16) Kloprogge, J. T.; Komarneni, S.; Amonette, J. E. Synthesis of smectite clay minerals: a
critical review. Clays Clay Miner. 1999, 47 (5), 529-554.
(17) Decarreau, A.; Petit, S.; Andrieux, P.; Villiéras, F.; Pelletier, M.; Razafitianamaharavo,
A. Study of low-pressure argon adsorption on synthetic nontronite: Implications for smectite crystal growth. Clays Clay Miner. 2014, 62 (1-2), 102-111.
(18) Nadeau, P.; Wilson, M.; McHardy, W.; Tait, J. Interstratified clays as fundamental
particles. Science 1984, 225 (4665), 923-925.
(19) Sato, H.; Yamagishi, A.; Kawamura, K. Molecular simulation for flexibility of a single
clay layer. J. Phys. Chem. B 2001, 105 (33), 7990-7997.
(20) Petit, S.; Martin, F.; Wiewiora, A.; De Parseval, P.; Decarreau, A. Crystal-chemistry of
talc: A near infrared (NIR) spectroscopy study. Am. Mineral. 2004, 89 (2-3), 319-326.
(21) Theo Kloprogge, J.; Breukelaar, J.; Geus, J. W.; Ben Jansen, J. Characterization of
Mg-saponites synthesized from gels containing amounts of Na+, K+, Rb+, Ca2+, Ba2+, or Ce4+ Equivalent to the CEC of the Saponite. Clays Clay Miner. 1994, 42 (1), 18-22.
(22) Vogels, R.; Kloprogge, J. T.; Geus, J. W. Synthesis and characterization of saponite
(23) Costenaro, D.; Bisio, C.; Carniato, F.; Gatti, G.; Oswald, F.; Meyer, T. B.; Marchese, L.
Size effect of synthetic saponite-clay in quasi-solid electrolyte for dye-sensititized solar cells. Sol. Energ. Mat. Sol. C. 2013, 117, 9-14.
(24) Zhou, C. H.; Zhou, Q.; Wu, Q. Q.; Petit, S.; Jiang, X. C.; Xia, S. T.; Li, C. S.; Yu, W. H.
Modification, hybridization and applications of saponite: An overview. Appl. Clay Sci. 2019,
168, 136-154.
(25) Wilkins, R. W. T.; Ito, J. Infrared spectra of some synthetic talcs. Am. Mineral. 1967, 52
(11-1), 1649-1661.
(26) Slonimskaya, M. V.; Besson, G.; Dainyak, L. G.; Tchoubar, C.; Drits, V. A.
Interpretation of the Ir-spectra of celadonites and glauconites in the region of OH-stretching frequencies. Clay Miner. 1986, 21 (3), 377-388.
(27) Madejová J.; Komadel, P.; Cicel, B. Infrared study of octahedral site populations in
smectites. Clay Miner. 1994, 29 (3), 319-326.
(28) Petit, S.; Martin, F.; Wiewiora, A.; De Parseval, P.; Decarreau, A. CMS workshop
lectures: Crystal-chemistry of talcs: a NIR and MIR spectroscopic approach. Clay Minerals
Society: Aurora, Colorado, USA, 2005, 13, 41.
(29) Villiéras, F.; Cases, J. M.; Francois, M.; Michot, L. J.; Thomas, F. Texture and surface
energetic heterogeneity of solids from modeling of low-pressure gas-adsorption isotherms.
Langmuir 1992, 8 (7), 1789-1795.
(30) Villiéras, F.; Michot, L. J.; Bardot, F.; Cases, J. M.; Francois, M.; udzinski, W. An
improved derivative isotherm summation method to study surface heterogeneity of clay minerals. Langmuir 1997, 13 (5), 1104-1117.
(31) Villiéras, F.; Mamleev, V. S.; Nicholson, D.; Cases, J. M. Adsorption of spherical
molecules in probing the surface topography: 2. Model of conditional probabilities.
Langmuir 2002, 18 (10), 3963-3979.
(32) Hassan, M. S.; Villiéras, F.; Gaboriaud, F.; Razafitianamaharavo, A. AFM and
low-pressure argon adsorption analysis of geometrical properties of phyllosilicates. J. Colloid
Interf. Sci. 2006, 296 (2), 614-623.
(33) Michot, L. J.; Villiéras, F. Assessment of surface energetic heterogeneity of synthetic
Na-saponites: The role of layer charge. Clay Miner. 2002, 37 (1), 39-57.
(34) Tournassat, C.; Neaman, A.; Villiéras, F.; Bosbach, D.; Charlet, L. Nanomorphology of
montmorillonite particles: Estimation of the clay edge sorption site density by low-pressure gas adsorption and AFM observations. Am. Mineral. 2003, 88 (11-12), 1989-1995.
(35) Perronnet, M.; Villiéras, F.; Jullien, M.; Razafitianamaharavo, A.; Raynal, J.; Bonnin, D.
Towards a link between the energetic heterogeneities of the edge faces of smectites and their stability in the context of metallic corrosion. Geochim. Cosmochim. Acta 2007, 71 (6), 1463-1479.
(36) Eberl, D.; Drits, V.; Srodon, J. Deducing growth mechanisms for minerals from the
shapes of crystal size distributions. Am. J. Sci. 1998, 298 (6), 499-533.
(37) Michot, L.; Francois, M.; Cases, J. M. Surface Heterogeneity Studied by a
Quasi-Equilibrium Gas-Adsorption Procedure. Langmuir 1990, 6 (3), 677-681.
(38) Michot, L. J.; Villiéras, F.; Francois, M.; Yvon, J.; Ledred, R.; Cases, J. M. The structural
microscopic hydrophilicity of talc. Langmuir 1994, 10 (10), 3765-3773.
(39) Bardot, F.; Villiéras, F.; Michot, L. J.; Francois, M.; Gerard, G.; Cases, J. M. High
resolution gas adsorption study on illites permuted with various cations: Assessment of surface energetic properties. J. Disper. Sci. Technol. 1998, 19 (6-7), 739-759.
(40) He, H. P.; Li, T.; Tao, Q.; Chen, T. H.; Zhang, D.; Zhu, J. X.; Yuan, P.; Zhu, R. L.
Aluminum ion occupancy in the structure of synthetic saponites: Effect on crystallinity. Am.
Mineral. 2014, 99 (1), 109-116.
(41) Kawi, S.; Yao, Y. Z. Saponite catalysts with systematically varied Mg/Ni ratio: synthesis,
characterization, and catalysis. Micropor. Mesopor. Mat. 1999, 33 (1-3), 49-59.
(42) Decarreau, A.; Petit, S.; Martin, F.; Farges, F.; Vieillard, P.; Joussein, E. Hydrothermal
synthesis, between 75 and 150 oC, of high-charge, ferric nontronites. Clays Clay Miner.
2008, 56 (3), 322-337.
(43) Decarreau, A. Experimental Crystallogenesis of Mg-Smectite-Hectorite, Stevensite.
Mineral. Bulletin1980, 103 (6), 579-590.
(44) Kloprogge, J., Developments in Clay Science: Application of Vibrational Spectroscopy in
Clay Minerals Synthesis. Elsevier: Amsterdam, Netherlands, 2017; DOI:
10.1016/B978-0-08-100355-8.00008-4.
(45) Brown, G., Crystal Structures of Clay Minerals and Their X-ray Identification. The
Mineralogical Society of Great Britain and Ireland: 1982; DOI: 10.1180/mono-5.
(46) Gates, W.; Petit, S.; Madejová, J. Developments in Clay Science: Applications of
NIR/MIR to Determine Site Occupancy in Smectites. Elsevier: Amsterdam, Netherlands,
2017; DOI:10.1016/b978-0-08-100355.
(47) Rudzinski, W.; Charmas, R.; Piasecki, W.; Prelot, B.; Thomas, F.; Villiéras, F.; Cases, J.
M. Calorimetric effects of simple ion adsorption at the silica/electrolyte interface: Quantitative analysis of surface energetic heterogeneity. Langmuir 1999, 15 (18), 5977-5983.
(48) Krumbein, W. C.; Graybill, F. A., An introduction to statistical models in geology.
McGraw-Hill: 1965.
(49) Johnston, C., Developments in Clay Science: Infrared Studies of Clay Mineral-water
Interactions. Elsevier: Amsterdam, Netherlands, 2017; DOI:
10.1016/B978-0-08-100355-8.00009-6.
(50) Pelletier, M.; Michot, L.; Barrès, O.; Humbert, B.; Petit, S.; Robert, J.L. Influence of
KBr conditioning on the infrared hydroxyl-stretching region of saponites. Clay Miner.1999,
34 (3), 439-445.
(51) Baronnet, A. Growth mechanisms and polytypism in synthetic hydroxyl-bearing
phlogopite. Am. Mineral. 1972, 57 (7-8), 1272-1293.
(52) Kitagawa, R.; Matsuda, T. Microtopography of regularly interstratified mica and
smectite. Clays Clay Miner. 1992, 40 (1), 114-121.
(53) Inoue, A.; Kitagawa, R. Morphological characteristics of illitic clay minerals from a
hydrothermal system. Am. Mineral. 1994, 79 (7-8), 700-711.
(54) Kitagawa, R. Surface microtopography of (allevardite) from Allevard, rectorite France.
Clay Miner. 1997, 32 (1), 89-95.
(55) Jige, M.; Kitagawa, R.; Zaykov, V. V.; Sinyakovskaya, I. Surface microtopography of
sudoite. Clay Miner. 2003, 38 (3), 375-382.
(56) García-Romero, E.; Suárez, M. A structure-based argument for non-classical crystal
growth in natural clay minerals. Mineral. Mag. 2018, 82 (1), 171-180.
(57) Meunier, A. Why are clay minerals small? Clay Miner. 2006, 41 (2), 551-566.
(58) Drits, V.; Salyn, A.; Šucha, V. Structural transformations of interstratified
illite-smectites from Dolna Ves hydrothermal deposits: dynamics and mechanisms. Clays Clay
(59) Putnis, A. Mineral replacement reactions. Rev. Mineral. Geochem. 2009, 70 (1), 87-124. (60) Konak, A. R. A new model for surface reaction-controlled growth of crystals from
solution. Chem. Eng. Sci. 1974, 29 (7), 1537-1543
(61) Lifshitz, I. M.; Slyozov, V. V. The kinetics of precipitation from supersaturated solid
solutions. J. Phys. Chem. Solids 1961, 19 (1-2), 35-50.
(62) Wagner, C. Theorie der alterung von niederschlägen durch umlösen (Ostwald-reifung).
Ber. Bunsenges. Phys. Chem. 1961, 65 (7-8), 581-591.
(63) De Yoreo, J. J.; Gilbert, P. U. P. A.; Sommerdijk, N. A. J. M.; Penn, R. L.; Whitelam, S.;
Joester, D.; Zhang, H. Z.; Rimer, J. D.; Navrotsky, A.; Banfield, J. F.; Wallace, A. F.; Michel, F. M.; Meldrum, F. C.; Colfen, H.; Dove, P. M. Crystallization by particle attachment in synthetic, biogenic, and geologic environments. Science 2015, 349 (6247), aaa6760.
(64) Cölfen, H.; Mann, S. Higher-order organization by mesoscale self ‐ assembly and
transformation of hybrid nanostructures. Angew. Chem. Int. Ed. 2003, 42 (21), 2350-2365.
(65) Liu, X. Y. Heterogeneous nucleation or homogeneous nucleation? J. Chem. Phys. 2000,
FIGURES & FIGURE CAPTIONS
Figure 1. Powder XRD patterns of synthesized saponite precursors, a: Mg-saponite precursor
Figure 2. Structural OH stretching vibration region of the MIR spectra of synthetic saponite
Figure 3. XRD patterns of oriented preparation of synthetic samples, black solid line: air-dry
Figure 4. Schematic diagram of structural OH environments in a trioctahedral sheet containing
Figure 6. Derivative isothermals (a) of low-pressure argon adsorption at 77 K of synthetic
samples, b: their decomposition by the derivative isotherm summation (DIS) method. The BET formalism was used to characterize the “local” theoretical adsorption isotherms corresponding to homogeneous domains of the surface. The fitting procedure allows to obtain 2 or 3 peaks for edge or basal surface, and the fitting parameters are presented in Table S1.
Figure 7. Total surface area (TSA), basal surface area (BSA) and edge surface area (ESA)
(m2/g) of synthetic samples vs. hydrothermal treatment times (a). The particles size (range of measurement error: 8%) in height (circle) and diameter (square) of synthesized saponites vs. hydrothermal treatment times (b).
Figure 8. STEM images of synthesized samples, a: 0d, b: 0.75d, c:
Figure 9. Crystal Size Distribution (CSD) of saponite crystal length and width from
Figure 10. Decomposition of the MIR spectra in the vOH region, gel-220-14d (a) and
Figure 11. The trend relationships between the diameter and R(IR) (see text) of synthesized samples.
Figure 12. Simple diagram of variations in α- β2 of samples (150-220-14d (black symbols) and 150-220-30d (red symbols)), plotted on the diagram of Eberl et al. (1998)36. Length is denoted by square and width is denoted by triangle.
TABLE
Table 1. Mean values of length and width of the saponite crystals from STEM and the mean
crystal diameter of saponite from argon adsorption. α and β2 are the mean and variance of the natural logarithms of the observations, respectively.
Sample
Mean crystal size
(TEM) α β
2 Mean particle size (Argon
adsorption) Length
(nm)
Width
(nm) Length Width Length Width Diameter (nm)
150-220-14d 47.60 30.95 3.66 3.28 0.399 0.299 49.29±3.94
Table 2. The ratio (R) of mixed OH of saponite samples, R(IR) from experimental MIR spectra and R(theory) from the theoretically total random distribution of Mg and Ni.
Series Gel-220 150-220
Times (days) 14 0 0.25 0.5 0.75 1 3 14 30
R(IR) 62% 20% 26% 31% 30% 36% 45% 48% 55%
R(theory) 75%
Note: the same number of Mg and Ni randomly distribute in three vacancies around structural-OH, the corresponding ratio are 12.5% for Mg3structural-OH, 37.5% for Mg2Nistructural-OH, 37.5% for Ni2MgOH and 12.5% for Ni3OH. R(theory): 37.5%+37.5%=75%.