Coupled Natural Gas and Electric Power Systems
by
Tommy Leung
B.S. Engineering, Harvey Mudd College (2005) S.M., Massachusetts Institute of Technology (2012)
Submitted to the Engineering Systems Division in partial fulfillment of the requirements for the degree of
DOCTOR OF PHILOSOPHY at the
MASSACHUSETTS INSTITUTE OF TECHNOLOGY June 2015
c
⃝ Massachusetts Institute of Technology 2015. All rights reserved.
Author . . . . Engineering Systems Division
May 1, 2015
Certified by . . . . Joseph Sussman Committee Chair Professor of Civil Engineering and Engineering Systems
Certified by . . . . Ignacio J. Pérez Arriaga Thesis Supervisor Visiting Professor of Engineering Systems
Certified by . . . . Ernest J. Moniz Cecil and Ida Green Professor of Physics and Engineering Systems
Certified by . . . . Mort Webster Associate Professor of Engineering Systems
Accepted by . . . . Munther Dahleh William A. Coolidge Professor of Electrical Engineering and Computer Science Acting Director, Engineering Systems Division
Coupled Natural Gas and Electric Power Systems
by
Tommy Leung
Submitted to the Engineering Systems Division on May 1, 2015, in partial fulfillment of the
requirements for the degree of DOCTOR OF PHILOSOPHY
Abstract
Scarce pipeline capacity in regions that rely on natural gas technologies for electricity generation has created volatile prices and reliability concerns. Gas-fired generation firms uniquely operate as large consumers in the gas market and large producers in the electricity market. To explore the effects of this coupling, this dissertation investigates decisions for firms that own gas-fired power plants by proposing a mixed-integer linear programming model that explicitly represents multi-year pipeline capacity commit-ments and service agreecommit-ments, annual forward capacity offers, annual maintenance schedules, and daily fuel purchases and electricity generation. This dissertation’s primary contributions consist of a detailed representation of a gas-fired power-plant owner’s planning problem; a hierarchical application of a state-based dimensionality reduction technique to solve the hourly unit commitment problem over different tem-poral scales; a technique to evaluate a firm’s forward capacity market offer, including a probabilistic approach to evaluate the risk of forced outages; a case study of New England’s gas-electricity system; and an exploration of the applicability of forward capacity markets to reliability problems for other basic goods.
Joseph Sussman Committee Chair
Professor of Civil Engineering and Engineering Systems
Ignacio J. Pérez Arriaga Thesis Supervisor
Visiting Professor of Engineering Systems
Ernest J. Moniz
Cecil and Ida Green Professor of Physics and Engineering Systems
Mort Webster
Acknowledgments
To everyone that has lent me an ear and indulged me by listening to my stories, I thank you for your time, support, advice, and companionship. With much gratitude, I assure you that it has truly been an unequal exchange to my benefit.
To my committee members:
Ignacio, thank you for introducing me to the world of electric power systems and regulation, especially even after you realized at our first meeting that I had no idea what the phrase “marginal cost of electricity” meant! Who would have guessed after that meeting that I would spend three of the next five years as your teaching assistant and then continue onward to finish an entire dissertation on power systems?
Joe, thank you for your genuine interest in my research, your thoughtful questions, and your careful stewardship of my doctoral program. I am deeply grateful for your close attention and presence on my committee, and I will always remember that steak is easier to eat than lobster when writing.
Mort, thank you for your courses in dynamic programming and power system opti-mization modeling; they were a helpful start into the world of mathematical model-ing.
Ernie, thank you for the opportunity to contribute to The Future of Natural Gas Study five years ago—the start of everything that led to this dissertation!
This research was funded by the NSF, the MITEI Energy Initiative, and the Comillas-MIT-Electricity Systems (COMITES) parternship.
Contents
1 Introduction 17
1.1 History and context . . . 21
1.1.1 A brief introduction to electric power systems . . . 21
1.1.2 A brief introduction to the natural gas system . . . 26
1.2 Contemporary challenges for decision makers . . . 34
1.2.1 Key decision makers . . . 34
1.2.2 Common concerns . . . 36
1.2.3 The need for new decision support models . . . 37
1.3 Research statement . . . 44
1.3.1 Strategic decisions . . . 44
1.3.2 Dimensionality challenges . . . 50
1.3.3 Next steps . . . 51
2 Combined Gas-Electricity Planning & Operation Model 55 2.1 General economic assumptions . . . 56
2.1.1 Welfare-maximization and cost-minimization . . . 57
2.1.2 Perfect competition . . . 57
2.2 Full hourly model description . . . 60
2.2.1 Unit commitment with gas transportation . . . 64
2.2.2 Long-term service agreement selection . . . 67
2.2.3 Maintenance scheduling . . . 68
2.2.5 Considerations for uncertainty . . . 74
2.3 Dimensionality reduction . . . 76
2.3.1 System state representation . . . 80
2.3.2 System state implementation . . . 84
2.4 Summary and next steps . . . 93
3 Case study 95 3.1 Input data . . . 96
3.2 Benchmarks . . . 99
3.2.1 System state versus hourly unit commitment . . . 100
3.2.2 Isolated decisions . . . 104
3.2.3 Simultaneous decisions . . . 114
3.3 Hypothetical explorations . . . 123
3.3.1 Full-sized power system . . . 123
3.3.2 Explorations under uncertainty . . . 135
3.4 Conclusions . . . 146
4 General lessons 149 4.1 A description of electricity . . . 151
4.1.1 Defining features . . . 152
4.1.2 Commodity versus basic good . . . 153
4.2 Lessons from New England . . . 155
4.2.1 New England’s original forward capacity market . . . 157
4.2.2 New England’s new forward capacity market . . . 158
4.2.3 Winter reliability program . . . 160
4.3 The role of indicative and mandatory planning . . . 162
4.4 Forward capacity markets for basic goods . . . 165
4.4.1 Forward capacity markets for pharmaceuticals . . . 167
4.4.2 Forward capacity markets for water . . . 168
5 Conclusions 171 5.1 Contributions . . . 172 5.2 Findings . . . 173 5.3 Limitations and future work . . . 176
A Gas-electricity price dynamics 181
List of Figures
1-1 Electric power grid diagram1 . . . 21
1-2 Independent system operators in the United States . . . 23
1-3 Natural gas geology . . . 27
1-4 Map of natural gas basin and transportation corridors in the United States, 2008 . . . 28
1-5 Map of natural gas market centers in the United States, 2009 . . . 32
1-6 Gas and electricity market timing, New England, 2013 . . . 37
1-7 Stylized representation of different maintenance interval functions for long-term service agreements . . . 47
2-1 Block diagram of feedback between long-, medium- and short-term decisions . . . 79
2-2 Stylized unit commitment results . . . 81
2-3 Identifying system states using k-means clustering . . . . 82
2-4 Each hour is assigned to the most similar cluster . . . 83
2-5 Tracking hourly trends and dynamics . . . 84
3-1 New England gas and electricity price correlation . . . 96
3-2 2013 New England Annual Electricity Demand . . . 98
3-3 New England Electricity Demand, April 11-18, 2013 . . . 98
3-4 New England Electricity Demand, July 15 to July 22, 2013 . . . 98
3-5 2013 Algonquin Gas Prices (based on EIA data) . . . 99
3-6 System state approximation of electricity demand . . . 101 3-7 One-month dispatch: (top) system state; (bottom) hourly formulation 102
3-8 Isolated long-term pipeline firm transportation decision . . . 106
3-9 Estimation of firm 2’s daily short-term gas purchases for 2013 . . . . 108
3-10 Isolated long-term service agreement decision . . . 110
3-11 Estimated available gas-fired power plant capacity based on aggregate scheduled outages (long-term approximation) . . . 111
3-12 Estimated available gas-fired power plant capacity based on aggregate scheduled outages (medium-term solution) . . . 112
3-13 Forward capacity commitment for different long-term pipeline trans-portation prices . . . 114
3-14 Long-term gas purchase, all decisions enabled: (top) no transportation cost; (middle) pipeline scarcity; (bottom) gas uncertainty . . . 116
3-15 LTSA, all decisions enabled: (top) no transportation cost; (middle) pipeline scarcity; (bottom) gas uncertainty . . . 118
3-16 Maintenance schedule, all decisions enabled: (top) no transportation cost; (middle) pipeline scarcity; (bottom) gas uncertainty . . . 120
3-17 Forward capacity, all decisions enabled: (top) no transportation cost; (middle) pipeline scarcity; (bottom) gas uncertainty . . . 122
3-18 Long-term gas purchase, full power system . . . 124
3-19 Estimated annual fuel purchases, full power system . . . 127
3-20 LTSA selection, full power system . . . 129
3-21 Maintenance schedule, Firm 2 . . . 130
3-22 Maintenance schedule, Firm 3 . . . 131
3-23 Weekly energy output, long-term pipeline transportation price: $1/MMBtu132 3-24 Weekly energy output, long-term pipeline transportation price: $100/MMBtu132 3-25 Annual forward capacity commitments . . . 133
3-26 Annual forward capacity profits . . . 134
3-27 Annual energy profits . . . 135
3-28 Forward capacity obligation risk . . . 141
3-29 CDF of marginal electricity prices . . . 143
List of Tables
3.1 Summary of dispatchable ISO-NE power plants, 2013 . . . 97 3.2 System state versus hourly unit commitment results . . . 104 3.3 System state versus hourly unit commitment computation details . . 104 3.4 Power plant data subset for exploring isolated decisions . . . 105 3.5 LTSA/long-term pipeline transportation operations and costs
compar-ison for a representative power plant . . . 129 3.6 Gas and electricity uncertainty scenarios . . . 136 3.7 Firm 2’s forward capacity market bid information ($10/MMBtu/day
Chapter 1
Introduction
Natural gas-fired power plants accounted for 18% of New England’s total power plant capacity in the year 2000. Fifteen years later, due to a confluence of environmental and economic factors, natural gas has displaced much of the remaining coal and oil capacity in the region and now accounts for 50% of New England’s total power plant capacity and over 40% of its total electricity generation. As the electric power sec-tor increasingly depends on natural gas as a primary fuel, and as the electric power sector becomes the gas sector’s largest consumer, public agencies such as the Inde-pendent System Operator of New England (ISO-NE), the New York IndeInde-pendent System Operator, and the Federal Energy Regulatory Commission (FERC) and pri-vate consortiums such as the Edison Electric Institute and the Interstate Natural Gas Association of America have expressed concerns about the increasing regularity of pipeline capacity scarcities and the long-term implications of reduced fuel diversity for electric power system reliability. [FERC, 2012][ISO-New England, 2013a]
Although the United States’ northeast region is the first in the country to experi-ence emerging problems due to the interdependencies between its gas and electricity systems, its shift toward natural gas technologies is not unique. The United States’ electric power sector in aggregate now burns so much natural gas that it has displaced both industrial and residential sectors as the country’s top consumer. [EIA, 2013] The strong adoption of natural gas technologies is not surprising given the niche role that natural gas-fired power plants fulfill. Compared to their coal counterparts, gas-fired
power plants emit fewer greenhouse gasses. In many parts of the United States and other parts of the world with shale gas reserves and sufficient gas transportation infrastructure, the commodity price of natural gas economically outcompetes coal. And compared to both coal and nuclear power plants, gas-fired power plants provide short-term operational flexibility1 that allows power systems to integrate more
inter-mittent and variable technologies such as renewable wind turbines and photovoltaic solar cells. The environmental and operational advantages of gas-fired power plants have led power systems not only in the United States, but also around the world, to adopt increasingly larger fractions of natural gas technologies into their capacity mix. For example, at the end of 2013, the Spanish power system had 102,395 MW of total installed capacity for electric power generation consisting of 22.3% wind turbines and 24.8% combined-cycle gas turbines (CCGTs)2. Despite the similar installed
ca-pacities of both technologies, in 2013, wind turbines covered 21.2% of Spain’s electric-ity demand, while CCGTs only covered 9.5%. [Eléctrica, 2014] Given Spain’s relative isolation as a power system from other countries (with exception to its connection to Portugal, whose power system is about one-fifth the size of Spain’s with a similar ca-pacity mix), the system operator only considers 5% of its total installed wind caca-pacity as “firm,”3 and the system operator relies on the ramping and cycling capabilities of
gas-fired power plants and storage from pumped hydro turbines to mitigate short-term imbalances between electricity supply and demand. Although the load factor4 1Gas-fired power plants can physically start up, shut down, and change their power output levels
faster than any other thermal technology. These “cycling” and “ramping” advantages allow gas-fired power plants to follow unexpected dips and rises in demand and generation, which in turn helps power systems maintain the physical supply and demand balance required at all time instances to prevent power failures such as blackouts and brownouts.
2CCGTs are a specific type of gas-fired power plant that combines an open-cycle combustion
turbine with a steam turbine. The combustion turbine resembles the turbine design of a jet engine (at least to a first approximation) and can turn on and off quickly. The excess heat given off by the combustion process then heats water until it turns to steam, and this steam powers a separate turbine. Modern CCGTs can have energy conversion efficiencies exceeding 60%.
3Firm capacity refers to the amount of capacity that can be considered always available; because
wind turbines can only produce electricity when there is wind, wind turbines (and other renewable technologies) tend to have lower firm capacities as a fraction of their total installed capacities relative to thermal plants.
4The load factor of a power plant represents how much energy a plant generated as a fraction
of the total energy that it could have generated were it operating at full load for the entire time period. Technologies with high capital expenses frequently require high load factors to recover their
for Spain’s CCGT fleet is low, Spain’s CCGT power plants, in combination with its pumped hydro resources, are critical to ensuring the reliability of the Spanish power system due its large share of wind generation and lack of import/export capacity with other countries. [MITEI, 2011a]
However, Spain’s success with wind and gas is not without its own problems: Spain, Germany, and other power systems with a large penetration of renewables have experienced financial difficulties maintaining their gas-fired generation power plants due to low load factors and marginal pricing pressures from renewables. [Economist, 2013] These international experiences and emergent reliability concerns in New England suggest that as power systems around the world increasingly depend on gas-fired generation for a variety of environmental, economic, and safety reasons, the status quo of natural gas as a reliably available fuel and gas-fired power plants as a reliably available technology may no longer hold.
The electric power sector’s current level of demand for natural gas has already led to greater fuel uncertainty and cost due to physical transportation constraints and geopolitical concerns around the world. In the United States, natural gas is plentiful due to advances with hydraulic fracturing, but pipeline capacity is not always avail-able. The difficulty that generation firms face projecting their gas consumption up to twenty years into the future compared to other types of large natural gas consumers has reduced long-term commitments to purchase gas and depressed investment sig-nals for new pipeline capacity. [MITEI, 2013] New England currently experiences high electricity prices as a direct result of its extreme reliance on natural gas and the region’s constrained pipeline capacity; for a detailed case study of the market dynamics in New England, see Appendix A. In European countries, the geopolitics surrounding natural gas supply can artificially and unexpectedly limit fuel availabil-ity. And in countries such as Japan with few natural gas reserves, limited pipeline infrastructure, and few alternative generation technologies due to safety concerns, additional reliance on natural gas can be exceptionally expensive. [Economist, 2014]
fixed costs; for example, nuclear power plants generally need to operate at load factors in the high 90th percentile to remain economically viable. [Nuttall, 2011]
Each of these situations highlights potentially problematic physical, economic, and social interactions between gas and electricity systems that can materially impact one or both energy system’s reliability.
This dissertation seeks to contribute new knowledge about the emerging interde-pendencies between coupled gas and electric power systems by examining the optimal behavior of a central group of agents in both systems: generation firms that own gas-fired power plants. Unlike other important agents such as monopolistic local distribu-tion companies who deliver gas to captive consumers at regulated rates, or industrial users who consume natural gas as a raw input for manufacturing and have relatively predictable and inelastic demand, generation firms with gas-fired assets operate with a unique set of uncertainties as simultaneous consumers in gas markets and producers in electricity markets. Given the physical and financial coupling between gas and elec-tricity systems, understanding how firms that own gas-fired generation plants should operate under uncertainty from electricity demand, renewable generation, and gas transportation availability over a range of timescales can provide insights about po-tential changes to operations, regulations, or policies in one or both energy systems that may improve reliability and economic efficiency.
To explore the optimal behavior of firms that own gas-fired generation plants, this dissertation develops a mixed-integer linear programming (MILP) model of a generation firm’s post-investment operations decisions over a timescale ranging from the next day to the next three years. This dissertation also demonstrates a temporal framework based on a state-based dimensionality reduction technique to separate the unified MILP problem, which is currently computationally intractable, into a series of smaller subproblems that can be individually solved and then reintegrated. The re-sulting decisions approximate solving the unified MILP problem simultaneously such that relevant short-timescale effects can be considered in long-timescale decisions, and long-timescale decisions condition the feasible set of future short timescale decisions. The remainder of Chapter 1 provides an overview of gas and electric power systems and outlines the key problems that this dissertation examines. Chapter 2 describes the mathematical models developed to analyze interconnected gas-and-electricity
sys-tems; Chapter 3 applies the models to a real-sized case study power system inspired by New England; Chapter 4 explores the application of forward capacity markets to other basic goods; and Chapter 5 concludes.
1.1
History and context
The next two sections, 1.1.1 and 1.1.2, provide primers for readers that are new to gas and electricity systems. Readers that have familiarity with these topics can skip directly to section 1.2, which describes present day challenges for key decision makers.
1.1.1
A brief introduction to electric power systems
The physical network
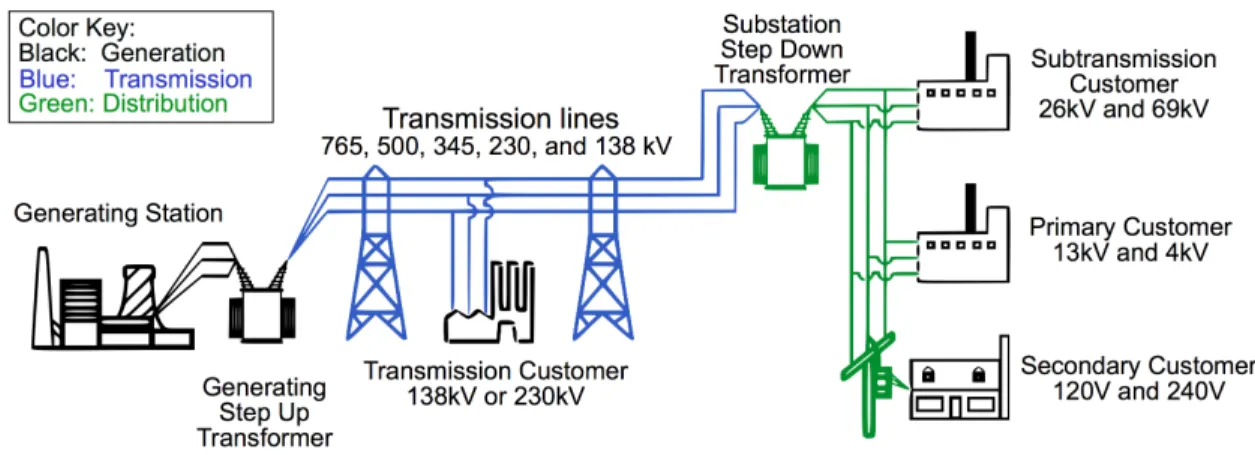
The primary function of electric power systems is to reliably deliver electricity from generators to consumers. Physically, an electric power network consists of a high volt-age transmission network and several medium and low voltvolt-age distribution networks. High-voltage transmission wires connect generators (such as coal or natural-gas fired power plants) to each other, to large consumers, and to substations. Substations transform high voltage electricity to lower voltages and then distribute the electric-ity to small business and residential consumers. Figure 1-1 illustrates the physical connections between each of the elements in a power system.
At high voltage, the transmission grid ties together the activities of all genera-tors, forming one monolithic machine that rotates at 60 Hz in the United States (50 Hz in other parts of the world), spans thousands of miles, and constantly converts mechanical energy into electrical energy. The physical operation of this machinery resembles an intricate, synchronous dance between giants—because we currently can-not economically store vast amounts of electricity in the same manner that we can store other commodities such as oil, electric power systems must balance uncertain demand and supply at every time instant. If there is too little demand, unconsumed energy stored in the electromagnetic field of transmission wires causes every turbine that is connected to the grid to rotate faster. The reverse is also true: if there is too much demand and not enough electrical energy, the demand acts as a force against the motion of every connected turbine. This physical coupling is one of the reasons that electric power systems serve as an excellent example of a complex sociotechnical system. In developed countries, societies view electricity as a right and continue to demand (by way of laws and public opinions) not only reliable electricity, but also environmentally friendly and “safe” electricity despite the additional uncertainties and operating difficulties that technologies with these attributes can introduce into the daily operation of power systems.
Wholesale electricity markets
Before the 1990s, most consumers purchased electricity from vertically integrated util-ities that controlled all aspects of the electricity business. These monolithic utilutil-ities operated as local monopolies over a particular geographic region and made decisions ranging from long-term, multi-decade generation and transmission investments to short-term, hourly plant operations. Government regulators monitored the prices that companies could charge and the total revenues that they could earn, and com-panies passed along all regulator-approved costs to their customers.
In the 1990s, a few governments in South America, Europe, and the United States
5Media source:
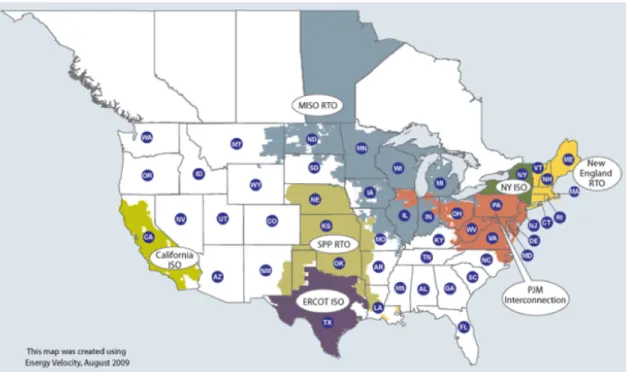
started to shift their electric power systems away from the vertically integrated busi-ness model and introduced wholesale electricity markets. In power systems that underwent market liberalization, governments created new system and market opera-tors tasked with the responsibility of coordinating the activities of individual firms on the transmission network and clearing wholesale markets. During this liberalization process, electricity transmission and distribution networks remained regulated mo-nopolies due to their inherent economies of scale. Advocates for wholesale electricity markets hoped that these reforms would enable competition between power genera-tion firms, allow market forces to pick winners and losers, and promote greater price transparency. Despite these claimed benefits, planning and operating a reliable power system via wholesale electricity markets has not always proven successful, and many power systems continue to operate with a vertically integrated structure. The map in Figure 1-26 highlights regions in the United States that currently operate power systems with wholesale electricity markets.
Figure 1-2: Independent system operators in the United States
Each of the independent system operators (ISOs) shown in Figure 1-2 coordinates
system and market activities between the generators and large-scale consumers that reside within its geographic region. Large-scale consumers include businesses that directly connect to the transmission network, as well as utilities that buy electricity to sell to end-use residential and small business consumers. Each ISO runs auctions for the electricity commodities/products that it needs. For example, energy (electricity provided to the customer and measured in megawatt-hours) is one such product. Ramp up and ramp down capabilities (measured in megawatts/minute), which allow a system operator to meet variations in demand on the timescale of a few minutes to an hour, are another such product. To participate in these auctions, generators must submit bids consisting of quantity and price pairs that they are willing to sell each electricity product for, as well as other variable and fixed cost information, such as the cost of operations and maintenance for operating a plant, the cost of starting a plant, and the cost of shutting down a plant. After collecting all supply offers and demand bids for each hour of the next day, the ISO ranks plants based on price and physical network feasibility and then awards bids starting with the least expensive plant. The last bid that the ISO accepts sets the marginal system price that all generators receive for their electricity product, and generators with bids that exceed the highest price receive no money in this particular round of bidding. Consequently, the marginal system price for an electricity commodity also serves as an investment signal about the potential value of investing in new technologies and capacities that can provide that commodity. This feedback loop between consumers and generators, ideally, results in an economically efficient (welfare-maximizing) procurement of all of the electricity commodities that the system operator defines.
As with other markets, electricity markets operate on the economic principle that perfect competition should produce efficient outcomes. With proper incentives and information about electricity prices, load trends, generation technologies, and other pertinent aspects of the power system, power generation firms should be able to com-pete with each other by making prudent investment and operation decisions that maximize not only their own individual profits, but also the overall welfare of the power system. However, in reality, many market failures exist that can skew these
outcomes. For example, as most power systems only have a few generation com-panies, the oligopolistic nature of this group may allow price fixing, even if every company “competes” to sell electricity. Electricity price caps set by system operators provide another example of a potential market failure. Although price caps pre-vent consumers from paying high prices, they also prepre-vent investors from receiving correct marginal pricing information and accurately assessing potential investment opportunities. Because of these types of market failures, over the last two decades in power systems, “liberalization” and “deregulation” efforts to shift away from ver-tically integrated business models have actually led to a need for more and better regulation—not less.
Regulatory challenges
During the market liberalization process that took place in the late 1990s and early 2000s, governments implicitly delegated the long- and short-term responsibility of supplying electricity collectively to individual firms (agents) operating in their own best interests under market rules. Regulators suddenly faced a new set of questions. For example, in a properly functioning, welfare-maximizing market, what electric-ity commodities should agents trade? What is the hypothetical market optimum, and what are the corresponding “correct” individual investment and operation de-cisions? How should decision makers address market power concerns and market failures that might create deviations from the hypothetical optimum? When decision makers introduced wholesale electricity markets in an attempt to improve technology adoption, innovation, competition, transparency, and efficiency, they made electric power systems wholly dependent on the rational behavior of individual firms to guar-antee reliable and secure electricity supplies and introduced an entirely new set of regulatory questions; for a comprehensive review of regulation for the electric power sector, see [Pérez-Arriaga, 2013].
Just as liberalization introduced a new set of questions for the electric power sector, the recent discovery of abundant natural gas supplies and increasing world-wide dependence on natural gas and renewable technologies, for reasons that are not
necessarily easy to capture with markets, are creating a new set of challenges for the operation and regulation of electric power systems. For example, how should individual firms manage operational uncertainty? Should market operators modify their rules to allow firms to express uncertainty—and if so, how? How should policy makers design technology-neutral laws and incentives to promote reliability? How should regulators measure and mitigate the substantial market power that gas-fired power plants have in systems that rely heavily on gas-fired generation and have lim-ited pipeline capacity? These types of questions represent the emerging regulatory, reliability, and investment concerns that public and private stakeholders in gas and electric power systems will increasingly have to tackle as coupled gas and electric power systems continue to evolve.
1.1.2
A brief introduction to the natural gas system
Physical natural gas network
Much like electricity networks, the primary function of gas networks is to transport natural gas—primarily methane—from production sites to end consumers. Produc-tion firms use a variety of techniques to extract gas from the ground, but the process broadly entails drilling into the ground to expose a deposit of gas and then installing a wellhead to capture and control the newly released gas. Traditional deposits ap-pear as large “bubbles” of methane surrounded by earth that can be reached by drilling vertically into the ground. Recently, however, horizontal drilling techniques and hydraulic fracturing (colloquially, “fracking”) have enabled substantial recovery of “unconventional” natural gas from shale rock formations that trap many small pockets of methane in the ground; see Figure 1-37 for an illustration of the different types of gas deposits. For a detailed review of natural gas supply and production, see [MITEI, 2011b].
Figure 1-3: Natural gas geology
Natural gas can be stored in pipelines by compression (the amount of gas stored in a pipeline at any given time is known as “linepack”), and natural gas moves through pipelines based on pressure differences between two points. Compressor stations distributed throughout the network can repressurize pipelines as necessary, and the reliable operation of pipelines requires a minimum threshold pressure throughout the system. Notably, as a distinction from power systems, natural gas systems can manage moderate demand and supply imbalances at short timescales on the order of a few hours because pipelines inherently store natural gas. Figure 1-48 illustrates the
major gas production sites and transportation corridors (composed of one or more pipelines) for natural gas in the United States.
8Source: http://www.eia.gov/pub/oil_gas/natural_gas/
Figure 1-4: Map of natural gas basin and transportation corridors in the United States, 2008
Like electricity transmission networks, gas pipelines have finite capacity. How-ever, securing rights to use pipeline capacity differs substantially from allocating scarce transmission capacity for power systems in the United States. Whereas each independent system operator in a power system considers physical constraints when clearing its markets and making scheduling/dispatch decisions, the gas system does not have an equivalent centralized system operator. Gas “shippers”—a term that de-scribes any firm that needs to ship or receive gas—must acquire capacity rights along the entire transport path from the point of injection to the point of withdrawal, and most gas transactions occur as bilateral arrangements between independent firms. Large consumers, such as industrial users and power generation companies, can di-rectly connect to high-pressure pipelines and make their own shipping arrangements. Small businesses and residential consumers, as in the electric power system, typi-cally receive their gas through an intermediate utility company that secures supplies of natural gas on their behalf. Pipeline operators ensure that nominations9 to use
pipeline capacity are physically feasible and make adjustments as necessary based on who owns and has priority to pipeline capacity, but they do not operate or clear
9This is an industry term of art that refers to the physical flow schedule that a shipper proposes
centralized markets in the same manner that ISOs do for electricity.
The differences between the centralized nature of electricity markets and the bi-lateral nature of gas markets in the United States has its roots in the natural gas sector’s regulatory evolution.
Regulatory history
The history of the United States’ natural gas sector and its regulation provides a useful context for understanding how the natural gas system works and the broad challenges that coupled gas-electricity systems face, as well as for identifying key de-cision makers. The existing literature on natural gas regulation in the United States includes comprehensive papers by authors such as [Juris, 1998], who describes the current state of gas trading in the United States; [Makholm, 2006], who examines the changing environment for pipeline investments and long-term contracts from the early 1900s onward, paying special attention to the asset specificities of the busi-ness that made pipeline investments a unique challenge for the gas industry; and [Petrash, 2005], who analyzes the decline of long-term capacity contracts and the growing preference for short term commitments after the start of deregulation and liberalization in the 1980s.
Regulation of the natural gas industry in the United States has dramatically changed since the 1930s, when the industry was vertically integrated, to today’s competitive trading markets and regulated pipeline monopolies. Before the early 1900s, the gas industry operated as a collection of vertically integrated utilities. As noted by both [Makholm, 2006] and [Petrash, 2005], vertical integration made sense absent further regulation because this organization structure eliminated the financial risk that producers and pipeline operators faced due to the asset-specificity of their gas fields and pipelines. Because of the limited number of consumers at the end of a pipeline, downstream consumers could “hold up” the upstream agents and put them at financial risk once these agents constructed a pipeline and started producing gas. To mitigate the risk of “hold up” in the earliest days of the natural gas industry, companies vertically integrated the production, transportation, and distribution functions of
their business.
The discovery of large deposits of gas in the early 1900s led both oil companies and natural gas utilities to begin building long, interstate pipelines that could transport gas to local markets across the country. After Congress passed the Natural Gas Act (NGA) in 1938 to regulate interstate pipelines, long-term bilateral sales contracts emerged as a viable business structure. These bilateral contracts between pipeline operators and producers, and between pipeline operators and distributors, specified “bundled” sales of both gas commodity and transport capacity. Section 7 of the NGA facilitated the development of these long-term contracts by granting the federal regulator the authority to approve new pipeline construction projects if operators could demonstrate long-term demand for new capacity. At the time, the Federal Power Commission (FPC) required proof of long-term demand for capacity from both producers and consumers, leading producers and distribution companies to sign long-term purchase and sales contracts with pipeline operators. The time duration of these long-term supply contracts—typically twenty years—mitigated the financial risks of “hold-up” and became the dominant financing model for the gas industry until liberalization efforts began in the late 1970s. [Petrash, 2005]
Initially, the NGA only regulated the price of bundled sales between pipeline op-erators and distributors. In the 1950s, however, after concerns about the market power of producers, the FPC gained additional authority to also regulate the well-head prices that producers could charge for their gas, and pipeline operators became merchants with regulated prices at both ends of their pipelines. From the 1950s to the 1970s, perpetually low wellhead prices created a difficult cost recovery environment for producers, resulting in gas shortages in the early 1970s. [Petrash, 2005] Although different agents operated the production, transportation, and distribution segments of the natural gas industry from the 1930s to 1978, the industry was “de facto vertically integrated” because of the nature and duration of the long-term bilateral contracts, as well as the regulated prices that agents were allowed to transact at. [Juris, 1998]
In 1978, to address both lagging wellhead prices and gas shortages, Congress passed the Natural Gas Policy Act and gave the Federal Energy Regulatory
Commis-sion (FERC; the successor to the FPC) the authority to regulate both interstate and intrastate gas prices. FERC began liberalization efforts to introduce more competi-tion into the natural gas industry. To date, the most important rules include FERC Orders 436, 500, and 636. FERC Order 436 opened access to interstate pipelines, al-lowing pipeline companies to unbundle gas commodity from transportation sales and allowing consumers and producers to directly buy and sell from each other while pay-ing the pipeline operator a regulated fee for access. FERC Order 500 allowed pipeline operators that unbundled to collect tariffs that would offset long-term purchase con-tracts that they had previously signed with producers. FERC Order 636 required pipeline operators to become a “pipelines-only” company by releasing all companies that had previously signed long-term agreements with pipeline operators from their contractual obligations, forcing pipeline operators to divest all of their existing supply contracts, and setting up pipeline operators as regulated monopolies that would earn a fixed rate of return based on transportation volumes. The combination of FERC Orders 436, 500, and 636 created the modern gas system in the United States, which operates with many functional parallels to the electric power system sans a central coordinating agent. [Petrash, 2005]
Current natural gas market in the United States
Today, natural gas trading in the United States resembles to a first approximation the idealized economic description of a commodity: each unit is homogenous, and the cost of natural gas reflects the commodity cost plus the cost of transportation. Pipeline operators hold the responsibility of making investments in new pipeline infrastruc-ture subject to FERC approval, and these operators auction off capacity rights of varying time durations and guarantees of availability to shippers (a collective term that encompasses both producers and consumers). The price of natural gas at Henry Hub, a physical location in the United States where many pipelines meet (see Figure 1-5 for a map of some of the natural gas market centers in the United States10), is
10Source: http://www.eia.gov/pub/oil_gas/natural_gas/analysis_publications/
generally considered the commodity cost of natural gas because capacity rarely (if ever) is scarce.
Figure 1-5: Map of natural gas market centers in the United States, 2009
The price differential between Henry Hub and other hubs around the country, such as New England’s Algonquin, reflects the transportation cost between these two hubs. The entire country shares a single gas trading day with multiple intraday renomination periods to balance supply and demand.11 However, pipeline capacity transactions
remain predominantly bilateral; due to the lack of a central system operator that coordinates both market and network activities, pipeline capacity may be underused in the United States given the complexity of needing to secure capacity rights at every physical point between the source and the destination. Third party marketers have emerged to remove some of the transactional complexity and inefficiency in matching supply and demand, but they do not occupy a role (nor have any authority) equivalent to the system operator in electric power systems. [Ruff, 2012] To ensure physical feasibility of flows, shippers must seek permission to use pipeline capacity
11The typical gas trading day only featured one or two intraday renomination periods prior to
electricity-gas reliability concerns; today, in the United States, the gas and electricity industries are working together to increase the number of renomination periods.
that they either already own or acquired in a secondary market by submitting daily usage requests—capacity nominations—to pipeline operators.
Differences in the European Union market design
The European natural gas system consists of an entry/exit design where the financial trading of natural gas tends to ignore network and temporal constraints within a trading zone—typically, a nation—and requires balancing at the boundaries of zones. Because the entry/exit design creates a “virtual hub” through which all gas produc-ers ship gas to and all gas consumproduc-ers receive gas from within a trading zone, the market design lacks a realistic representation of the underlying gas network’s pipeline structure. Consequently, costs for network usage within a trading zone tend to be so-cialized across all users because differences between supply and demand are balanced at the boundaries of the trading zone, and costs for gas that flows through multiple zones can result in a “pancake”12 of access fees that do not necessarily reflect
physi-cal pipeline conditions from entry to exit. [Vazquez et al., 2012] Whereas gas costs in the United States tend to directly reflect underlying temporal and geographic pipeline scarcities in the same way that nodal prices in electricity markets reflect transmission constraints, the European design foregoes a physically-true representation in exchange for greater trading liquidity and socialized network access.
The European system promotes liquidity by removing substantial temporal and geographic network constraints within a trading zone so that injections and with-drawals that actually occur at different times and locations appear as if they occurred simultaneously. For example, if a producer injects gas at the beginning of the day in one physical location, and a consumer withdraws gas at a different time on the same day and at another physical location within the same trading zone (e.g., the same country), the European system financially clears this exchange as one simultaneous transaction. Abstracting the financial trading in this manner simplifies the
transac-12“Pancaking” of tariffs refers to the effect of stacking multiple access fees as the flow of a
commod-ity crosses multiple geographic regions. In most cases, because the declaration of geographic regions is arbitrary and not based on physical network constraints, the tariff pancake does not properly allocate costs based on actual imposed costs on the network and benefits.
tion for producers and consumers: a unit of gas traded within one trading period in the same geographic zone has the same cost and value as any other unit of gas, even if in reality the time and location of the injection and withdrawal differ.
However, to accommodate the physical flows for this design, European network operators must necessarily withhold pipeline capacity from the market to flexibly respond to actual daily flows and imbalances that it cannot predict ahead of time. Europe’s entry/exit design promotes pipeline investment within a virtual hub to sup-port the financial abstraction of a universal entry/exit point, but does not necessarily promote cross-border investments. [Vazquez et al., 2012] Investment in European gas pipelines occurs at the suggestion of transmission system operators (TSOs) in con-junction with approval from the national regulatory authority (NRA) in each member state, and all agents in the system pay for the cost of investment via additions to each system’s regulated asset base. [Barquín, 2012]
Despite the vastly different market designs for the European Union and the United States gas system, from the perspective of reliability concerns resulting from increas-ingly coupled gas and electricity systems, both regions share the same broad set of emerging challenges due to their shared physical reliance on natural gas, their shared uncertainty about fuel availability, and the similar roles that gas-fired power plants fulfill for electric power systems in each region.
1.2
Contemporary challenges for decision makers
1.2.1
Key decision makers
In the United States, the evolution of the electricity and natural gas sectors has cre-ated several key decision makers that wield influence over the combined gas-electricity system. This group includes electric power system operators, who clear markets and coordinate individual firm activities to ensure feasible network flows; natural gas pipeline operators who build and maintain pipeline infrastructure; wholesale ship-pers (a term that lumps together commodity producers, large consumers such as
utilities/local distribution companies (LDCs) and electricity generation firms, and third-party marketers that aggregate demand and supply) who trade natural gas com-modity and transportation capacity amongst each other; wholesale electricity agents, such as generation firms and utilities/LDCs who trade electricity amongst each other; regulators such as FERC and state public utilities commissions (PUCs) who monitor both sectors, and policymakers at the state and federal level who craft legislation.
These key decision makers, from individual firms to pipeline operators and regu-lators/policy makers, also exist in similar capacities in the European Union. As of 2009, the European Union and its member states started to implement the “Third Energy Package,” an energy liberalization policy to create a single, unified market across member states for electricity and gas. In addition to creating a large trading region across the European Union, this liberalization policy unbundles gas commod-ity and pipeline ownership and institutionalizes cooperation amongst member state regulators via a mandate for each country to have a single NRA and the creation of the Agency for the Cooperation of Energy Regulators (ACER) to facilitate cooper-ation between NRAs. Two new institutions, the European Network of Transmission System Operators for Gas (ENTSOG) and the European Network of Transmission System Operators for Electricity (ENTSOE), play facilitating roles for each country’s gas and electricity system operators.
Comparing the European Union to the United States, loosely, the European mem-ber states map onto individual states in the United States in terms of the gas system and onto the individual system operators (ISOs) for the electricity system. The NRAs map to PUCs, and ACER maps to FERC. Although the United States lacks formal entities similar to ENTSOE and ENTSOG, adjacent electricity system operators co-operate frequently on an informal basis, and FERC’s Order 1000 gives electric power system operators the beginnings of regional planning authority across electricity sys-tems. In the United States and the European Union, the physical similarities between each region’s gas and electricity systems and the existence of wholesale electricity and gas markets that economically guide the activities of individual firms—despite reg-ulatory organization and market design differences—has created a common set of
reliability and security of supply challenges for all decision makers.
1.2.2
Common concerns
In 2012 and 2013, the New England States Committee on Electricity (NESCOE), an intrastate organization consisting of governor-appointed representatives from each New England state, discussed a variety of policy and market changes to New Eng-land’s gas and electricity system to address the region’s gas-electricity concerns. Their discussions summarize well the concrete challenges that coupled gas and electricity systems currently face. From market timing changes to new policies aimed at improv-ing reliability, NESCOE’s ideas include “movimprov-ing the [electricity] day ahead market forward” to minimize uncertainty between gas and electricity needs (see Figure 1-6 for gas and electricity market timing in New England as of 2013); “allowing generators to reoffer hourly during the intraday period” to accommodate firms have electricity commitments but could not acquire the necessary fuel to meet them; allowing genera-tion firms to “price risk into their offers” as an addigenera-tional cost component in their bids to reflect the uncertainty of fuel availability; and creating “new ancillary services mar-kets such as ones for longer term reserve products.” NESCOE also discussed several capacity payment and regulatory alternatives to encourage fuel diversity and guar-antee fuel availability, including “paying certain dual fuel capable units to hold/burn oil and maintain oil-burning capabilities;” “implementing rule changes that encour-age better unit availability;” “paying supplemental capacity payments for generators that commit to firm gas supply;” “increasing payments to existing oil fired generators so that they don’t retire;” “enhancing availability incentives to encourage gas-fired generators to contract for long-term pipeline capacity and/or storage;” “instituting rules that all gas fired generators must contract for long-term firm pipeline capacity;” “changing ISO-NE tariffs so that gas pipeline investment for generation purposes is socialized to all load;” and “establishing electricity reliability standards that would force generators to contract for new pipeline capacity.” [Hunt et al., 2014] NESCOE’s discussions and recommendations reveal that for stakeholders on the electricity side, the reduction of fuel diversity in the capacity mix combined with greater long- and
short-term uncertainty about natural gas availability pose the greatest challenges for coupled gas-electricity systems.
10AM, Day Before 10AM, Gas Day gas day-ahead nomination deadline day-ahead renomination deadline intraday 1 renomination deadline gas day-ahead schedule released gas renomination schedule released intraday 2 renomination deadline intraday 1 schedule released 10AM, Next Day intraday 2 schedule released ISO-NE bids due ISO-NE day-ahead results
Figure 1-6: Gas and electricity market timing, New England, 2013
NESCOE’s discussions mirror similar concerns expressed by stakeholders in other electric power and gas systems. For example, see [Tabors et al., 2012] for an overview about market timing challenges and [FERC, 2012] for symposium discussions between public and private stakeholders in other gas-electricity systems in the United States. Given the similar roles that gas-fired power plants fulfill in power systems around the United States and the rest of the world, the emerging reliability problems described in these sources and above by NESCOE likely also affect other coupled gas-electricity systems that depend on natural gas for electricity generation, cannot easily/quickly switch away if faced with a scarcity of natural gas, and cannot guarantee fuel avail-ability.
1.2.3
The need for new decision support models
NESCOE’s discussions about potential market and policy changes to reduce the prob-ability of gas and electricity supply failures highlight the importance for decision mak-ers to better undmak-erstand the optimal decisions of generation firms. Firms that own gas-fired generation plants today in wholesale electricity markets operate under sub-stantial uncertainty due to difficulty with forecasting pipeline scarcities and residual
electricity demands, especially in power systems with large renewable penetrations. Prior to the large penetration of intermittent renewables and innovations in hy-draulic fracturing techniques, electric power systems consumed less natural gas cause other generation technologies provided sufficient operational flexibility and be-cause gas-fired power plants, as a technology, were relatively expensive compared to other thermal technologies such as coal and nuclear. The level of pipeline investment in most regions sufficiently met the gas transportation needs of power systems. At the same time, electricity demand before renewables tended to exhibit predictable daily, weekly, and seasonal patterns that power plant owners and system operators could plan for. In this context, decision makers have historically placed less emphasis on the specifics of gas-fired power plants relative to other thermal power plants13, and the
evolution of power system models and the details that they incorporate, reviewed be-low, have followed accordingly. The emerging dependence between gas and electricity systems has created a need for a new set of tools that can represent gas-fired power plants with greater nuance over longer timescales to support present day operations decisions and policy analyses.
In existing electricity optimization models ranging from long-term capacity expan-sion to medium-term hydrothermal coordination and short-term unit commitment/e-conomic dispatch, a typical representation of a thermal power plant consists of a unit heat rate (or a piecewise linear heat rate curve) that describes the amount of fuel required to generate a unit of electricity, an additional unit cost on top of each unit of energy generated to account for operations and maintenance, fixed costs for starting and stopping a power plant, maximum rates at which a power plant can modify its output level per unit time, and minimum lengths of time that a power plant must stay on for after starting and off for after stopping. For a representative sample of foundational and current unit commitment papers that use this representation, see [Padhy, 2004]. This generic representation of thermal plants in optimization models treats a gas-fired power plant in the exact same manner as a nuclear plant or a coal
13For example, the annual regional system planning reports published by ISO-NE illustrate a
progressive trend, starting in 2013, about the region’s gas and electricity difficulties; prior to 2013, gas did not appear as a potential reliability problem.
plant; in particular, this generic representation typically assumes that fuel is avail-able with complete certainty, and the operations and maintenance of gas-fired power plants do not take into consideration the influence of long-term service agreements.
Optimization models are not the only types of electricity models that tend to group gas-fired power plants together with their thermal counterparts. Probabilis-tic reliability models also group gas-fired power plants together with other thermal plants, and these probabilistic models tend to treat plant failures from the perspective of mechanical forced outages. For example, see [Baleriaux et al., 1967], [Booth, 1972], and [Finger, 1975] for foundational papers in probabilistic production cost analyses of forced plant outages. In the 1990s, [Conejo, 1992] and [Maceira et al., 1996] con-tributed important extensions that allowed probabilistic production cost algorithms to more properly represent limited energy plants and storage technologies. These ex-tensions could be applied to analyze the reliability characteristics of gas-fired power plants with limited fuel transportation by representing gas-fired power plant as a limited energy plant with inflows and outflows, but no storage. However, such an analysis would require assigning functional probability distributions to fuel availabil-ities, and unlike their optimization counterparts, probabilistic production models do not represent the power system with enough detail to make day-to-day operational decisions.
Of the authors that have studied the specific role of gas-fired power plants in power systems and the impacts of their strategic decisions on day-to-day operations, the substantial majority of existing work focuses on representing the constraints and decisions associated with the physical pipeline that delivers natural gas to generators. The earliest of these works focused on utilities that must purchase gas for not electric-ity generation, but for consumer end use. For example, on the problem of selecting long-term fuel contracts under demand uncertainty,
• [Guldmann, 1983] uses a chance-constrained cost minimization model to ex-plore tradeoffs of a take-or-pay contract in which the utility must also make storage and interruptibility decisions, taking into consideration the technologi-cal constraints of gas storage flows. (In a chance-constrained optimization, the
right-hand side constraint values represent probabilities.)
• [Fancher et al., 1986] demonstrates the implications of fuel burn uncertainty on take-and-pay contracts. The author describes coal consumption, but the paper can also be applied to gas.
• [Avery et al., 1992] discusses optimal purchase, storage, and transmission deci-sions for a utility that is obligated to serve small residential consumers and that serves larger consumers on an interruptible basis.
• [Guldmann and Wang, 1999] proposes a MILP to solve the LDC’s problem of optimally choosing supply contracts, taking into consideration contractual min-imum take provisions and gas curtailment constraints.
• [Aouam et al., 2010] defines a combination strategy between a dynamic model that evaluates mean risk under stochastic demand and prices and a naive model that equally allocates procurement between storage, futures, and options. The authors create a convex combination of both strategies to minimize the mean and variance of procurement costs.
• [Koberstein et al., 2011] proposes a stochastic LP model that optimizes gas sup-ply contracts, taking into consideration demand uncertainty, storage, and trans-portation.
Generation firms, of course, operate under a different business model than local distribution companies. LDCs, due to their regulated monopoly structure, are able to enter into long-term fuel contracts confident that they will earn enough from their captive consumers to repay their long-term commitments for fuel. Generation firms in wholesale electricity markets do not operate with the same guarantee, and con-sequently, face two broad problems related to gas availability and operating in gas markets. The first problem, frequently referred to as a “fuel-constrained unit com-mitment,” broadly asks how generation firms should optimally operate their power plants given a finite amount of available fuel. On this topic, authors have written the following representative papers:
• [Meeteren, 1984] presents an iterative LP unit commitment model that explic-itly allocates limited fuel supplies to generation units in the system. The model generates fuel allocation solutions and unit commitment solutions separately and feeds the fuel allocation results as an input for the unit commitment prob-lem.
• [Cohen and Wan, 1987] presents an iterative Lagrangian decomposition method for solving the fuel-constrained unit commitment problem where the fuel con-straints are included in the primary objective function (i.e., the fuel allocation is not solved separately and then passed in as an input).
• [Vemuri and Lemonidis, 1992] presents an iterative, Lagrangean-relaxation-based approach for solving the fuel-constrained unit commitment problem. Vemuri’s model, like Meeteran’s, separates the fuel allocation and unit commitment prob-lem into two separate optimizations.
• [Thompson, 1995] presents a lattice-based contingent claim model to evaluate take-or-pay and take-or-pay-with-makeup contracts.
• [Wong and Wong, 1996] presents a combined genetic algorithm/simulated an-nealing approach to solve the fuel-constrained unit commitment problem.
In addition to operating their generation assets under fuel constraints, generation firms also face a broad problem of deciding how to optimally participate as a con-sumer in one commodity market and a producer in another commodity market. The question of how much long-term gas transportation capacity to commit to is sim-ply one example of a challenge that these firms must tackle; another example is the question of how much capacity to commit in a forward capacity market for electricity under fuel uncertainty. On the topic of making simultaneous decisions in both gas and electricity systems, authors have written the following representative works:
• [Lee, 1989] proposes a unit commitment model for Oklahoma Gas & Electric that takes into consideration significant fuel constraints from take-or-pay con-tracts and physical delivery constraints from the gas network.
• [Lee, 1991] proposes a model to optimize coordination between multiple strained fuels for an electric utility (the contracts look like take-or-pay con-tracts, but there is no explicit underlift variable. The optimization requires fuel consumption between the min and max range).
• [Butler and Dyer, 1999] examines the value of three types of long-term fuel con-tracts to electricity generators;
• [Grossman et al., 2000] analyzes the value of long-term take-or-pay contracts for organizations that require fuel to produce another good for sale.
• [Chen and Baldick, 2007] presents a utility-maximization model for electric util-ities that also own natural gas fired power plants and must make gas supply de-cisions in addition to electricity generation dede-cisions. Instead of only minimizing total cost on the generation side, Chen’s mixed integer nonlinear programming model incorporates risk preferences for the electric utility with respect to how its total costs can change given its decisions in both gas and electricity markets.
• [Street et al., 2008] propose a stochastic model to price flexible gas supply con-tracts for power producers, taking into consideration electricity demand uncer-tainty and fuel unavailability unceruncer-tainty.
• [Vaitheeswaran and Balasubramanian, 2010] develops a risk-constrained expected fuel cost minimization model for an natural gas combined-cycle power producer, considering stochastic demand and gas prices.
• [Vaitheeswaran and Balasubramanian, 2012] develops a risk-constrained model (using the conditional value at risk metric) to solve the fuel allocation problem (how to allocate supply between various possible contracts) for the owner of a portfolio of natural gas plants.
• [Dueñas et al., 2012] describes a medium-term gas/electricity optimization model from the perspective of the generation company in which the generation com-pany must make gas procurement and electricity generation decisions. The
model treats all price parameters as exogenous inputs, and gas contracts are treated as opportunity costs of purchasing gas at the contract price versus the spot price, as well as the opportunity cost of consuming or selling gas at the spot price.
Thus far, the substantial body of work on gas-electricity systems has focused on analyzing fuel constraints in the short term, with a handful of recent works focused on long-term strategic fuel decisions for generation firms. Regarding non-fuel-related problems that are specific to gas-fired power plants, [Troy et al., 2012] describes the impact of dynamic operations and maintenance costs on the unit commitment prob-lem, and [Rodilla et al., 2014] presents an extension to the classic unit commitment model that incorporates the impact of long-term service agreements on a power sys-tem’s short-term optimal dispatch schedule. Despite the material impact that specific features of gas-fired power plants can make on a power system’s optimal operation, the survey of the existing literature on gas and electricity models shows that works such as [Troy et al., 2012] and [Rodilla et al., 2014] tend to be relatively rare. Several reasonable explanations exist for why this is the case. For example, in the past, gas-fired power plants did not play the large role in power systems that they do today and approximating gas-fired power plants as generic thermal plants may have sufficiently represented reality while simultaneously removing unnecessary computational effort. Alternatively, some gas-specific features, such as long-term service agreements, were not the norm a decade or two ago; [Sundheim, 2001] suggests as much. Consequently, these features did not appear in past model formulations because they, in fact, did not exist at the time. However, as gas and electricity systems become more interde-pendent and the firms that own gas-fired power plants exert more influence on both systems, the specificities of gas-fired power plants will rise in importance. To under-stand and act on emerging problems, decision makers today need a new set of tools that can examine the optimal behavior of firms that own gas-fired generation plants in gas and electricity markets over a range of timescales.
1.3
Research statement
To better understand how firms should make decisions in coupled gas and electricity systems, this dissertation develops a MILP model that explores the optimal behavior of firms that own gas-fired power plants. Based on the existing body of literature on the operation of gas-fired power plants, as well as current private and public dis-cussions about notable attributes and decisions that impact today’s power systems (e.g., [FERC, 2012, MITEI, 2011a, Tabors et al., 2012, Barquín, 2012, MITEI, 2013, Hunt et al., 2014]), this dissertation focuses on how firms should make their fuel, maintenance, and generation decisions under uncertainty from fuel availability and electricity demand under the assumption of a perfectly competitive market. The fol-lowing section describes each of the firm’s decisions that this dissertation will analyze, explains the dimensionality challenges that arise with modeling, and concludes with real-world hypotheses to explore.
1.3.1
Strategic decisions
Long-term fuel contracts
Pipeline operators have a fixed amount of pipeline capacity that they own and can auction to producers, local distribution companies, generators, and industrial users. To allocate this scarce capacity, pipeline operators offer different tiers of service that correspond to different tiers of interruptibility. Large, wholesale gas consumers must purchase gas contracts to secure transport capacity and commodity. Although gas contracts come in a variety of options, the most common classification of gas contracts is by level of transportation service and time duration. Transportation service levels range from completely firm (guaranteed capacity on the pipeline) to interruptible (no guarantee of capacity):
“A firm transportation contract allows the shipper to reserve a portion of the pipeline’s total delivery capacity for his own use. The shipper pays a monthly demand charge based on the maximum daily delivery quantity
contracted for, and a transportation charge for each unit of gas delivered. Additional pipeline transportation service is available on an interruptible basis. For interruptible transportation services the shipper generally pays only for the gas transported.” [Avery et al., 1992]
As an example of the different tiers of transportation service that pipeline operators offer, pipeline operator Transco notes that its interruptible contracts are subject to curtailment and interruption due to operating conditions and insufficient pipeline capacity. Interruptible contracts that flow to a downstream pooling point have higher priority than other interruptible contracts, but a lower priority than gas moving on a firm transportation contract. Transco’s consumers on interruptible contracts only pay for the volume of gas that they ship (as compared to shippers with firm contracts, who must pay for both the firm contract and the volume of gas shipped). [Transco, 2012] In addition to varying levels of service corresponding to varying guarantees of pipeline capacity availability, gas contracts can be broadly categorized by time duration as follows [Guldmann, 1983]:
• “Short-term contracts, where fixed daily volume deliveries, at fixed price, are arranged for one month or less; they allow for short-term unbalances in supply and/or demand to be corrected; such contracts make up what is called the spot market.”
• “Mid-term contracts, for periods of up to 18 months, with variable prices indexed to some future or spot price, and with fixed reservation and service fees, irrespective of volumes taken.”
• “Long-term contracts, for periods of 18 months to 15-20 years, with reservation fees and minimum take provisions; prices are indexed, and contracts often include renegotiating and market-out clauses.”
The generation firm’s long-term fuel contracting problem requires choosing the levels of transportation service to commit to, the time durations for each level of service, and the price for each contract. For a long-term firm-transportation contract, the
individual firm trades off paying for guaranteed access to a specific amount of pipeline capacity that it may or may not need in the future with the risk of not being able to acquire capacity that it does need at some later point in time.
Long-term service agreements
When a generation firm purchases a new gas-fired power plant, typically it also pur-chases a matching long-term service agreement (LTSA) from the manufacturer. The LTSA covers maintenance that the power plant needs to continue operating nor-mally; concretely, services may include semiannual plant inspections of the power plant’s steam generators and turbines, mechanical repairs and parts replacements, and guarantees of financial compensation for the owner if the manufacturer is un-able to restore the power plant to working condition within some prearranged time window. [Boyce, 2012, Thompson and Yost, 2014] LTSAs originated as a method for manufacturers and plant owners to share risk. Owners pay manufacturers a pre-mium to guarantee the operation of their power plant and place a maximum cap on maintenance costs. Manufacturers, conversely, use their knowledge about their own equipment to reasonably estimate the total cost of maintenance assuming that firms operate their plants in an expected fashion and earn the difference between the owner’s premium and the actual cost of maintenance. [Sundheim, 2001]
To ensure that generation firms operate their power plants “in an expected fash-ion,” as part of their LTSAs, manufacturers define maintenance interval functions (MIFs) that dictate when an LTSA ends. A typical MIF contains the maximum number of firing hours, starts, and a function of the two that a plant can accumulate over the duration of its LTSA. As an example, Figure 1-7 represents three possible MIFs corresponding to three hypothetical LTSAs. Curve C represents the most flex-ible MIF because it allows all combinations of firing hours and starts that curves A and B represent, whereas curve A represents the most restrictive LTSA.