HAL Id: hal-01365556
https://hal.sorbonne-universite.fr/hal-01365556
Submitted on 13 Sep 2016
HAL is a multi-disciplinary open access
archive for the deposit and dissemination of
sci-entific research documents, whether they are
pub-lished or not. The documents may come from
teaching and research institutions in France or
abroad, or from public or private research centers.
L’archive ouverte pluridisciplinaire HAL, est
destinée au dépôt et à la diffusion de documents
scientifiques de niveau recherche, publiés ou non,
émanant des établissements d’enseignement et de
recherche français ou étrangers, des laboratoires
publics ou privés.
Distributed under a Creative Commons Attribution| 4.0 International License
Rats
Pamela J Kaisaki, Georg W. Otto, Joanna F. Mcgouran, Amine Toubal,
Karène Argoud, Helen Waller-Evans, Clare Finlay, Sophie Calderari,
Marie-Thérèse Bihoreau, Benedikt M Kessler, et al.
To cite this version:
Pamela J Kaisaki, Georg W. Otto, Joanna F. Mcgouran, Amine Toubal, Karène Argoud, et al..
Genetic Control of Differential Acetylation in Diabetic Rats. PLoS ONE, Public Library of Science,
2014, 9 (4), pp.e94555. �10.1371/journal.pone.0094555�. �hal-01365556�
Rats
Pamela J. Kaisaki1, Georg W. Otto1, Joanna F. McGouran2, Amine Toubal3,4, Kare`ne Argoud1,
Helen Waller-Evans1, Clare Finlay1, Sophie Calde´rari3,4, Marie-The´re`se Bihoreau5, Benedikt M. Kessler2, Dominique Gauguier3,4, Richard Mott1*
1 The Wellcome Trust Centre for Human Genetics, University of Oxford, Headington, Oxford, United Kingdom, 2 Target Discovery Institute, Nuffield Department of
Medicine, University of Oxford, Oxford, United Kingdom,3 INSERM, U872, Cordeliers Research Centre, Paris, France, 4 Institute of Cardiometabolism & Nutrition, ICAN,
Pitie´-Salpeˆtrie`re Hospital, University Pierre & Marie-Curie, Paris, France,5 National Genotyping Centre, Evry, France
Abstract
Post-translational protein modifications such as acetylation have significant regulatory roles in metabolic processes, but their relationship to both variation in gene expression and DNA sequence is unclear. We address this question in the Goto-Kakizaki (GK) rat inbred strain, a model of polygenic type 2 diabetes. Expression of the NAD-dependent deacetylase Sirtuin-3 is down-regulated in GK rats compared to normoglycemic Brown Norway (BN) rats. We show first that a promoter SNP causes down-regulation of Sirtuin-3 expression in GK rats. We then use mass-spectrometry to identify proteome-wide differential lysine acetylation of putative Sirtuin-3 protein targets in livers of GK and BN rats. These include many proteins in pathways connected to diabetes and metabolic syndrome. We finally sequence GK and BN liver transcriptomes and find that mRNA expression of these targets does not differ significantly between GK and BN rats, in contrast to other components of the same pathways. We conclude that physiological differences between GK and BN rats are mediated by a combination of differential protein acetylation and gene transcription and that genetic variation can modulate acetylation independently of expression.
Citation: Kaisaki PJ, Otto GW, McGouran JF, Toubal A, Argoud K, et al. (2014) Genetic Control of Differential Acetylation in Diabetic Rats. PLoS ONE 9(4): e94555. doi:10.1371/journal.pone.0094555
Editor: Beata G Vertessy, Institute of Enzymology of the Hungarian Academy of Science, Hungary Received September 30, 2013; Accepted March 18, 2014; Published April 17, 2014
Copyright: ß 2014 Kaisaki et al. This is an open-access article distributed under the terms of the Creative Commons Attribution License, which permits unrestricted use, distribution, and reproduction in any medium, provided the original author and source are credited.
Funding: This work was supported by a Wellcome Trust grant to RM (083573/Z/07/Z), a Wellcome Trust Senior Fellowship in Basic Biomedical Science (057733) to DG, a Wellcome Trust Core Award Grant (075491/Z/04), Wellcome Trust grant reference 090532/Z/09/Z, MRC Hub grant G0900747 91070, a grant from the European Community’s Seventh Framework Programmes under the grant agreement HEALTH-F4-2010-241504 (EURATRANS), the Agence Nationale pour la Recherche (ANR-08-GENOPAT-030), the Fondation pour la Recherche Me´dicale (FRM, INE20091217993) and the Institute of Cardiometabolism and Nutrition (ICAN, ANR-10-IAHU-05). BMK is supported by the Biomedical Research Centre (NIHR) Oxford and a John Fell OUP award. The funders had no role in study design, data collection and analysis, decision to publish, or preparation of the manuscript.
Competing Interests: The authors have declared that no competing interests exist. * E-mail: richard.mott@well.ox.ac.uk
Introduction
Post-translational modification (PTM) of proteins is one means by which an organism can alter protein function independently of transcription and translation. There are over 400 characterised PTMs, including phosphorylation, acetylation, methylation, ubi-quitination and SUMOylation. In this study, we focus on protein acetylation, which is regulated by complex mechanisms involving families of acetyltransferases and deacetylases. Acetylation of enzymes may affect their activity, and is a mechanism used by cells to make metabolic adaptations, possibly through the coordination of pathways such as glycolysis, gluconeogenesis, citrate cycle, fatty acid metabolism, urea cycle, and glycogen metabolism [1]. Many of the essential enzymes required for metabolite processing in liver are acetylated [2]. As a consequence, variation in protein acetylation is expected to affect diseases such as diabetes and the metabolic syndrome (Reaven’s syndrome).
Animal models of diabetes can reveal causal relationships between altered protein acetylation and impaired glucose homeo-stasis. The Goto-Kakizaki (GK) rat is an established model of spontaneous non-obese Type 2 diabetes, which has elevated blood glucose and peripheral insulin resistance similar to human Type 2
diabetes [3]. The genetic basis of metabolic and hormonal anomalies in the GK rat has been mapped in crosses between GK and non-diabetic Brown Norway (BN) rats which identified quantitative trait loci (QTL) linked to diabetes-related phenotypes such as glucose intolerance [4]. The GK rat is also a model for the metabolic syndrome, because it exhibits traits of salt-induced hypertension, increased adiposity, glucose intolerance, and hyper-lipidemia [5–8].
Previous genome-wide liver transcriptome analyses in rat strains [9] identified significantly down-regulated expression of the NAD-dependent deacetylase sirtuin 3 (Sirt3) in GK compared to BN rats. Sirtuins influence insulin sensitivity and energy homeostasis and possibly ageing. There is controversy over their role in ageing [10], but it is known that they mediate metabolic adaptation to stress and changes in nutrition [11].
The transcriptional difference between GK and BN was confirmed in a further microarray study [6] of a congenic rat strain carrying a large section (170 Mb) of GK chromosome 1 associated with glucose intolerance, where Sirt3 is localised, on a BN genetic background (1consomic). GK alleles in this region are associated with lower Sirt3 expression (p = 0.0030). Sirt3 is likely to affect metabolism and may account for the observed effect because
it is a key regulator of mitochondrial protein acetylation levels [12].
Due to the potential importance of differential expression of Sirt3 between BN and GK rats, we undertook a series of experiments to first validate and then fine-map the difference in Sirt3 transcript levels to discover the cause of this variation, and finally to explore the effects of lower Sirt3 deacetylase activity on protein acetylation in liver, and determine whether differences in lysine acetylation of metabolic enzymes sheds light on the pathophysiology of the GK rat. We identify alterations in liver protein acetylation and gene transcription that may contribute to physiological differences between GK and BN rats.
Results
Transcription regulation of Sirt3 in congenic strains of the GK rat
We performed genome-wide gene expression analysis using Illumina expression microarrays, on white adipose tissue, kidney, skeletal muscle, liver and brown adipose tissue (BAT) from BN and 1consomic rats, and found 1.6-fold higher transcript levels of Sirt3 in BAT from BN rats compared to 1consomic rats (p = 6.761025), and similar results in liver, consistent with our earlier finding obtained with Affymetrix arrays in liver from the same congenic and control rats [9]. Sirt3 is the tenth most significantly differentially expressed gene (DEG) out of 92 DEG in the 1consomic interval in BAT, and twelfth most differentially expressed gene in liver (out of 100 DEG). The difference in Sirt3 expression appears to be specific to liver and BAT, because it was not present in white adipose, kidney or skeletal muscle. We performed qRT-PCR in order to validate these differences in liver and BAT from BN and 1consomic rats. Expression of Sirt3 was significantly lower in both tissues from 1consomic compared to BN (p,0.05) (Figure 1A).
To fine-map this variation, we used qRT-PCR to compare Sirt3 transcription in BAT from three BN.GK congenic strains of rat chromosome 1 containing either the GK allele of Sirt3 (strains 1h and 1o) with BN or the BN allele of Sirt3 (strain 1b). Figure 1B, right, illustrates these congenic strains, and shows that compared to BN and congenic 1b, Sirt3 expression was lower (p,2.061024) in strains 1h and 1o. These results confirm that GK alleles nearby Sirt3 down-regulate its transcription in cis.
Identification and functional analysis of Sirt3 polymorphisms in the GK rat
To identify the cis-acting variants affecting Sirt3 transcription, we compared the sequences of the Sirt3 gene, including its promoter, in GK and BN in the interval 1:201019865-201045697. We detected 64 intronic SNPs, 3 intronic insertions, 3 intronic deletions, one known synonymous coding SNP (rs13449840), and one SNP in the 59-UTR, which was within the Sirt3 promoter (1:201044229_C/T). We investigated the consequences of segre-gating polymorphisms using the Variant Effect Predictor [13]) (Table S1) but no obviously functional coding variants were found. The 646 bp Sirt3 promoter is bi-directional, and lies between the transcriptional start site (TSS) of Sirt3 and the TSS of a neighboring gene encoding the proteasome non-ATPase regula-tory subunit 13 (Psmd13) (Figure 2A) [14]. Expression of Psmd13 was not altered in liver and BAT of GK and BN rat. The Sirt3 promoter SNP occurs within a predicted binding site for the estrogen-related receptor response element (ERRE) transcription factor, which is known to activate Sirt3 transcription in the mouse [15]. In order to test whether the variant affected function of the ERRE, we cloned both the BN and GK alleles of the promoter sequence into luciferase reporter construct pGL3-basic. No difference in luciferase activity was observed when HEK293T kidney cells were transfected at two concentrations with the GK promoter compared to BN control (Figure S1). However, when transfected into Hep3B hepatocyte cells, luciferase activity driven by the GK promoter at the higher level of transfection was significantly less than that of BN (p,0.05) (Figure 2B). We conclude that the GK promoter variant in Sirt3 is the likely cause of the cis-regulated transcriptional downregulation of the GK allele, and that this effect is tissue-specific.
RNA-sequencing
We sequenced mRNA from the liver and BAT of GK and BN rats, and identified differentially expressed transcripts in each tissue (Tables S2 and S3). RNA-sequencing re-confirmed that Sirt3 is down-regulated in both BAT (GK 47% lower than BN) and liver (37% lower) from GK rats compared to BN. KEGG pathway enrichment analysis was then performed (Tables S4 and S5). In BAT, the most significantly over-represented pathways that differentiated GK and BN rats were ‘‘Metabolic pathways’’
Figure 1. Validation ofSirt3transcript levels. QRT-PCR of Sirt3 levels (A) comparing BN control rat and congenic strain 1consomic (which has GK chromosome 1 on a BN genetic background), in liver (blue) and BAT (green); (B) left, comparing BAT from BN and three congenic strains, two carrying GK allele of Sirt3 (1o and 1h), and one with BN allele of Sirt3 (1b); (C) diagram of BN.GK chromosome 1 congenic strains used, with maroon bars representing region of GK chromosome 1 introgressed onto BN background. (Genomic location of Sirt3 is indicated.) Results are corrected for expression of housekeeping gene 36B4.
(p = 3.08610213) and ‘‘Oxidative phosphorylation’’ (p = 1.636 1029). Digestion and absorption of protein and fat are also over-represented in BAT, as well as fatty acid metabolism and PPAR signaling pathway. In liver, KEGG analysis again highlights ‘‘Metabolic pathways’’ as the most significantly over-represented pathway amongst the differentially expressed genes (p = 8.41610214). Cytochrome P450 metabolism, PPAR signaling and steroid hormone biosynthesis are among the top five significantly over-represented pathways in liver. Because Sirt3 is a target of PPARG-coactivator1-alpha, and therefore involved in PPAR-gamma signaling, it is not surprising that PPAR signaling is affected [15].
Proteome-wide analysis of liver protein acetylation
Since Sirt3 is the major deacetylase enzyme in mitochondria, we reasoned that lower levels of Sirt3 in GK liver would increase lysine-acetylation of proteins. Therefore, we determined global liver protein acetylation in GK and BN rats. First, in order to enrich for acetylated proteins, an equal amount of liver protein extract from GK and BN rats was digested with trypsin, then subjected to immunoprecipitation using pan-acetyllysine antibod-ies. These enriched peptides were analysed by liquid chromatog-raphy tandem mass spectrometry (LC-MS/MS). The 89 differen-tially acetylated peptides we identified with .95% confidence are listed in Table S6, and examples are shown in Figure S2. Unfortunately, we could not determine global lysine acetylation in BAT, possibly due to insufficient tissue.
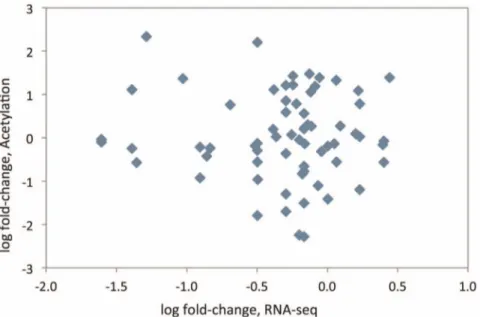
As the measurement of acetylated peptides does not distinguish between differing levels of protein and differing levels of acetylation, we used our transcriptomic data to test if the acetylation differences were correlated with variable gene expres-sion, which we measured on the level of gene transcription. Absence of differential gene expression would suggest that observed acetylation differences are due to differential protein acetylation. Transcript measurements for each lysine-acetylated protein are given in Table S6. Transcripts for 28% of the acetylated proteins are differentially expressed at FDR p,0.05, but for 91% of the peptides, there is either no change in transcript level, or it is in the opposite direction to the change in acetylation. When fold-change of acetylation is plotted against fold-change of RNA-seq, no correlation is observed (Figure 3). Therefore, most of the differences measured by mass-spectrometry are likely to be due to varying acetylation levels rather than amount of protein. Eighteen genes encoding known acetylated proteins have signif-icantly different gene expression between BN and GK or 1consomic liver (see Table 1), but none were significantly
differentially acetylated (malate dehydrogenase 1, but not malate dehydrogenase 2, is differentially acetylated). We do not know whether the proteins in Table 1 are not acetylated in GK or BN rat liver, or whether they are acetylated but below our level of detection.
Most of the differentially acetylated peptides between GK and BN liver (Table S6, Figure S2), are enzymes in key metabolic pathways, as listed below. Thirty-six of the 89 proteins listed were also found to be acetylated in a study of Sirt3-knockout mice, providing evidence that they are targets of Sirt3 [16]. Note that proteins annotated ‘‘BN only’’ or ‘‘GK only’’ might still be acetylated below the level of detection for the experimental approach used.
(i) Glycolysis and gluconeogenesis. Peptides from glycer-aldehyde 3-phosphate dehydrogenase (Gapdh) were acetylated between 2.3- and 2.7-fold more in GK than BN liver. One acetylated peptide of dihydrolipoamide dehydrogenase (Dld), a component of pyruvate dehydrogenase complex, is only detected in GK liver, and another Dld derived peptide is about 10% less acetylated in GK than BN. Acetylated phosphoglycerate kinase 2 was detected in BN only. Other acetylated proteins with the KEGG term glycolysis/gluconeogenesis include alcohol dehydro-genase (Adh), with one peptide 2-fold more acetylated in GK, and one slightly less in GK than BN, and lactate dehydrogenase, where an LdhC peptide is acetylated in GK only and an LdhA peptide acetylated in BN only.
(ii) TCA cycle. Acetylation of aconitate hydrolase (Aco) is 2-fold higher in GK liver than in BN. Dihydrolipoyllysine-residue succinyltransferase (Dlst) and one peptide of dihydrolipoamide dehydrogenase (Dld), which are components of the a-ketoglutarate dehydrogenase complex in TCA cycle, are only acetylated in GK liver. Succinyl-CoA synthetase alpha subunit (Suclg1) is 2.6-fold more acetylated in GK than BN livers. Both succinate dehydro-genase (Sdh), a known target of Sirt3, and fumarate hydratase, were only acetylated in GK. Malate dehydrogenase 1 (Mdh1) was only acetylated in BN liver (this is the cytosolic isoform involved in the malate-aspartate shuttle). Peptides from different subunits of ATP synthase in oxidative phosphorylation are also acetylated: ATP synthase subunit A is only acetylated in GK, ATP synthase subunit B is acetylated in both GK and BN, and ATP synthase subunit D is twice as acetylated in GK as BN.
(iii) Pentose phosphate pathway (hexose monophosphate shunt). Components of this pathway, which is the major source of NADPH required for anabolic processes, were acetylated. For example, UDP-glucose 6-dehydrogenase was only acetylated in
Figure 2.Sirt3promoter variant and luciferase assay. (A) Bidirectional promoter of Sirt3 and Psmd13. One single nucleotide polymorphism (1:201044229_C/T) was identified when comparing sequence of GK promoter with BN. (B) Luciferase reporter assay results for transfection of hepatoma cell line. BN or GK allele of Sirt3 promoter was cloned into pGL3-basic vector upstream of luciferase gene, and transfected into Hep3B cells at two levels, 0.1 and 0.4 ug/well. Results are corrected for transfection efficiency by co-transfection with beta-galactosidase vector, and represent two-three independent transfections, which were run in triplicate wells.
GK liver. Transketolase (Tkt) was 2.6-fold more acetylated in GK than BN liver.
(iv) Fatty acid metabolism. These pathways include acetyl-CoA acyltransferase (Acaa2), an enzyme in fatty acid beta-oxidation and elongation, which has 2 acetylated peptides that are only detected in GK liver. One peptide of mitochondrial acetyl-CoA acetyltransferase Acat1 is more highly acetylated in GK
rat liver than in BN, but other peptides from Acat1 and a peptide from cytosolic Acat2 are only acetylated in BN liver. Mitochondrial medium-chain acyl-CoA dehydrogenase (Acadm) and enoyl-CoA delta isomerase 1 (Eci1) are only acetylated in GK liver. Echs1 (enoyl-CoA hydratase/3-ketoacyl thiolase 1, mitochondrial) is acetylated about equally in GK and BN. Several peptides of fatty acid-binding protein, important in fat transport and PPAR
Figure 3. Scatter-plot of log fold-change of lysine acetylation and fold-change of RNA-sequencing. Each point represents one protein/ transcript. y-axis: log2 of fold change in protein acetylation between GK and BN rats. x-axis: log2 of fold-change in mRNA sequence counts between GK and BN rats.
doi:10.1371/journal.pone.0094555.g003
Table 1. Illumina liver transcripts significantly differentially expressed between GK and BN or 1Consomic strain rats.
Gene Symbol Description
GK/BN log2 fold-change GK/BN FDR 1Cons/BN log2 fold-change 1Cons/BN FDR Phf20 PHD finger protein 20 0.68 0.0000 20.21 0.146
Asl argininosuccinate lyase 21.40 0.0000 0.15 0.666
Mdh2 malate dehydrogenase 2, NAD (mitochondrial) 0.41 0.0002 20.30 0.027
Spi1 spleen focus forming virus (SFFV) proviral integration oncogene spi1 0.84 0.0003 0.08 0.819
Taf5l TAF5-like RNA polymerase II, p300/CBP-associated factor (PCAF)-associated factor 20.59 0.0005 0.63 0.008
Ncoa1 nuclear receptor coactivator 1 20.42 0.0022 20.10 0.609
Dscc1 defective in sister chromatid cohesion 1 homolog (S. cerevisiae) 0.39 0.0044 0.26 0.152
Ctbp1 C-terminal binding protein 1 0.28 0.0047 20.20 0.145
Pole4 polymerase (DNA-directed), epsilon 4 (p12 subunit) 0.26 0.0071 0.09 0.509
Yeats4 YEATS domain containing 4 0.32 0.0097 20.09 0.621
Kat2a K(lysine) acetyltransferase 2A 0.42 0.0138 0.09 0.745
Gata2 GATA binding protein 2 20.28 0.0188 0.00 0.988
Por P450 (cytochrome) oxidoreductase 20.55 0.0347 0.16 0.695
Mbd3 methyl-CpG binding domain protein 3 0.28 0.0361 0.29 0.119
Bag6 BCL2-associated athanogene 6 20.23 0.0363 0.08 0.606
RGD1563945 similar to mKIAA0215 protein 20.14 0.1694 20.30 0.037
Bmi1 Bmi1 polycomb ring finger oncogene 0.18 0.5394 0.79 0.039
Eid1 EP300 interacting inhibitor of differentiation 1 0.02 0.9189 0.49 0.040
Gene ontology descriptions relating to protein acetylation or deacetylation are shown. Transcripts with False Discovery Rates (FDR),0.05 are in bold. doi:10.1371/journal.pone.0094555.t001
signaling, are acetylated, and one of these is 2.7-fold more acetylated in BN than in GK. Diazepam binding inhibitor (Dbi), which plays a role in acyl-CoA metabolism and mitochondrial steroidogenesis, is 1.5-fold more acetylated in BN than GK.
(v) Amino acid metabolism. Lysine ketoglutarate reductase, in lysine degradation, is only acetylated in GK. Similarly, aspartate aminotransferase (Got2) is only acetylated in GK, as was choline dehydrogenase (Chdh) and dimethylglycine dehydrogenase (Dmgdh), which are involved in glycine, serine and threonine metabolism, and glutamic-oxaloacetic transaminase 2 (Got2). Formimidoyltransferase-cyclodeaminase (Ftcd), an enzyme of histidine and one carbon metabolism, is only acetylated in BN. Omega-amidase (Nit2), which is involved in alanine, aspartate and glutamate metabolism, is acetylated 2-fold more in BN than in GK liver. There are several enzymes involved in amino acid metabolism that are acetylated, but differ less than 25% in their acetylation between BN and GK. These include aldehyde dehydrogenase 9A1 (Aldh9a1), which participates in degradation of many amino acids; arginase 1, betaine-homocysteine S-methyltransferase (Bhmt), which functions in methionine, cysteine, glycine, serine and threonine metabolism, and S-adenosylhomo-cysteine hydrolase (Ahcy), which is involved in S-adenosylhomo-cysteine and methionine metabolism.
(vi) Purine and pyrimidine pathway. This includes aden-osine kinase (Adk) and adenylate kinase (Ak), which are only acetylated in GK liver. Two peptides of carbamoyl-phosphate synthetase I (Cps1) are acetylated, one at about equal levels in BN and GK, and one that is twice as acetylated in BN as compared to GK. Carbamoyl-phosphate synthetase 2/aspartate transcarbamyl-ase/dihydroorotase (Cad) is only acetylated in GK. Dihydropyr-imidinase (Dpy) is very similar, with two acetylation sites detected, one about equally acetylated and one that is only acetylated in BN (Table S6).
Thus, as in other studies of protein acetylation, we find a wide range of metabolic pathways whose enzymes are affected by this modification. However, as lysine acetylation can either activate or inhibit an enzyme’s activity, the direction of effect must be determined empirically for each protein. Therefore, we cannot predict the overall consequence of differential acetylation for the majority of these pathways.
However, the citrate (TCA) cycle does contain enzymes for which the effect of acetylation has been directly determined, and by combining transcriptomic and proteomic data, we can predict the effects on this pathway due to acetylation rather than amount of protein. Additionally, we observe some TCA proteins that are not acetylated are nonetheless differentially expressed, which can also affect enzyme activity. Thus, the TCA pathway serves as a model for integrating the transcriptome and proteome, in order to give a more complete view of differences between the diabetic GK and control BN rat liver (Figure 4).
Liver transcription regulation of acetyltransferases and deacetylases
We also examined transcription patterns of genes encoding acetyltransferases and deacetylases in our Illumina transcriptomic data that were identified using Gene Ontology terms. We did so in order to determine whether the differences that we measured in lysine acetylation are part of a general trend toward altered acetylation, or specific to the down-regulation of Sirt3 (Tables 2 and 3). Nineteen acetyltransferases and eleven deacetylases were significantly differentially expressed between BN and GK, though the annotation may be incomplete. For instance, Sirt3 was not originally annotated on the Illumina array as a deacetylase. Besides Sirt3, there are five other deacetylases that show
significantly lower transcript level in GK than BN livers: MACRO domain containing 1 (Macrod1), amidohydrolase domain contain-ing 2 (Amdhd2), and histone deacetylases Hdac3, Hdac5, and Hdac11 (however, the substrates of Macrod1 and Amdhd2 are not proteins). Deacetylases that are overexpressed in GK (or 1consomic) when compared to BN are N-deacetylase/N-sulfotransferase (Ndst1), with target heparan sulfate (a linear polysaccharide), Phosphati-dylinositol glycan anchor biosynthesis, class L (Pigl), with target N-acetyl-D-glucosaminylphosphatidylinositol (a glycerophospholi-pid), arylacetamide deacetylase (Aadac), and ataxin 3 (Atxn3). Acetyltransferases that are significantly different between BN and GK include enzymes that acetylate xenobiotics (Nat1, higher in GK, and Nat2, lower in GK), metabolites (Acat3, Gnpnat1 and Crat, higher in GK; Gnpat, lower in GK), phospholipid (Lpcat1, lower in 1consomic), and a few where targets are unknown (Taf5l, Nat8, Nat8b). In certain cases, protein targets of the acetyltransferase have been identified: Pafah1b1, with targets platelet-activating factor and Plekhm1, and Sat2, with target eukaryotic initiation factor 5A, both lower in GK; and Pafah1b3, with target platelet-activating factor, Phf20, which targets histone; Naa20, which acts on proteins in cell cycle progression, and Kat2a, with target PGC-1 alpha, which are higher in GK. Macrod1 is functionally related to Sirt3, because a product of Sirt3 deacetylation reaction, O-acetyl-ADP-ribose, is a substrate of Macrod1 [17]. Macrod1 is not known to deacetylate proteins. Besides Sirt3, no other members of the sirtuin family are differentially expressed in liver (Table 3).
None of the differentially expressed acetyltransferases are in the chromosome 1 QTL linked to diabetes-related traits. Both acetyl-Coenzyme A acetyltransferase 3 and lysophosphatidylcholine acyltransferase 1 map to chromosome 1 but outside of the QTL region. Of the deacetylases tested for differential transcription, only Sirt3 and Macrod1 are within the QTL. As noted in Table S6, 40% of the acetylated proteins that we detected were also identified in a Sirt3-knockout model, and therefore are likely to be Sirt3 targets [16]. We conclude that, although we observe some difference in other enzymes affecting acetylation, a significant fraction of the changes in lysine acetylation are likely to be due to down-regulation of Sirt3.
Discussion
In this study, we have shown how transcript level and protein acetylation combine to control protein activity. This integrated, systems-level approach is crucial for understanding the regulation of complex phenotypes, including pathophysiological mechanisms involved in type 2 diabetes and cardiometabolic diseases. In our data, protein acetylation and gene transcription are independent of each other (figure 3) and hence have uncorrelated effects.
We identified a SNP in the promoter of Sirt3 that is probably responsible for the lower expression of Sirt3 in the liver of GK rats, and for downstream variation in protein acetylation in enzymes and pathways linked to diabetes and the metabolic syndrome. Sirt3 transcription is strongly activated by PGC-1a in combination with ERRa in mouse muscle cells and hepatocytes [15]. It also mediates the influence of PGC-1a on mitochondrial biogenesis and the production of reactive oxygen species. Mouse knockouts of Sirt3 cause mitochondrial protein hyperacetylation [12]. The effect of deacetylation by Sirt3 on enzyme activity has been measured experimentally for 18 proteins [18,19], and for 78% of these, the deacetylated form has higher activity. Enzymes whose activities increase upon deacetylation include mitochondrial acetyl-CoA synthetase (AceCS2), required for producing acetyl-CoA under ketogenic conditions such as fasting. Sirt3 deacetylation also acti-vates Complexes I (NDUFA9) and II (succinate dehydrogenase) of
the electron transport chain, though SDH activity was reported to be affected only in MEFs and brown adipose tissue, not liver [10,20]. Sirt32/2 knockout mice have reduced ATP production [21]. Other enzymes in the TCA cycle affected by deacetylation include isocitrate dehydrogenase (deacetylation causes higher activity) [22] and malate dehydrogenase (lower activity) [18]. Sirt3 reduces reactive oxygen species in cells by activating mitochondria manganese superoxide dismutase 2 [23]. Mitochondrial 3-hydroxy-3-methylglutaryl CoA synthase 2 (Hmgcs2)[24,25] gluta-mate dehydrogenase (Gdh) [22], forkhead box O3a (Foxo3a) [24], Ku70 [25], long chain acyl CoA dehydrogenase (Lcad) [23], Serine/threonine protein kinase 11 (Stk11, or Lkb1) [26], and mitochondrial ribosomal protein L10 (Mrpl10) [27], are all activated when deacetylated by Sirt3. Of these proteins, we detect acetylation of succinate dehydrogenase and malate dehydrogenase in our data.
By integrating our GK and BN liver transcriptome and acetylome analyses, we can predict the effects on the TCA cycle (Figure 4). Malate dehydrogenase 1 (Mdh1), whose activity increases with acetylation, is only acetylated in BN liver, so BN Mdh1 activity is predicted to be higher than in GK. Succinate dehydrogenase (Sdh; Complex II of oxidative phosphorylation) is only acetylated in GK liver. Since Sdh activity decreases when it is acetylated, we predict that GK Sdh activity is lower than in BN [27]. Isocitrate dehydrogenase 2 and fumarate hydratase
tran-scripts are present at lower levels in GK than BN (though the subunits of a-ketoglutarate dehydrogenase complex are equivocal). Thus, the combined effect of lysine acetylation and transcript differences increases flux through the TCA cycle, and which should be higher in BN than GK liver.
Our results are consistent with a report showing that flux through Complex II with palmitoylcarnitine substrate is reduced in GK liver, but not in GK muscle [28]. We observe lower Sirt3 transcript abundance with concomitant increased Sdh acetylation in liver, but no change of Sirt3 transcription in muscle.
Studies of liver mitochondrial energetics in GK rats have demonstrated that the GK rat has a low endogenous ATP/ADP ratio [29], which could be the result of reduced flux through the TCA cycle. In the liver mitochondrial proteome, phosphopro-teome and hydroxyprophosphopro-teome of GK rats, [30] suggest that protein expression is coordinated between the TCA cycle, fatty acid oxidation and oxidative phosphorylation during the progression from pre-diabetes to early Type 2 diabetes. Here we show that GK liver protein acetylation provides another layer post-translational control of enzyme activity. It is important to note that acetylation patterns in tissues other than liver are likely to be different [31].
We find that DNA variation in the Sirt3 promoter may contribute to impaired glucose homeostasis in the GK model of type 2 diabetes. Diabetes in the GK rat is a complex, multifactorial disease, caused by susceptibility alleles isolated from an outbred
Figure 4. Lysine acetylation and mRNA expression in components of TCA cycle. Green arrow pointing up (next to malate dehydrogenase) indicates acetylation causes increase in enzyme activity. Red arrow pointing down (next to isocitrate dehydrogenase and succinate dehydrogenase) refers to decrease in enzyme activity with acetylation.
Table 2. Acetyltransferases in the rat liver transcriptome. Symbol Description Illumina microarray RNA-sequencing GK/BN log2 fold-change GK/BN FDR 1Cons/BN log2 fold-change 1Cons/BN FDR GK/BN log2 fold-change GK/BN FDR Pafah1b1 platelet-activating factor acetylhydrolase 1b1 2 1.69 1.54E-09 0.13 0.5895 0 1 Sat2 spermidine/spermine N1-acetyltransferase 2 2 1.39 2.32E-09 2 0.24 0.1951 2 0.51 0.127 Acat3 acetyl-Coenzyme A acetyltransferase 3 2 .00 1.50E-07 2 0.02 0.9640 0.75 0.0044 Phf20 PHD finger protein 2 0 0 .68 1.73E-06 2 0.21 0.1457 2 0.32 0.17198 Nat8 N-acetyltransferase 8 2 .04 3.42E-06 0.62 0.1787 nf* n f Nat1 N-acetyltransferase 1 1 .60 8.05E-06 0.47 0.2360 nf nf Nat2 N-acetyltransferase 2 2 0.58 0.0002 0.07 0.7654 0.35 0.1461 Pafah1b3 platelet-activating factor acetylhydrolase 1b3 0 .61 0.0005 0.14 0.5398 0.21 0.8658 Taf5l TAF5-like RNA polymerase II 2 0.59 0.0005 0.63 0.0076 2 1.07 8.87E-07 Gnpat glyceronephosphate O-acyltransferase 2 0.29 0.0017 2 0.12 0.3442 2 0.29 0.2881 Ncoa1 nuclear receptor coactivator 1 2 0.42 0.0022 2 0.10 0.6087 0.03 0.9711 Gnpnat1 glucosamine-phosphate N-acetyltransferase 1 0 .36 0.0037 0.06 0.7465 0.24 0.2677 Naa20 N(alpha)-acetyltransferas e 2 0 0 .27 0.0039 0.02 0.8875 nf nf Kat2a K(lysine) acetyltransferase 2A 0.42 0.0138 0.09 0.7453 0.48 0.101 Crat carnitine O -acetyltransferase 0.50 0.0305 2 0.06 0.8800 1.06 1.46E-11 Lpcat1 lysophosphatidylcho line acyltransferase 1 0 .06 0.6192 2 0.43 0.0146 2 0.34 0.533 Nat8b N-acetyltransferase 8B 0.14 0.1751 2 0.30 0.0373 2 0.23 0.7107 Lpcat3 Lysophospholipid acyltransferase 5 n f n f n f n f 0 .51 0.0047 Phf15 protein Jade-2 n f n f n f n f 0 .77 0.0043 Shown are transcripts differentially expressed between BN and G K o r 1 consomic strains. False Discovery Rates (FDR) , 0.05 are in bold. doi:10.1371/journal.pone. 0094555.t002
Table 3. Liver deacetylases in the rat liver transcriptome. Symbol Description Illumina microarray RNA-sequencing GK/BN log2 fold-change GK/BN adjusted p-value 1Cons/BN log2 fold-change 1Cons/BN FDR GK/BN log2 fold-change GK/BN FDR Ndst1 N-deacetylase/N-s ulfotransferase 1 0.67 8.26E-05 0.056 0.8228 2 0.04 0.9211 Pigl phosphatidylinositol g lycan anchor biosynthesis L 0.42 0.0001 2 0.214 0.1077 nf* nf Hdac5 histone deacetylase 5 2 0.75 0.0007 0.043 0.9096 0.13 0.6452 Macrod1 MACRO domain containing 1 2 0.49 0.0008 0.286 0.1235 2 0.56 0.0018 Amdhd2 amidohydrolase domain containing 2 2 0.36 0.002 0.033 0.8696 2 0.97 0.0001 Hdac11 histone deacetylase 11 2 0.59 0.0065 2 0.182 0.5643 2 0.52 0.1061 Aadac arylacetamide d eacetylase 0.38 0.0228 0.434 0.0628 2 0.49 0.0737 Hdac3 histone deacetylase 3 2 0.22 0.0345 0.145 0.3341 nf nf Atxn3 ataxin 3 0.2 0.117 0.594 0.0033 0.42 0.0672 Atxn1 ataxin 1 nf nf nf nf 0.93 0.0001 Sirt1 sirtuin 1 0.16 0.3331 2 0.086 0.7452 0.14 0.7643 Sirt2 sirtuin 2 VV V V 2 0.19 0.4863 Sirt3 sirtuin 3 2 0.74 2.66E-06 2 0.928 1.34E-05 2 0.66 0.0008 Sirt4 sirtuin 4 2 0.15 0.1684 0.063 0.7183 2 0.44 0.3751 Sirt5 sirtuin 5 0.12 0.3046 0.077 0.6704 0.1 0.8224 Sirt6 sirtuin 6 0.1 0.2433 0.129 0.2749 0.09 0.8905 Sirt7 sirtuin 7 2 0.08 0.4437 2 0.052 0.7549 0.31 0.3553 Shown are transcripts differentially expressed between BN and G K o r 1 consomic strains. False Discovery Rates (FDR) , 0.05 are in bold (V: Variant in probe). doi:10.1371/journal.pone. 0094555.t003
Wistar stock upon selection of glucose intolerant animals. The polygenic threshold model for complex dichotomous conditions is therefore likely to apply [32]. Under this model, contributing factors accumulate until a threshold is reached, leading to descent into disease. Other rat strains may have reduced Sirt3 deacetylase activity, but are below the threshold required to move into the disease state.
Our data also provide insights into the relationship between glucose intolerance and ageing. Wistar-related rat strains have shorter lifespans than BN rats [33]. Though there is some controversy about the role of sirtuins in ageing, they do mediate metabolic adaptation to stress and changes in nutrition [1] which affect ageing, and higher levels of Sirt3 in BN rat may contribute to its longer lifespan. Furthermore, higher Sirt3 in BN rat liver may contribute to its resistance to the metabolic syndrome. Knockdown of Sirt3 in the BN rat and measurement of its effects on metabolism and longevity, could test this hypothesis.
Materials and Methods Animals
GK, BN and congenic rat strains were provided from our breeding colony at Biomedical Services, University of Oxford. Rats were housed in groups of five per cage, with free access to water and standard laboratory chow pellets (B&K Universal Ltd., Grimston, Aldbrough, Hull) and were maintained on a 12-h light-dark cycle, at a room temperature of 21uC with a relative humidity of 55610%. Tissues were collected from 7–8 month old animals that were fasted overnight and killed by a rising concentration of CO2. The tissue was flash-frozen and stored in a 280uC freezer
until protein or RNA isolation was performed. Records of the breeding colony were kept using a FilemakerPro database [34]. Animal procedures were approved by the ethical review panel of the University of Oxford and UK Home Office project licence PPL 30/2918.
RNA preparation
Liver and brown adipose tissue (BAT) were taken from six each of GK, BN.GK1consomic, and Brown Norway (BN control) male rats and flash-frozen in liquid nitrogen. Tissue samples were similarly taken from male BN.GK congenics derived for different sections of GK rat chromosome 1 (four each of strains BN.GK1b, 1h, 1o) (Figure 1B, right).
Total RNA was isolated from frozen tissues using either the RNeasyH kit (Qiagen, Crawley, UK), or Trizol reagent (Invitrogen Life Technologies, Paisley, UK). Briefly, for RNeasy kit, frozen tissue samples were homogenized in QIAzol Lysis Reagent using a Qiagen TissueLyser. Following phase separation after addition of chloroform, total RNA was purified using a spin technology according to the manufacturer’s guidelines and eluted in RNase-free water. RNA was isolated from some tissues using Trizol reagent according to manufacturer’s protocol. RNA concentra-tions were determined using a NanoDrop spectrophotometer and RNA quality, purity and integrity were assessed using an Agilent 2100 Bioanalyser (Agilent Technologies, Waldbronn, Germany).
Illumina Bead Array hybridization and scanning
Gene transcription profiling for the BN, GK, and chromosome 1 congenic strains was performed using SentrixH BeadChip RatRef-12 v1 Whole-Genome Gene Expression Arrays (Illumina Inc., San Diego, California, USA).
Double-stranded cDNA and purified biotin-labeled cRNA were synthesized from 300 ng high quality total RNA using the IlluminaH TotalPrep RNA Amplification Kit (Ambion Inc.,
Austin, Texas, USA). cRNA concentrations were determined using a NanoDrop spectrophotometer whilst cRNA quality and integrity were assessed using an Agilent 2100 Bioanalyser (Agilent Technologies, Waldbronn, Germany). Hybridizations onto Sen-trixH BeadChip RatRef-12 v1 Arrays were carried out using 750 ng of each biotinylated cRNA in a 58uC hybridization oven for 18 hours. Following washing and staining with Streptavidin-Cy3, the BeadChip Arrays were scanned on the IlluminaH BeadArray Reader (Illumina Inc., San Diego, USA). Resulting data were then preliminarily analysed using the IlluminaH BeadStudio Application software before undergoing comprehen-sive statistical analysis.
Microarray experiments were compliant with MIAME (Mini-mum Information About a Microarray Experiment) and both protocol details and raw data have been deposited in ArrayExpress (http://www.ebi.ac.uk/arrayexpress/) under the accession num-ber E-MTAB-1048.
Statistical analysis of Illumina microarray data and Gene Ontology annotation
Microarray data were imported and normalized using normexp [35]. Batch effects on expression values, as revealed by a principal component analysis, were dealt with by using the array identifier as additive covariant in the linear model. Differentially expressed genes were identified by comparing the 1consomic strain or GK with the BN strain. A linear model was fitted using the software LIMMA. Genes were tested for differential expression using a moderated t-statistic. Multiple testing correction of p-values was carried out using the false discovery rate [36].
Quantitative real-time PCR
Total RNA was treated with Turbo DNA-free DNase kit, for removal of genomic DNA (Ambion Inc., Austin, Texas, USA). First-strand cDNA synthesis was performed using Superscript III First-strand Synthesis Supermix for qRT-PCR (Invitrogen, Pais-ley, UK). Assays were performed on a Rotor-Gene 3000 system (Corbett Research, Milton, UK) using the QuantiTect SYBR Green PCR kit (Qiagen Ltd., Crawley, UK), with PCR primers as listed in Table S1. Analysis was performed using the standard curve method (Rotor-Gene Software 5.0.47; Corbett Research, Milton, UK). Gene expression was normalized against the expression of either actin or acidic ribosomal phosphoprotein P0 (36B4). Experiments were performed in triplicate with samples prepared from 4–6 animals per group. Statistical significance was determined by the two-tailed independent sample t-test or univariate ANOVA, when testing more than two groups.
Sequencing of the Sirt3 gene and promoter cloning
Polymorphism information comparing GK and BN for the region containing Sirt3 and the flanking 59 and 39 sequence was obtained by comparing our genome sequence of the GK rat (Kaisaki, unpublished) with the BN reference sequence. BN-GK SNPs in the region of chr1:201019865-201045697 were submitted for analysis to the online tool at Ensembl, Variant effect predictor (http://www. ensembl.org/info/docs/variation/vep/index.html, [13]).
For cloning, the Sirt3 promoter region (RGSC3.4, chr1:201,043,757-201,044,402) was amplified with the primers Sirt3-promoter-F (59-ACACAAATACCAGGCAGTCG-39) and Sirt3-promoter-R (59-ACCGTTGACAGCTTATCTGC-39) from genomic DNA of either GK or BN rats, using proofreading enzyme Phusion High Fidelity PCR mix (New England Biolabs, Hitchin, UK), and ligated first into PCRII-TOPO vector (Invitrogen, Paisley, UK) with Roche Rapid Ligation kit, and
then subcloned into pGL3-basic Luciferase Reporter vector (Promega, Southampton, UK). Clones were sequenced to confirm there were no PCR errors.
Cell transfection and luciferase assay
HEP3B hepatoma and HEK293T cells were plated in 24-well plates at 2.56104 cells/well, and transfected the next day using Fugene 6, following manufacturer protocols (Roche Molecular Biochemicals, Burgess Hill, UK). Two different concentrations of pGL3-promoter plasmid were transfected, and pCMV-LacZ was co-transfected in all cells (pCMV-LacZ was kindly provided by J. Braganca and S. Bhattacharya). Luciferase activity was measured using Promega Luciferase Assay System (Promega, Southampton, UK), and read on a Labsystems Luminoskan Ascent microplate luminometer (Thermo Fisher Scientific, Loughborough, UK). Activity of b-galactosidase was assayed by measuring cleavage of the substrate o-nitrophenyl-b-D-galactoside (ONPG) [37]. Two to three independent transfection experiments were run, each time in triplicate wells, and results are corrected for transfection efficiency by expressing data as the ratio of luciferase to b-galactosidase activity.
Analysis of acetylated proteome
Protein extraction and trypsin digest. Detection of protein acetylation was previously shown to be more optimal when the enrichment step as performed at the peptide level [31,38]. Liver tissue was homogenised in Lysis buffer, consisting of 50 mM Tris-HCl, pH 7.4, 0.5% NP-40 substitute, 150 mM NaCl, 20 mM MgCl2, 10mM trichostatin A, 10 mM nicotinamide, 50 mM
butyric acid, and protease inhibitor cocktail (Pierce, Cramlington, UK), using a Tissuelyser at 20 mHz for 3 min (Qiagen Ltd., Crawley, UK). Samples were rotated in a cold room for 30 min, sonicated, and centrifuged 13000 rpm for 20 min at 4uC to remove solids. Protein concentration was measured (Pierce BCA protein assay kit, Perbio Science UK, Ltd, Cramlington, UK), and 30 mg of protein from each sample was methanol-chloroform extracted [39]. The pellet was resuspended in 6 M urea in 0.1 M Tris, pH 7.8 by vortexing and sonicating. The proteins were reduced in 10 mM DTT, alkylated with 40 mM iodoacetamide, and reduced again in 40 mM DTT. Urea concentration was reduced to 0.7 M by diluting with water, then trypsin was added in a 1:50 ratio (i.e. 60mg trypsin for 30 mg protein), and incubated at 37uC overnight. Samples were desalted using Sep-pak C18 cartridges (Waters Ltd, Elstree, UK), then evaporated to dryness in a speed-vac.
Immunoprecipitation of acetylated peptides. Pellets were resuspended in RIPA buffer (50 mM Tris, pH 7.4, 150 mM NaCl, 1% NP-40 substitute (Sigma-Aldrich, Gillingham, UK), 0.25% Na-deoxycholate, 1 mM EDTA), then diluted in NET buffer (50 mM Tris, pH 7.4, 5 mM EDTA, 150 mM NaCl). The tryptic peptides were cleared of non-specifically binding peptides by incubating with Protein A-dynabeads (Invitrogen, Paisley, UK). Immunoprecipitation was performed using a mixture of mouse monoclonal and rabbit polyclonal pan-acetyllysine antibodies (NEB Cell Signalling Technology, Hitchin, UK) conjugated to Protein A-dynabeads in NET buffer. Beads were washed three times with NET buffer, transferred to a fresh tube, and eluted twice with ice-cold 100ml elution buffer (100 mM glycine, pH 2.5). Eluates were desalted using Supel-Tips C18 micropipette tips (‘‘zip-tips’’, Sigma-Aldrich, Gillingham, UK), and evaporated to dryness in a speed-vac.
LC-MS/MS Mass-spectrometric analysis. The analysis of digested immunoprecipitated material was performed by LC-MS/ MS using an orbitrap Velos (Thermo) coupled to a nano-UPLC system (NanoAcquity, Waters) using a reversed phase
75mm6250 mm C18 column as described [39]. MS/MS spectra were searched against the NCBInr Rodentia database (v2012.07.08, 18970916 sequences) using the Mascot search engine v2.3.01, allowing two missed cleavage and 20 ppm/ 0.5 Da mass deviations in MS/MSMS, respectively. Carbamido-methylation of cysteine was a fixed modification. Oxidation of methionine, and acetylation of lysine were used as variable modifications. Acetylated peptides were identified on a Mowse score probability based scoring algorithm with a .95% confidence of identification. Acetylated lysine residues were detected as +42.01 Da mass tags and MS/MS spectra required at least four consecutive b or y ions. Representative MS/MS spectra of acetyl-lysine containing peptides are shown in Figure S2, and the peptide scores for each acetylated peptide observed in either the GK or BN samples were compared for an indication of a change in relative abundance (Table S6).
RNA-sequencing
RNA-sequencing was performed according to standard operat-ing procedures by the High-Throughput Genomics Group at the Wellcome Trust Centre for Human Genetics. Briefly, mRNA was selected from the total RNA, then fragmented and converted to cDNA. The cDNA was end-repaired, A-tailed and adapter-ligated before amplification and size selection. The prepared libraries were multiplexed and quality controlled before 51-nt paired end sequencing on an Illumina HiSeq2000 next generation sequencing machine.
Sequencing reads were mapped to the rat reference genome (RGSC3.4, Ensembl release 69) using tophat version 2.0.6 [40]. Bam files were filtered using samtools version 0.1.17 [41], removing alignments with MAPQ ,15. Filtered Bam files were sorted and duplicates were removed using samtools. Differential expression was detected with edgeR [42]. Significant enrichment of KEGG pathways was analysed with goseq [43].
Supporting Information
Figure S1 Luciferase reporter assays for transfection of kidney cell line.
(PDF)
Figure S2 Mass spectrometry based detection of pro-tein lysine acetylation.
(PDF)
Table S1 Variant Effect Predictor for SNPs and indels in the region ofSirt3.
(XLS)
Table S2 RNA-sequencing differentially expressed genes in brown adipose tissue of GK and BN rats. (XLS)
Table S3 RNA-sequencing differentially expressed genes in liver of GK and BN rats.
(XLS)
Table S4 Significant enrichment of KEGG pathways in brown adipose tissue.
(XLSX)
Table S5 Significant enrichment of KEGG pathways in liver.
(XLSX)
Table S6 Acetylated peptides in GK and BN rat liver, and their transcriptional expression.
Acknowledgments
We thank Drs. Nicola Ternette and Roman Fischer for help with the analysis by tandem mass spectrometry. We are grateful to Amelie Baud for advice. We also thank the High-Throughput Genomics Group at the Wellcome Trust Centre for Human Genetics.
Author Contributions
Conceived and designed the experiments: PK BK DG RM. Performed the experiments: PK JFM AT KA HWE CF SC MTB. Analyzed the data: GO BK RM. Wrote the paper: PK BK DG RM.
References
1. Hirschey MD, Shimazu T, Jing E, Grueter CA, Collins AM, et al. (2011) SIRT3 Deficiency and Mitochondrial Protein Hyperacetylation Accelerate the Devel-opment of the Metabolic Syndrome. Mol Cell 44: 177–190.
2. Zhao S, Xu W, Jiang W, Yu W, Lin Y, et al. (2010) Regulation of cellular metabolism by protein lysine acetylation. Science 327: 1000–1004.
3. O’Rourke CM, Davis JA, Saltiel AR, Cornicelli JA (1997) Metabolic effects of troglitazone in the Goto-Kakizaki rat, a non-obese and normolipidemic rodent model of non-insulin-dependent diabetes mellitus. Metabolism 46: 192–198. 4. Gauguier D, Froguel P, Parent V, Bernard C, Bihoreau MT, et al. (1996)
Chromosomal mapping of genetic loci associated with non-insulin dependent diabetes in the GK rat. Nat Genet 12: 38–43.
5. Marion E, Kaisaki PJ, Pouillon V, Gueydan C, Levy JC, et al. (2002) The gene INPPL1, encoding the lipid phosphatase SHIP2, is a candidate for type 2 diabetes in rat and man. Diabetes 51: 2012–2017.
6. Wallis RH, Collins SC, Kaisaki PJ, Argoud K, Wilder SP, et al. (2008) Pathophysiological, genetic and gene expression features of a novel rodent model of the cardio-metabolic syndrome. PLoS One 3: e2962.
7. Cheng ZJ, Vaskonen T, Tikkanen I, Nurminen K, Ruskoaho H, et al. (2001) Endothelial dysfunction and salt-sensitive hypertension in spontaneously diabetic Goto-Kakizaki rats. Hypertension 37: 433–439.
8. Argoud K, Wilder SP, McAteer MA, Bihoreau MT, Ouali F, et al. (2006) Genetic control of plasma lipid levels in a cross derived from normoglycaemic Brown Norway and spontaneously diabetic Goto-Kakizaki rats. Diabetologia 49: 2679–2688.
9. Wilder SP, Kaisaki PJ, Argoud K, Salhan A, Ragoussis J, et al. (2009) Comparative analysis of methods for gene transcription profiling data derived from different microarray technologies in rat and mouse models of diabetes. BMC Genomics 10: 63.
10. Haigis MC, Sinclair DA (2010) Mammalian sirtuins: biological insights and disease relevance. Annu Rev Pathol 5: 253–295.
11. Lombard DB, Pletcher SD, Canto C, Auwerx J (2011) Ageing: longevity hits a roadblock. Nature 477: 410–411.
12. Lombard DB, Alt FW, Cheng HL, Bunkenborg J, Streeper RS, et al. (2007) Mammalian Sir2 homolog SIRT3 regulates global mitochondrial lysine acetylation. Mol Cell Biol 27: 8807–8814.
13. McLaren W, Pritchard B, Rios D, Chen Y, Flicek P, et al. (2010) Deriving the consequences of genomic variants with the Ensembl API and SNP Effect Predictor. Bioinformatics 26: 2069–2070.
14. Bellizzi D, Dato S, Cavalcante P, Covello G, Di Cianni F, et al. (2007) Characterization of a bidirectional promoter shared between two human genes related to aging: SIRT3 and PSMD13. Genomics 89: 143–150.
15. Kong X, Wang R, Xue Y, Liu X, Zhang H, et al. (2010) Sirtuin 3, a new target of PGC-1alpha, plays an important role in the suppression of ROS and mitochondrial biogenesis. PLoS One 5: e11707.
16. Rardin MJ, Newman JC, Held JM, Cusack MP, Sorensen DJ, et al. (2013) Label-free quantitative proteomics of the lysine acetylome in mitochondria identifies substrates of SIRT3 in metabolic pathways. Proc Natl Acad Sci U S A 110: 6601–6606.
17. Chen D, Vollmar M, Rossi MN, Phillips C, Kraehenbuehl R, et al. (2011) Identification of macrodomain proteins as novel O-acetyl-ADP-ribose deacety-lases. J Biol Chem 286: 13261–13271.
18. Guan KL, Xiong Y (2011) Regulation of intermediary metabolism by protein acetylation. Trends Biochem Sci 36: 108–116.
19. Xiong Y, Guan KL (2012) Mechanistic insights into the regulation of metabolic enzymes by acetylation. J Cell Biol 198: 155–164.
20. Finley LW, Haas W, Desquiret-Dumas V, Wallace DC, Procaccio V, et al. (2011) Succinate dehydrogenase is a direct target of sirtuin 3 deacetylase activity. PLoS One 6: e23295.
21. Ahn BH, Kim HS, Song S, Lee IH, Liu J, et al. (2008) A role for the mitochondrial deacetylase Sirt3 in regulating energy homeostasis. Proc Natl Acad Sci U S A 105: 14447–14452.
22. Schlicker C, Gertz M, Papatheodorou P, Kachholz B, Becker CF, et al. (2008) Substrates and regulation mechanisms for the human mitochondrial sirtuins Sirt3 and Sirt5. J Mol Biol 382: 790–801.
23. Qiu X, Brown K, Hirschey MD, Verdin E, Chen D (2010) Calorie restriction reduces oxidative stress by SIRT3-mediated SOD2 activation. Cell Metab 12: 662–667.
24. Sundaresan NR, Gupta M, Kim G, Rajamohan SB, Isbatan A, et al. (2009) Sirt3 blocks the cardiac hypertrophic response by augmenting Foxo3a-dependent antioxidant defense mechanisms in mice. J Clin Invest 119: 2758–2771. 25. Sundaresan NR, Samant SA, Pillai VB, Rajamohan SB, Gupta MP (2008)
SIRT3 is a stress-responsive deacetylase in cardiomyocytes that protects cells from stress-mediated cell death by deacetylation of Ku70. Mol Cell Biol 28: 6384–6401.
26. Pillai VB, Sundaresan NR, Kim G, Gupta M, Rajamohan SB, et al. (2010) Exogenous NAD blocks cardiac hypertrophic response via activation of the SIRT3-LKB1-AMP-activated kinase pathway. J Biol Chem 285: 3133–3144. 27. Cimen H, Han MJ, Yang Y, Tong Q, Koc H, et al. (2010) Regulation of
succinate dehydrogenase activity by SIRT3 in mammalian mitochondria. Biochemistry 49: 304-311.
28. Jorgensen W, Jelnes P, Rud KA, Hansen LL, Grunnet N, et al. (2012) Progression of type 2 diabetes in GK rats affects muscle and liver mitochondria differently: pronounced reduction of complex II flux is observed in liver only. Am J Physiol Endocrinol Metab 303: E515–523.
29. Ferreira FM, Palmeira CM, Seica R, Santos MS (1999) Alterations of liver mitochondrial bioenergetics in diabetic Goto-Kakizaki rats. Metabolism 48: 1115–1119.
30. Deng WJ, Nie S, Dai J, Wu JR, Zeng R (2010) Proteome, phosphoproteome, and hydroxyproteome of liver mitochondria in diabetic rats at early pathogenic stages. Mol Cell Proteomics 9: 100–116.
31. Lundby A, Lage K, Weinert BT, Bekker-Jensen DB, Secher A, et al. (2012) Proteomic analysis of lysine acetylation sites in rat tissues reveals organ specificity and subcellular patterns. Cell Rep 2: 419–431.
32. Strachan T, Read AP (2011) Human Molecular Genetics, 4th edition. New York: Garland Science.
33. Gilad GM, Gilad VH, Tizabi Y (1990) Aging and stress-induced changes in choline and glutamate uptake in hippocampus and septum of two rat strains differing in longevity and reactivity to stressors. Int J Dev Neurosci 8: 709–713. 34. Collins SC, Wallis RH, Wallace K, Bihoreau MT, Gauguier D (2003) Marker-assisted congenic screening (MACS): a database tool for the efficient production and characterization of congenic lines. Mamm Genome 14: 350–356. 35. Ritchie ME, Silver J, Oshlack A, Holmes M, Diyagama D, et al. (2007) A
comparison of background correction methods for two-colour microarrays. Bioinformatics 23: 2700–2707.
36. Benjamini Y, Hochberg Y (1995) Controlling the false discovery rate: a practical and powerful approach to multiple testing. Journal of the Royal Statistical Society Series B (Methodological): 289-300.
37. Braganca J, Swingler T, Marques FI, Jones T, Eloranta JJ, et al. (2002) Human CREB-binding protein/p300-interacting transactivator with ED-rich tail (CITED) 4, a new member of the CITED family, functions as a co-activator for transcription factor AP-2. J Biol Chem 277: 8559–8565.
38. Yang L, Vaitheesvaran B, Hartil K, Robinson AJ, Hoopmann MR, et al. (2011) The fasted/fed mouse metabolic acetylome: N6-acetylation differences suggest acetylation coordinates organ-specific fuel switching. J Proteome Res 10: 4134– 4149.
39. Fischer R, Trudgian DC, Wright C, Thomas G, Bradbury LA, et al. (2012) Discovery of candidate serum proteomic and metabolomic biomarkers in ankylosing spondylitis. Mol Cell Proteomics 11: M111 013904.
40. Trapnell C, Pachter L, Salzberg SL (2009) TopHat: discovering splice junctions with RNA-Seq. Bioinformatics 25: 1105–1111.
41. Li H, Handsaker B, Wysoker A, Fennell T, Ruan J, et al. (2009) The Sequence Alignment/Map format and SAMtools. Bioinformatics 25: 2078–2079. 42. Robinson MD, McCarthy DJ, Smyth GK (2010) edgeR: a Bioconductor
package for differential expression analysis of digital gene expression data. Bioinformatics 26: 139–140.
43. Young MD, Wakefield MJ, Smyth GK, Oshlack A (2010) Gene ontology analysis for RNA-seq: accounting for selection bias. Genome Biol 11: R14.