Involvement of the cysteine-rich head domain in
activation and desensitization of the P2X1 receptor
Éva Lörinczia,1, Yogesh Bhargavab,2, Stephen F. Marinob,c,2,3, Antoine Talyd,2, Karina Kaczmarek-Hájeka, Alonso Barrantes-Freera, Sébastien Dutertree, Thomas Grutterd, Jürgen Rettingerb, and Annette Nickea,c,4
aDepartment of Molecular Biology of Neuronal Signals, Max Planck Institute for Experimental Medicine, 37075 Göttingen, Germany;bDepartment of Biophysical Chemistry, Max Planck Institute for Biophysics, 60438 Frankfurt, Germany;cDepartment of Neurochemistry, Max Planck Institute for Brain Research, 60528 Frankfurt, Germany;dLaboratoire de Biophysicochimie des Récepteurs Canaux, Unité Mixte de Recherche 7199 Faculté de Pharmacie— Université de Strasbourg, 67401 Illkirch, France; andeInstitute for Molecular Bioscience, University of Queensland, Brisbane QLD 4072, Australia Edited by Eric Gouaux, Oregon Health & Science University, Portland, OR, and approved May 18, 2012 (received for review November 28, 2011) P2X receptors (P2XRs) are ligand-gated ion channels activated by
extracellular ATP. Although the crystal structure of the zebrafish P2X4R has been solved, the exact mode of ATP binding and the conformational changes governing channel opening and desensiti-zation remain unknown. Here, we used voltage clampfluorometry to investigate movements in the cysteine-rich head domain of the rat P2X1R (A118-I125) that projects over the proposed ATP binding site. On substitution with cysteine residues, six of these residues (N120–I125) were specifically labeled by tetramethyl-rhodamine-maleimide and showed significant changes in the emission of the fluorescence probe on application of the agonists ATP and benzoyl-benzoyl-ATP. Mutants N120C and G123C showed fastfluorescence decreases with similar kinetics as the current increases. In contrast, mutants P121C and I125C showed slowfluorescence increases that seemed to correlate with the current decline during desensitiza-tion. Mutant E122C showed a slowfluorescence increase and fast decrease with ATP and benzoyl-benzoyl-ATP, respectively. Applica-tion of the competitive antagonist 2 ′,3′-O-(2,4,6-trinitrophenyl)-ATP (TNP-′,3′-O-(2,4,6-trinitrophenyl)-ATP) resulted in large fluorescence changes with the N120C, E122C, and G123C mutants and minor or no changes with the other mutants. Likewise, TNP-ATP–induced changes in control mutants distant from the proposed ATP binding site were compara-bly small or absent. Combined with molecular modeling studies, our data confirm the proposed ATP binding site and provide evidence that ATP orients in its binding site with the ribose moiety facing the solution. We also conclude that P2XR activation and desensitization involve movements of the cysteine-rich head domain.
P
2X receptors (P2XRs) represent a family of nonselective cat-ion channels gated by extracellular ATP. They are widely dis-tributed in mammalian tissues and have been shown to be involved in diverse physiological functions (1). The seven known sub-units all contain two transmembrane domains linked by a large extracellular loop. Functional receptors are homo- or hetero-meric trimers (2, 3).Based on mutagenesis studies, it has been suggested that con-served positively charged and aromatic residues are crucial for ATP binding, presumably by interacting with the negatively charged phosphate chain of ATP (4–6) and its adenine ring (6), respectively. We have previously shown that replacement of two of these residues, K68 and F291, by cysteine residues allows disulfide cross-linking between neighboring P2X1 subunits and that this reaction is prevented in the presence of ATP. Based on these data, we concluded that the ATP binding sites are located at the subunit interfaces (7, 8). This conclusion is in good agreement with the positions of the relevant amino acids in the crystal structure of the unliganded P2X4R from zebrafish (2). This zP2X4 structure re-vealed an ion channel architecture that resembles a dolphin, with the transmembrane helices and the extracellular region forming thefluke and the upper body, respectively. Attached to the body domain, a head domain, a dorsalfin, and right and left flippers have been defined. It was suggested that the ATP binding site is formed by deep intersubunit grooves, which are surrounded by the conserved residues implicated in ATP binding. These residues are provided by the body domain and enclosed by the leftflipper of one subunit and the dorsal fin of the neighboring subunit. The
cysteine-rich head domain of thefirst subunit projects over this binding site (2). Because the zP2X4 crystal was obtained in the absence of ATP, the exact mode of agonist binding is unknown. Likewise, the conformational changes governing channel opening and desensitization remain elusive.
A powerful method for resolving ligand interactions and struc-tural rearrangements accompanying the conformational transitions of channels and transporters is the simultaneous recording of cur-rent responses andfluorescence changes after site-directed fluo-rescence labeling by voltage clampfluorometry (VCF) (9). This method has the potential to detect electrically silent processes, such as antagonist binding or recovery from desensitization. A common structural feature of all vertebrate P2XRs isfive con-served disulfide bridges. Three of these disulfide bridges are arranged in the head domain (2). Twofindings suggest a close association of this region with ATP binding: (i) the P2X7 subtype has been found to be constitutively active on ADP ribosylation of residue R125 located between the first and second conserved cysteine residues (10), and (ii) a recent report has shown that the thiol-reactive ATP analog 8-thiocyano-ATP (NCS-ATP) can be covalently attached to the cysteine-substituted residue N140C in the head domain of the P2X2R (11). To probe the proximity of the first intercysteine region to the presumed ATP binding site and a possible function of the cys-rich region in receptor activation and/or desensitization, we performed VCF with the fast desensi-tizing P2X1R expressed inXenopus oocytes. Our data reveal de-tails about the implication of the cys-rich head domain in ligand binding, channel activation, and desensitization of the P2X1R. Results
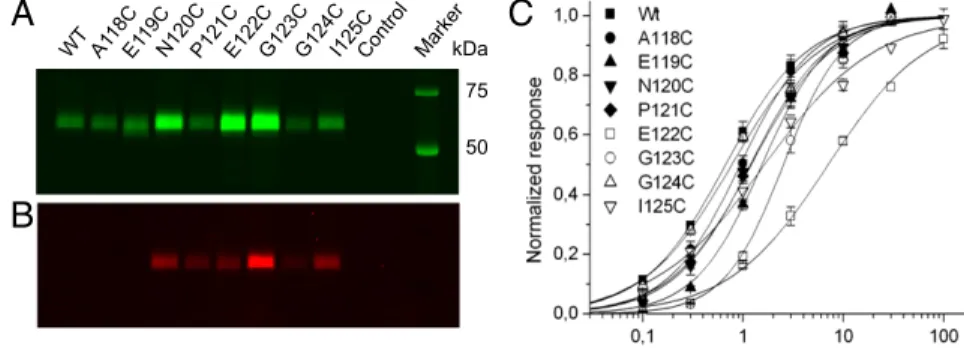
Generation and Assembly of Cysteine-Substituted P2X1 Receptor Mutants.Each of the eight residues in thefirst intercysteine re-gion (positions A118 to I125) was exchanged by a cysteine residue in the hexahistidyl-tagged rat P2X1R. To ensure that the mutant receptors were correctly folded and functional, our mutations were done on the background of the naturally occurring 10 cysteine residues. Because this process bears the risk of receptor misfolding due to unspecific disulfide cross-linking, we first analyzed the effi-ciency of surface expression of each mutant by selective labeling of the resulting plasma membrane receptors with Cy5-conjugated N-hydroxysuccinimide ester (7), which reacts with primary amines at the cell surface. As shown by SDS/PAGE analysis in Fig. 1A,
Author contributions: T.G., J.R., and A.N. designed research; É.L., Y.B., S.F.M., A.T., K.K.-H., A.B.-F., S.D., and A.N. performed research; É.L., S.F.M., A.T., K.K.-H., A.B.-F., S.D., J.R., and A.N. analyzed data; and É.L., J.R., and A.N. wrote the paper.
The authors declare no conflict of interest. This article is a PNAS Direct Submission.
1Present address: Department of Cell Physiology and Pharmacology, University of
Leices-ter, Leicester LE1 9HN, United Kingdom.
2Y.B., S.F.M., and A.T. contributed equally to this work.
3Present address: Department of Crystallography, Max Delbrück Center for Molecular
Medicine, 13125 Berlin, Germany.
4To whom correspondence should be addressed. E-mail: anicke@gwdg.de.
This article contains supporting information online atwww.pnas.org/lookup/suppl/doi:10. 1073/pnas.1118759109/-/DCSupplemental.
all mutants generated uniform receptor populations with expres-sion levels in the plasma membrane that were similar to the levels of the WT receptor or even higher, showing that the introduced cysteine residues did not notably influence receptor folding, as-sembly, or surface transport (Table S1). In addition, two-electrode voltage clamp analysis of the mutants and WT receptors revealed similar EC50values (at most, a 10-fold difference) for ATP, further confirming that the introduced cysteine residues did not severely affect receptor function (Fig. 1C andTable S2).
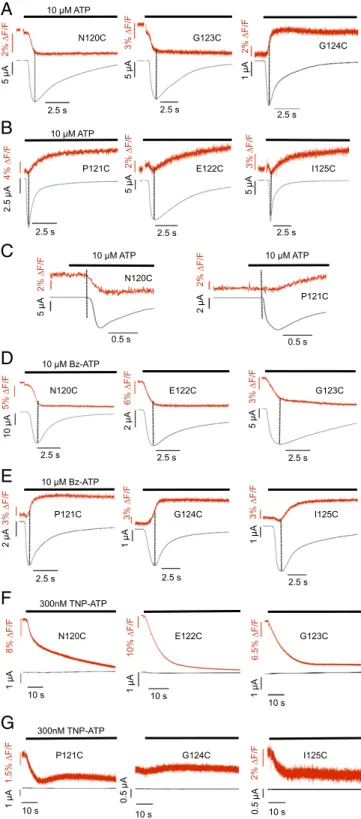
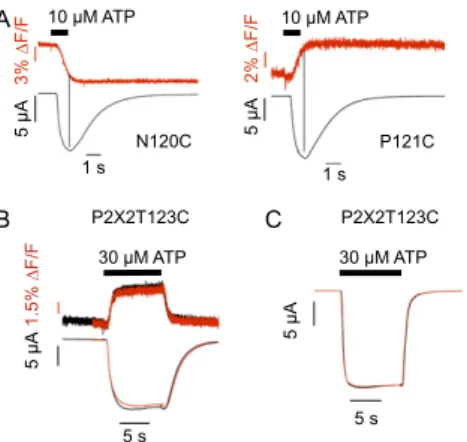
Identification of Tetramethyl-Rhodamine-Maleimide–Accessible Residues in the Cys-Rich Extracellular Domain.We next used VCF to monitor the changes influorescence intensities of single fluorescent probes that are specifically attached to free cysteine residues. To identify residues that are accessible, we incubated all cysteine mutants with the sulfhydryl-reactive fluorescent dye tetramethyl-rhodamine-maleimide (TMRM). As depicted in Fig. 1B, no labeling was ob-served with the WT P2X1R, confirming that all endogenous cys-teine residues are oxidized or buried within the protein (2, 12, 13). In contrast, six of eight cysteine substitutions were specifically la-beled by TMRM. TMRM labeling did not notably change the ATP sensitivity of the mutants (Table S2), indicating that the modifi-cations do not impose any steric hindrance with ATP or residues involved in receptor activation or that theflexible linker allows the required movements. It has to be noted, however, that small changes in binding affinity would not lead to changes in the EC50 value because of the fast and long-lasting desensitization (14). Different Positions in the C1–C2 Intercysteine Stretch Sense Different Changes in Fluorophore Environment. Simultaneous recording of current responses andfluorescence on application of 10 μM ATP showed pronouncedfluorescence changes of between 2.7% and 6.1% upon receptor activation in all labeled mutants (Table S3). Based on their directions and time courses, the fluorescence changes could be divided into three groups. Mutants N120C and G123C showed a decrease influorescence on ATP application, and these fluorescence changes were fast and seemed to be complete when peak currents where reached (Fig. 2A). Mutant G124C showed a fastfluorescence increase (Fig. 2A). Mutants P121C, E122C, and I125C displayed slower ATP-induced fluo-rescence increases that reached a steady state only several sec-onds after the peak current response (Fig. 2B). A small initial fluorescence decrease generally preceded this signal (Fig. S1A, arrows). After the washout of ATP, thefluorescence signals of all mutants did not significantly revert within a recording time of 50 s (Fig. S1), even if only short pulses of ATP were applied (Fig. S2A). This finding is in agreement with both slow unbinding of ATP and an extremely slow recovery from desensitization as previously determined (14). Because bleaching of the fluo-rophore and slow fluorescence run-up/run-down effects biased longer recordings, the reversibility of thefluorescence changes was not further investigated. However, the P2X1 E122C mutant showed a slow reversibility, and the T123C (analogous to I125C in P2X1) mutant of the nondesensitizing P2X2R revealed a completely reversiblefluorescence signal (Fig. S2B), thus arguing against an irreversible effect of TMRM.
Analysis of emission spectra before and after application of ATP revealed superimposable spectra in all mutants, thus ex-cluding that thefluorescence changes were caused by a shift in the TMRM emission spectrum (Fig. S3).
Fluorescence Changes in Mutants N120C and G123C Are Associated with Receptor Activation.To better correlate kinetics of fluores-cence changes observed with receptor activation or desensitiza-tion, we determined the time constants for the current and fluorescence changes (Table S3). With WT and all mutant re-ceptors, activation time constants between 0.1± 0.03 and 1 ± 0.01 s were obtained for the current responses. The respective desensitization kinetics were, in most mutants, best fitted by a biexponential function, with faster and slower time constants ranging from 0.4± 0.1 to 2.3 ± 0.4 s and from 2.9 ± 0.4 to 8.3 ± 1.1 s, respectively. Notably, however, the time constants of the fluorescence changes seen with the N120C, G123C, and G124C mutants were more similar (0.3± 0.1, 0.4 ± 0.04, and 0.3 ± 0.1 s, respectively) to the activation time constants, whereas in case of the P121C, E122C, and I125C mutants, they correlated better with the current desensitization constants. Similar results were obtained when receptors were activated with 10 μM ATP-γS
(Table S3). We conclude from these data that the N120C, G123C,
and G124C mutants report ligand binding and/or conformational changes during channel opening, whereas the other mutants re-port structural rearrangements that are more likely associated with subsequent processes, such as receptor desensitization. In support of this interpretation, current andfluorescence changes start at virtually identical times after ATP application to the N120C, G123C, and G124C mutants, whereas fluorescence changes begin with a 200- to 300-ms delay (compared with the current) in mutants P121C, E122C, and I125C (Fig. 2C). Mutant E122C Specifically Senses Binding of Benzoyl-Benzoyl-ATP.To further support this hypothesis, we repeated the above experi-ments with the partial agonist benzoyl-benzoyl-ATP (Bz-ATP). Bz-ATP has a similar EC50value as ATP but has been shown to induce currents with slower activation times than ATP (15). Here, we found about twofold slower current activation time con-stants for Bz-ATP compared with ATP with the N120C (τATP= 0.2± 0.03 and τBz-ATP= 0.5± 0.04), G123C (τATP= 0.2± 0.02 and τBz-ATP= 0.5± 0.1), and G124C (τATP= 0.3 ± 0.04 and τBz-ATP = 0.5 ± 0.1) mutants (Table S3). Likewise, the time constants of their fluorescence changes were about twofold slower (N120C:τATP= 0.3± 0.1, τBz-ATP= 0.6± 0.04; G123C: τATP= 0.4± 0.04, τBz-ATP= 0.8± 0.2; G124C: τATP= 0.3± 0.1, τBz-ATP= 0.8 ± 0.1), supporting the close association of their fluorescence changes with the channel activation process. Un-expectedly, if activated by Bz-ATP, the fluorescence change of mutant E122C was reversed from a slowly increasing (τ1= 2.4± 0.4,τ2= 19.2± 1.3) to a fast decreasing (τ1 = 0.9 ± 0.2) signal that seemed to be more closely associated with the time course of current activation (Fig. 2B and D). This reversal of fluorescence change was accompanied by a threefold increase in the amplitude of thefluorescence change from 3.9 ± 0.5% on activation with ATP to 12.4± 1.7% with Bz-ATP. The specificity and amplitude
kDa 75 50
A
C
B
Fig. 1. Surface expression, TMRM labeling and functional analysis of cysteine-substituted mutants. The indicated His-P2X1 constructs were expressed in Xenopus oocytes and successively labeled with the (A) amino-reactive fluorescence dye Cy5 (labeling of surface protein) and (B) TMRM. P2X complexes were purified by Ni2+-NTA agarose and separated by SDS/ PAGE. Gels were directly scanned with a fluores-cence scanner. Statistical analysis is inTable S1. (C) Normalized dose–response curves for ATP of WT and single cysteine mutant receptors. Lines represent nonlinear curvefits of the Hill equation to the data (for EC50values and Hill coefficients) (Table S2). Error bars represent SE of 5–11 experiments.
Lörinczi et al. PNAS | July 10, 2012 | vol. 109 | no. 28 | 11397
PHARM
of thisfluorescence change suggest that the TMRM attached to E122C interacts with the Bz moiety of Bz-ATP and thus, at least partially, reports binding of Bz-ATP.
Use of the Competitive Antagonist 2′,3′-O-(2,4,6-trinitrophenyl)-ATP Confirms that Mutants N120C, E122C, and G123C Report Ligand Binding. To further differentiate whether the fluorescence changes were reporting ATP binding or subsequent conforma-tional changes, we made use of the competitive P2X1R antag-onist 2′,3′-O-(2,4,6-trinitrophenyl)-ATP (TNP-ATP) that can be expected to have a similar binding mode as ATP (16). If the agonist-induced fluorescence changes resulted from conforma-tional changes associated with channel opening or desen-sitization, nofluorescence changes would be expected with TNP-ATP, because it does not induce opening. As seen in Fig. 2F, TNP-ATP caused large fluorescence decreases for the N120C (20.3± 2.1%), E122C (43.4 ± 2.5%), and G123C (13.5 ± 1.7%) mutants. Interestingly, the direction and rank order of fluores-cence amplitudes mirrored the direction and rank order of Bz-ATP–induced fluorescence amplitudes for these mutants: E122C (12.4± 1.7%) > N120C (9.6 ± 0.7%) > G123C (5.4 ± 0.6%)
(Table S3). In contrast, mutants P121C (3.7 ± 0.2%), G124C
(0%), and I125C (2.3± 0.3%) showed only comparably small or no TNP-ATP–induced fluorescence changes (Fig. 2G). To test if the large fluorescence changes are caused by a direct TMRM– ligand interaction, we generated Stern–Volmer plots for the ligands and N-acetyl-L-tryptophanamide(NATA), which was used as a model for an amino acid with a strong quenching ef-ficiency (Fig. S4). The obtained quenching efficiencies (ATP < NATA< Bz-ATP < TNP-ATP) correlated with the fluorescence amplitudes of the ligands at the individual mutants, and the higher efficiencies of Bz-ATP and TNP-ATP compared with NATA are in line with a direct interaction between Bz-ATP and TNP-ATP with TMRM. However, the absence of quenching by ATP indicates that fluorescence changes observed with ATP report protein movements rather than direct ligand interaction. Fluorescence Changes in Residues P121C, E122C, and I125C Are Associated with Receptor Desensitization. After opening of the ion channel pore, the P2X1R is believed to undergo conforma-tional changes that lead to the closed desensitized state. Because thefluorescence changes in mutants P121C, E122C, and I125C started when the current response reached its maximum and saturated only clearly after the current peak, we supposed that they were associated with the desensitization process. However, the time constants of desensitization and the respective fluo-rescence changes seemed more complex (Discussion). Never-theless, both were within the same order of magnitude (Table S3). In particular, mutant E122C, which has a 10-fold reduced ATP sensitivity and shows the slowest desensitization of these mutants on application of 10 μM ATP, also has the slowest fluorescence change. As expected, the desensitization, as de-termined by thefluorescence change, became faster if a saturat-ing ATP concentration (100μM) was used (Table S3).
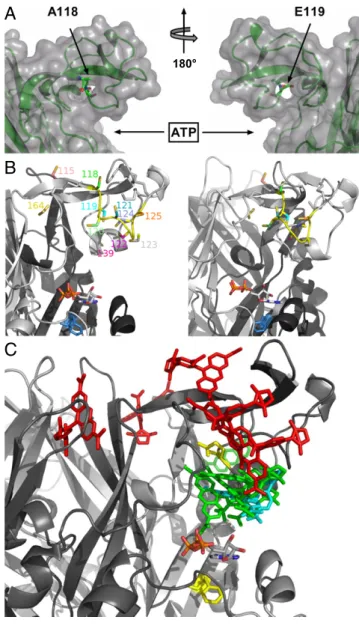
Positions of the Cys Substitutions in a P2X1 Homology Model.The investigated amino acid sequence varies considerably in both length and sequence between the seven P2X subunits. To obtain an idea about the dimensions of the supposed ATP binding site and the distance and orientation of the cys-rich head domain in the P2X1R, we generated homology models for each of the aforementioned P2X1 mutants using the crystal structure of the zP2X4R as a template. In these models, the stretch between C117 and C126 forms a loop that reaches over the ATP binding site and all introduced cysteines except for E119C are predicted to be solvent-accessible (Fig. 3A). In agreement with the exper-imental data, docking of TMRM to the individual cysteine mutants (Fig. 3B and C) revealed at least two poses that should allow the reaction with the side chain for all models except for the solvent-inaccessible E119C mutant and the A118C mutant, in which only one pose was identified. To further interpret our data, we measured the distance between the maleimide moiety of the docked TMRM and residue F188 (homologous to residue L186 in the P2X2R) as a marker for the ATP binding site (11). This measurement takes into account theflexibility of TMRM that should explore a cone in space after beingfixed to the receptor and thus, gives a rough idea of possible interactions of TMRM 10 M ATP 2.5 s 4% F/F 2.5 A 2.5 s 3% F/F 5 A 2.5 s G123C 3% F/F 5 A 2% F/F 1 A 2.5 s
A
B
10 M ATP 10 M Bz-ATP 5% F/F 10 A 2.5 s 6% F/F 2 A 2.5 s 3% F/F 5 A 2.5 s 6.5% F/F 1 A 10 s 10 s 1 A 10% F/F 8% F/F 10 s 1 A 300nM TNP-ATPF
D
3% F/F 2 A 2.5 s 3% F/F 1 A 2.5 s 2.5 s 3% F/F 1 AE
10 M Bz-ATP 10 s 2% F/F 0.5 A 1.5% F/F 1 A 10 sG
0.5 A 10 s 300nM TNP-ATPC
2% F/F 5 A 0.5 s 10 M ATP 2 A 10 M ATP 2% F/F N120C N120C 2.5 s 0.5 s G124C P121C E122C I125C P121C P121C G124C I125C N120C E122C G123C G123C E122C N120C I125C P121C G124C 2.5 s 5 A 2% F/F 5 A 2% F/FFig. 2. Comparison of current traces andfluorescence changes induced by ATP and ATP analogs. TMRM-labeled oocytes expressing the indicated His-P2X1 cysteine mutants were analyzed by VCF at−60 mV. Representative recordings of simultaneous current andfluorescence traces are shown for (A–C) 10 μM ATP, (D and E) 10 μM Bz-ATP, and (F and G) 300 nM TNP-ATP. (C) Representative recordings at an expanded time scale to show the latency between the start of current andfluorescence changes. Dotted lines indicate current peak times or current onset (C).
with the ligands. As seen in Fig. 3C and Table 1, two groups could be differentiated based on the functional and docking data: (i) mutants N120C, E122C, and G123C with a large TNP-ATP–induced fluorescence, fast decreasing signal with Bz-ATP, and distances below 21 Å and (ii) mutants P121C and I125C with small or no TNP-ATP–induced fluorescence changes, slow in-creasing signals with agonists, and distances above 26 Å. In contrast to the good correlation between functional andin silico data found for these mutants, unexpected results were obtained with the G124C mutant. Despite the fact that the 124C residue showed clear TMRM labeling and the model showed convincing poses for TMRM docking in a distance less than 20Å from the F188 residue, no fluorescence changes were observed on TNP-ATP binding (Fig. 2G), suggesting that the residue does not interact with ligands. In contrast to the ATP-induced
fluorescence increases of the P121C and I125C mutants, how-ever, these changes were fast, indicating that they report channel opening.
Additional Validation of the Model and Differentiation of Fluorescence Changes Associated with Ligand Binding, Channel Opening, and Desensitization.Because most investigated residues are close to the ligand binding site, it is difficult to exclude that a change in TMRM fluorescence intensity is caused by or af-fected by quenching of thefluorophore by the ligand. To clearly isolatefluorescence changes associated with protein movements only and further validate our model, we generated three more mutants in or close to the cys-rich domain (Fig. 3). In the W164C mutant, just before the last cysteine in the cys-rich domain, the cysteine residue is predicted to face away from the ATP binding site. In agreement with thisfinding, this mutant showed no sig-nificant signal with TNP-ATP but a slow fluorescence increase with ATP (Fig. 4A andFig. S5). Thus, it most likely reports the desensitization movement of the head domain only. The muta-tion G115C (Fig. 4B) lies two residues before the first cysteine residue of the cys-rich head domain and according to our model, over 30 Å away from residue F188 that is used as marker for the ATP binding site. As expected, it showed nofluorescence change with TNP-ATP. However, it revealed a fastfluorescence increase with ATP and therefore, most likely reports channel opening. A third mutation, R139C, was generated in the middle of the cys-rich domain, being located at a similar distance from residue F188 as the N120C, E122C, and G123C mutations and accord-ingly, produced virtually identical fluorescence changes with TNP-ATP (Fig. 4C) and Bz-ATP (Table S3). In further support of our hypothesis that these fluorescence changes are, at least partly, caused by direct quenching by the ligand, small or no fluorescence changes with TNP-ATP were observed with five of six (L80C, I144C, K221C, S245C, F297C, and N303C) additional control mutants in regions distant from the ligand binding site
(Fig. S6). In the S245C mutant, fluorescence changes of 4.4 ±
0.8% were observed for TNP-ATP. However, this change is clearly smaller than the changes observed for the N120C, E122C, and G123C mutants and suggests movement of this protein do-main during ligand binding.
Discussion
In this study, we used VCF to determine amino acid residues in the fast desensitizing P2X1R that monitor ligand binding and conformational changes during channel opening and desensiti-zation. Based on thefindings summarized in Table 1 and discussed below, we conclude that the cys-rich head domain undergoes substantial movements during P2X1R opening and desensitiza-tion. In addition, we show that the substituents at the ribose moiety of the ATP analogous ligands Bz-ATP and TNP-ATP are specifically detected by TMRM attached to position 122 and thus, provide evidence that this part of the ATP molecule is solvent-accessible rather than buried inside the ATP binding cleft. Finally, our results confirm that the intersubunit pockets seen in the crystal structure indeed represent the ATP binding sites (11, 17). Correlation of Fluorescence Time Courses with Channel Activation and Desensitization.The simplest P2XR activation scheme leads from the resting closed (R) state through the agonist bound closed state (C) and agonist-activated open state (O) to the desensitized closed receptor (D):
ðaÞ ðbÞ ðcÞ
Rþ ATP ↔ CðATPÞ ↔ OðATPÞ ↔ DðATPÞ:
While the current signals indicate the functional states of the re-ceptor (closed/open), changes influorescence can also report elec-trically silent ligand interactions or structural rearrangements in the protein. We propose that different mutants sense conforma-tional changes correlating with distinct transitions (a, b, and c) in the above scheme. The fact that the fluorescence changes in mutants G115C, N120C, G123C, and G124C begin simultaneously with the currents and reach steady state by the time that the cur-rent responses reach their peak values implies that these changes
C
B
A
180°
Fig. 3. Homology and docking models of the P2X1 receptor. (A) Surface representation of the head domain showing the position of the TMRM-in-accessible A118C and E119C residues. (B) Model of the proposed intersubunit ATP binding site showing the TMRM-accessible cysteine-substituted residues. ATP was docked in the proximity of F188 (blue). This constraint was used, because the docking was not robust because of the large binding site. (C) Model of the cys-rich P2X1 head domain with docked TMRM and ATP. TMRM docked to residues that were associated with ligand binding and desensitization are presented in green and red, respectively. TMRM bound to residue 124 is shown in cyan. Residues Q142 and F188 (homologous to P2X2 N140 and L186 identified by affinity labeling) are in yellow.
Lörinczi et al. PNAS | July 10, 2012 | vol. 109 | no. 28 | 11399
PHARM
correlated directly with ligand binding and/or conformational changes induced by ligand binding (induced fit) and/or confor-mational changes during opening of the ion channel pore (a or b). The delayed (compared with the current) and slower changes in mutants P121C and I125C seemed to report subsequent move-ments, most likely desensitization of the receptor (c). The unclear correlation of time constants and in some cases, complex kinetics of thefluorescence changes (e.g., smaller changes in opposite di-rection of the dominant signal that were regularly observed with some of these mutants such as I125C) imply that parallel processes (onset of desensitization while some receptors are still activating, ligand interactions) are reported to different extents. This is also suggested by the shift in the fluorescence time constant of the P121C mutant on shorter ATP application (Fig. S2AandTable S3) and would be expected because of the close distance of the mu-tated loop to the binding site and the highflexibility of the whole loop domain. Additionally, recordings might be compromised by the limited speed of solution exchange in the VCF setup (SI
Materials and Methods) and the fact that more channels are
re-corded electrophysiologically than are imaged (Fig. S2B). How-ever, a clear and reproducible distinction between fast (a and b) and slow responses (c) is possible.
Specificity of Results/Antagonist Data. We used the competitive antagonist TNP-ATP to further discriminate between fluores-cence changes that were caused by ligand-induced fluorophore quenching (a) and conformational changes associated with channel opening (b) and/or desensitization (c). Mutants G115C, P121C, G124C, I125C, and W164C as well as six control mutants showed comparably small (2.3–4.4%) or no fluorescence changes with TNP-ATP. All other mutants revealed large fluorescence decreases (13.5–43.4%) in the following rank order: E122C > R139C> N120C > G123C. These amplitudes are unusually high, which would be expected in the case of a direct interaction be-tween the TMRM and the strongly quenching TNP moiety. In support of this hypothesis, a similar rank order offluorescence
changes and increased fluorescence amplitudes compared with the full agonist ATP (2.7–5.1%) were observed with the partial agonist Bz-ATP (5.4–12.4%), which also carries an aromatic substitution at the ribose moiety and is able to efficiently quench the TMRM fluorescence. Furthermore, the rank order of quenching efficiencies of ligands reflected the amplitudes of the ligand-inducedfluorescence decreases at these mutants (Fig. S4). We, therefore, propose that residues R139C, N120C, E122C, and G123C detect mainly ligand binding (a) in the case of Bz-ATP and TNP-ATP. Because ATP did not quench, thefluorescence changes observed with ATP are caused by protein movements.
We cannot exclude that TNP-ATP also induces conformational changes (e.g., inducedfit) during ligand binding (a). In fact, TNP-ATP caused clearfluorescence changes in mutant S245C that is at least 25 Å away from the supposed ligand binding site, and it has even been shown to act as an agonist at a P2X2 mutant with fa-cilitated channel gating (16). The small fluorescence changes observed with mutants P121C and I125C might also reflect such movements. In contrast, these same mutants and the more distant W164C mutant showed clearfluorescence changes with all ago-nists, thus further showing that they report primarily protein movements and that substantial movements of the head domain occur during channel desensitization. Likewise, the absence of significant TNP-ATP fluorescence changes in the distant G115C mutant and the G124C mutant suggests that no direct interaction with the ligand occurs. These mutants showed fast agonist-in-duced fluorescence changes, indicating that they report move-ments of the head domain associated with channel opening (b). A potential explanation for the unexpected absence of TNP-in-ducedfluorescence change with the G124C mutant could be that the attached TMRM does not experience a shift in the dielectric constant because it interacts with a different part of the ligand or because two parallel effects that cause an increase and a decrease influorescence (e.g., moving away from a quenching residue and towards a quenching residue) occur at the same time. Also, it has to be considered that the distances to the ligand binding site in
C
2% F/F 5 A R139C 10 M ATP 300 nM TNP-ATP 0.2 A 5% F/FA
5% F/F W164C 10 M ATPB
G115C 10 M ATP 0.2 A 300 nM TNP-ATP 0.2 A 2% F/F 1% F/F 3 A 2.5 s 2.5 s 2.5 s 300 nM TNP-ATP 10 s 10 s 10 s 2 AFig. 4. Current traces andfluorescence changes of TMRM-labeled mutants that were rationally planned based on a ho-mology model. Recordings were made on application of ago-nist (10μM ATP) or antagonist (300 nM TNP-ATP). (A) W164C, (B) G115C, and (C) R139C. Dotted lines indicate the current peak times.
Table 1. Summary offluorescence changes and modeling data
115C 120C 121C 122C 123C 124C 125C 139C 164C
ATP ⇑ Fast ⇓ Fast ⇑ Slow ⇑ Slow ⇓ Fast ⇑ Fast ⇑ Slow ⇓ Fast ⇑ Slow
Bz-ATP ⇑ Fast ⇓ Fast ⇑ Slow ⇓ Fast ⇓ Fast ⇑ Fast ⇑ Slow ⇓ Fast ⇑ Slow
TNP-ATP Small Large Small Large Large — Small Large —
Distance (Å) maleimide
To F188 31.7 20 29.3 20.4 17.2 19.6 26.7 20.8 21.7
To K68 28.4 19.6 29.3 21.1 18.8 20.6 27.7 20.9 18.7
Reported process 2 1/2 3 1/3 1/2 2 3 1/2 3
Reported processes refer to (1) ligand binding, (2) channel opening, and (3) desensitization. Small and large responses are below 4% and above 10%, respectively. Note that the distance for W164C is misleading, because the side chain points away from the ligand binding site. Ability to detect ligand binding is dependent on quenching efficiency of the ligand. ⇑ and ⇓ indicate ΔF increase and decrease, respectively.
our homology model were measured from the maleimide moiety, and specific directions of the fluorescent TMR part were not considered. Thus, it is also possible that the tilt of the C124 side chain compared with the neighboring G123 residue is enough to prevent the interaction.
Homology Modeling and Docking of ATP. Our P2X1 homology model is largely supported by the experimental data. Docking studies with ATP have been difficult because of the large dimensions of the cleft supposed to constitute the ATP binding site. The location of ATP in our docking model is supported by thefinding that mutants N120C and R139C, which are located at two ends of the head domain, show almost identicalfluorescence changes both in quality and quantity, suggesting similar inter-actions with the ligands. In support of this model, the cysteine side chains introduced in these mutants are oriented to residue F188, and their distance to this residue is almost identical.
Our data imply an ATP binding mode in which its ribose moiety faces the solution and the head domain. Such an orientation of ATP is compatible with a P2X2 docking model that was de-termined based on the covalent attachment of NCS-ATP to resi-due L186 of the receptor (11). Our model also supports a docking model for Bz-ATP in the human P2X1R binding site, which has been proposed based on substituted cysteine accessibility studies (17) and in which the Bz-Bz moiety faces towards the head domain. However, these models are based on the closed receptor confor-mation. Our results clearly show an agonist-induced movement of the head domain, which we suggest moves down to ATP. This suggestion has also been proposed by two independent reports (18, 19), and was confirmed by the crystal structure of the ATP-bound zP2X4R (20), which were published while this work was under revision. The zP2X4 structure also fully justifies restriction of ATP binding to residue F188 in our P2X1 model. Additional studies are needed to identify the amino acid residues that transmit this move-ment to the transmembrane domains and the specific mechanism causing closure of the channel during desensitization.
Conclusion
In summary, using VCF, we showed that the cys-rich head do-main is involved in both channel activation and desensitization. In addition, we confirmed the proposed localization of the ATP binding site and not only identified additional residues close to the ATP binding site but also determined positions that could specifically differentiate between ATP analogs. Use of this method on receptor subtypes with different pharmacology, pore opening,
and desensitization behavior will help to validate homology and docking models and contribute to elucidation of the channel activation and desensitization process and the determinants of subtype-specific ligand binding.
Materials and Methods
cDNA Constructs and cRNA Synthesis. Construction of the His-tagged rat P2X1R and mutants has been described (3, 7). Capped RNA was synthesized with the SP6 Message Machine kit (Ambion).
Oocyte Injection and Protein Labeling. X. laevis oocytes were prepared and la-beled with Cy5 N-hydroxysuccinimide ester as described (3, 7). For cysteine-specific fluorescence labeling, oocytes were incubated for 15 min in the dark and on ice in 5μM TMRM (Molecular Probes) in ND96. Oocytes were sub-sequently washed and extracted or kept on ice (<1 h) until used for recording. Purification of Hexahistidyl-Tagged Proteins and SDS/PAGE. Protein complexes containing His-tagged P2X subunits were purified from dodecylmaltoside extracts of Xenopus oocyte, separated by SDS/PAGE, and analyzed as de-scribed (3, 7).
Electrophysiological Recordings. Two-electrode voltage clamp recordings at−60 mV were performed as described (7, 14) using a TEC-05 amplifier (NPI Electronics), low passfiltered at 100 Hz, and sampled at 200 Hz. VCF re-cordings were performed principally as described (21) using an Axiovert 200 invertedfluorescence microscope equipped with a 20× Neofluar objective (N.A. = 0.75, working distance = 2 mm) and the BP545/25, FT570, BP605/70 filter set (Carl Zeiss MicroImaging). Fluorescence was recorded with a Hama-matsu SN5973 photodiode and an FDU-2fluorescence detection unit moun-ted to the bottom port (Till Photonics). Data were recorded with CellWorks software (NPI Electronic) and analyzed with Origin 7.5 software (Microcal).
Homology Modeling. Models for each P2X1 mutant were prepared as de-scribed (11) using the program Modeler 9v9 (22) and analyzed for solvent accessibility with the DSSP software (23). Docking was performed with Autodock vina software (24) using a distance below 5 Å between the thiol group and the maleimide moiety and correct side chain orientation as constraints. Figures were prepared with PyMOL (DeLano Scientific LLC). ACKNOWLEDGMENTS. We thank Benjamin Marquez-Klaka for mutagenesis; Anja Arends, Conny Neblung, Eva Harde, Ricarda Härtl, and Annett Sporning for technical assistance; Stephan Pless, Antonios Pantazis, and Alexandre Mourot for helpful discussions; and Heinrich Betz, Ernst Bamberg, and Wal-ter Stühmer for providing support and facilities. This work was supported by Deutsche Forschungsgemeinschaft Grants Re 2711/1-1 (to J.R. and A.N.) and Ni 592/5 (to A.N.).
1. Surprenant A, North RA (2009) Signaling at purinergic P2X receptors. Annu Rev Physiol 71:333–359.
2. Kawate T, Michel JC, Birdsong WT, Gouaux E (2009) Crystal structure of the ATP-gated P2X(4) ion channel in the closed state. Nature 460:592–598.
3. Nicke A, et al. (1998) P2X1 and P2X3 receptors form stable trimers: A novel structural motif of ligand-gated ion channels. EMBO J 17:3016–3028.
4. Ennion SJ, Ritson J, Evans RJ (2001) Conserved negatively charged residues are not required for ATP action at P2X(1) receptors. Biochem Biophys Res Commun 289: 700–704.
5. Jiang LH, Rassendren F, Surprenant A, North RA (2000) Identification of amino acid residues contributing to the ATP-binding site of a purinergic P2X receptor. J Biol Chem 275:34190–34196.
6. Roberts JA, Evans RJ (2004) ATP binding at human P2X1 receptors. Contribution of aromatic and basic amino acids revealed using mutagenesis and partial agonists. J Biol Chem 279:9043–9055.
7. Marquez-Klaka B, Rettinger J, Bhargava Y, Eisele T, Nicke A (2007) Identification of an intersubunit cross-link between substituted cysteine residues located in the putative ATP binding site of the P2X1 receptor. J Neurosci 27:1456–1466.
8. Marquez-Klaka B, Rettinger J, Nicke A (2009) Inter-subunit disulfide cross-linking in homomeric and heteromeric P2X receptors. Eur Biophys J 38:329–338.
9. Pless SA, Lynch JW (2008) Illuminating the structure and function of Cys-loop re-ceptors. Clin Exp Pharmacol Physiol 35:1137–1142.
10. Adriouch S, et al. (2008) ADP-ribosylation at R125 gates the P2X7 ion channel by presenting a covalent ligand to its nucleotide binding site. FASEB J 22:861–869. 11. Jiang R, et al. (2011) Agonist trapped in ATP-binding sites of the P2X2 receptor. Proc
Natl Acad Sci USA 108:9066–9071.
12. Clyne JD, Wang LF, Hume RI (2002) Mutational analysis of the conserved cysteines of the rat P2X2 purinoceptor. J Neurosci 22:3873–3880.
13. Ennion SJ, Evans RJ (2002) Conserved cysteine residues in the extracellular loop of the human P2X(1) receptor form disulfide bonds and are involved in receptor trafficking to the cell surface. Mol Pharmacol 61:303–311.
14. Rettinger J, Schmalzing G (2003) Activation and desensitization of the recombinant P2X1 receptor at nanomolar ATP concentrations. J Gen Physiol 121:451–461. 15. Roberts JA, Evans RJ (2007) Cysteine substitution mutants give structural insight and
identify ATP binding and activation sites at P2X receptors. J Neurosci 27:4072–4082. 16. Cao L, Young MT, Broomhead HE, Fountain SJ, North RA (2007) Thr339-to-serine substitution in rat P2X2 receptor second transmembrane domain causes constitutive opening and indicates a gating role for Lys308. J Neurosci 27:12916–12923. 17. Allsopp RC, El Ajouz S, Schmid R, Evans RJ (2011) Cysteine scanning mutagenesis
(residues Glu52-Gly96) of the human P2X1 receptor for ATP: Mapping agonist binding and channel gating. J Biol Chem 286:29207–29217.
18. Roberts JA, et al. (2012) Agonist binding evokes extensive conformational changes in the extracellular domain of the ATP-gated human P2X1 receptor ion channel. Proc Natl Acad Sci USA 109:4663–4667.
19. Jiang R, et al. (2012) Tightening of the ATP-binding sites induces the opening of P2X receptor channels. EMBO J 31:2134–2143.
20. Hattori M, Gouaux E (2012) Molecular mechanism of ATP binding and ion channel activation in P2X receptors. Nature 485:207–212.
21. Mourot A, Bamberg E, Rettinger J (2008) Agonist- and competitive antagonist-in-duced movement of loop 5 on the alpha subunit of the neuronal alpha4beta4 nic-otinic acetylcholine receptor. J Neurochem 105:413–424.
22. Sali A, Blundell TL (1993) Comparative protein modelling by satisfaction of spatial restraints. J Mol Biol 234:779–815.
23. Kabsch W, Sander C (1983) Dictionary of protein secondary structure: Pattern rec-ognition of hydrogen-bonded and geometrical features. Biopolymers 22:2577–2637. 24. Trott O, Olson AJ (2010) AutoDock Vina: improving the speed and accuracy of docking with a new scoring function, efficient optimization, and multithreading. J Comput Chem 31:455–461.
Lörinczi et al. PNAS | July 10, 2012 | vol. 109 | no. 28 | 11401
PHARM
Supporting Information
Lörinczi et al. 10.1073/pnas.1118759109
SI Materials and Methods
Voltage Clamp Fluorometry Recording Chamber.The oocyte was placed with the animal pole down on a 0.7-mm diameter hole that separates the upper and lower compartments of the recording chamber. The upper compartment allows access of the recording electrodes and was continuously superfused with recording solution. Ligands were applied by a manifold to the lower compartment, which is sealed at the bottom by a glass coverslip. The portion of the oocyte exposed to ligands was totally within the opticalfield of the microscope, and therefore, current and fluorescence could be measured from the same population of receptors.
Speed of Solution Exchange.Our standard two-electrode voltage clamp (TEVC) setup has previously been reported (1). A sub-second solution exchange was determined in the present study at an expressed ether-a-go-go (eag) potassium channel by ex-changing Na+against K+solution at a holding potential of +20 mV (current rise timet10–90%= 0.33 +−0.04 s for a 10–90% change in holding current). A similar rise time of 0.38 +−0.02 ms was measured when activating the P2X2T123C mutant with 30μM ATP, indicating that use of this receptor yields a realistic measure of the speed of solution exchange. Therefore, the P2X2T123C mutant was used to assess the speed of solution exchange in the voltage clampfluorometry (VCF) chamber. As shown by the fluorescence signal in Fig. S2B, the solution ex-change in the lower chamber of the VCF setup is finished in about 1 s (rise timet10–90%= 1.13 + 0.16 s). It has to be noted, however, that the current rise is slower (t10–90%= 1.73 +−0.09 s), and the current decline is prolonged, most likely because of spill over of the ligand into the upper compartment. However, the current rise times observed with our P2X1 mutants are comparable with values determined before (2) for WT and var-ious mutant P2X1 receptors by TEVC on oocytes.
Analysis of VCF Data.Mono- or biexponential functions werefitted to thefluorescent and current traces depending on the quality of the fits. The following formulas were used for increasing and decreasing signals, respectively (Eq.S1):
y¼ y0þ A* expð − ðx − x0Þ=τÞ [S1] or (Eq.S2) y¼ y0þ A1* expð − ðx − x0Þ=τ1Þ þ A2* expð − x − x0Þ=τ2 [S2] and (Eq.S3) y¼ y0þ A* ð1 − expðð − x − x0Þ=τÞÞ [S3] or (Eq.S4) y¼ y0þ A1* ð1 − expðð − x − x0Þ=τ1ÞÞ þ A2* ð1 − expðð − x − x0Þ=τ2ÞÞ: [S4] Determination of Emission Spectra from Tetramethyl-Rhodamine-Maleimide–Labeled Oocytes.Fluorescence measurements were per-formed using a Quanta-Master QM4 spectrofluorometer (PTI).
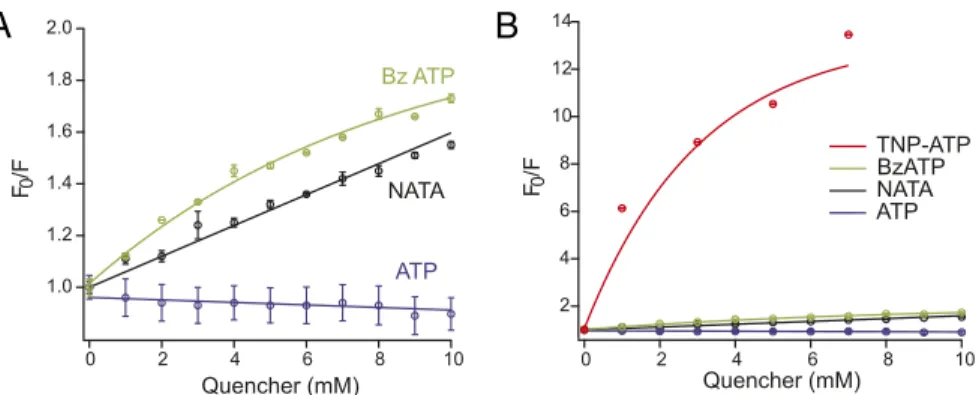
Single tetramethyl-rhodamine-maleimide (TMRM) -labeled and washed oocytes were placed in a 3 × 3-mm quartz cuvettete (Hellma), and theirfluorescence emission spectra were measured in Mg2+Oocyte Ringer before and after application of 10μM ATP or 300 nM 2′,3′-O-(2,4,6-trinitrophenyl)-ATP (TNP-ATP). Sam-ples were excited at 530 nm, and thefluorescence signal intensities were recorded from 540 to 650 nm in 2-nm steps with an in-tegration time of 1 s. Data were acquired with Felix32 software (PTI) and analyzed with Igor Pro (Wavemetrics). Each oocyte was measured three times to account for position-dependent differ-ences in the fluorescence intensities, and experiments were re-peated at least three times for each mutant. Emission spectra (F/Fmax) were normalized to the peakfluorescence intensity at the emission wavelengths above 550 nm (Fmax). A ninth-order polynomial expression wasfitted to the data to allow a better visualization of the emission spectra. In the case of uninjected TMRM-labeled control oocytes, Fmax corresponded to the maximumfluorescent value across the whole emission spectrum. Determination of TMRM Quenching in Solution. The fluorescence quenching of 1μM TMRM in Mg2+oocyte Ringer was measured at the indicated concentrations of N-acetyl-L-tryptophanamide (NATA), benzoyl-benzoyl-ATP (Bz-ATP), or ATP (λem= 573 nm,λex= 530 nm). For TNP-ATP, the parameters were adjusted (λem = 590 nm, λex = 580 nm) to avoid fluorescence bleed through with TNP-ATP. All quenchers were diluted in Mg2+ Oocyte Ringer, and theirfinal concentrations were determined by their absorbance at 280, 259, 261, 408, and 554 nm for NATA, Bz-ATP, ATP, TNP-ATP, and TMRM, respectively (3–7). Stern–Volmer plots were produced by presenting the ratio F0/F as a function of the quencher concentration. An equation of the formF0/F = 1 + Ksv[Q] was fitted to the data, where F0andF are thefluorescence intensities in the absence and presence of the quencher,Ksvis the Stern–Volmer quenching constant, and [Q] is the quencher concentration. For Stern–Volmer plots with a negative deviation from linearity, an exponential function was fitted to the data.
Confocal Microscopy.Fluorescence signals were collected with an LSM 510 Meta laser scanning confocal microscope (Zeiss) using a 20× objective (PlanNeofluar 20×/0.50). Single TMRM-labeled oocytes were placed in a 35-mmμ-dish (Ibidi) in Mg2+Oocyte Ringer solution. TMRM was excited at 543 nm, and the emission was collected at 564–725 nm in 10-nm steps. The images were acquired in line-scanning mode with a four-time line average, a pixel time of 1.04μs, and a pinhole of 10 μm (∼1 Airy unit). To determine the emission spectrum, a region of interest was manually delimited around the oocyte membrane, and the av-erage fluorescence was calculated for each acquisition window and plotted as a function of the emission wavelength. Emission spectra were normalized to the maximumfluorescence (Fmax). A ninth-order polynomial expression wasfitted to the data to allow a better visualization of the emission spectra. Zeiss LSM AIM software v.2.2.0.121 (Zeiss) was used for image acquisition. Postacquisition processing was done with the open source image analysis software FIJI.
1. Rettinger J, Schmalzing G (2003) Activation and desensitization of the recombinant P2X1 receptor at nanomolar ATP concentrations. J Gen Physiol 121:451–461. 2. Roberts JA, Evans RJ (2004) ATP binding at human P2X1 receptors. Contribution of
aromatic and basic amino acids revealed using mutagenesis and partial agonists. J Biol Chem 279:9043–9055.
3. Boehmer PE, Emmerson PT (1992) The RecB subunit of the Escherichia coli RecBCD enzyme couples ATP hydrolysis to DNA unwinding. J Biol Chem 267:4981–4987. 4. Hiratsuka T, Uchida K (1973) Preparation and properties of 2′(or
3′)-O-(2,4,6-trinitrophenyl) adenosine 5′-triphosphate, an analog of adenosine triphosphate. Biochim Biophys Acta 320:635–647.
5. Lemasters JJ, Nieminen AL (1999) Negative contrast imaging of mitochondria by confocal microscopy. Biophys J 77:1747–1750.
6. Mahmood R, Cremo C, Nakamaye KL, Yount RG (1987) The interaction and photolabeling of myosin subfragment 1 with 3′(2′)-O-(4-benzoyl)benzoyladenosine 5′-triphosphate. J Biol Chem 262:14479–14486.
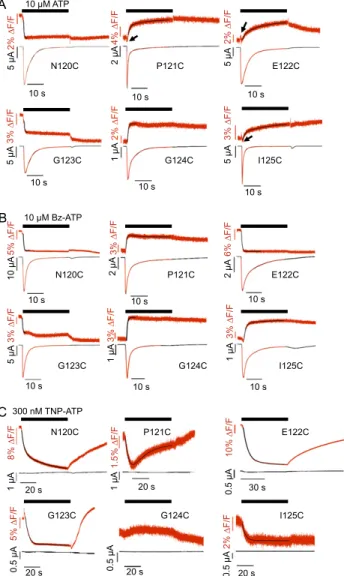
7. Pantazis A, Kohanteb AP, Olcese R (2010) Relative motion of transmembrane segments S0 and S4 during voltage sensor activation in the human BK(Ca) channel. J Gen Physiol 136:645–657. 10 s 10 s 1 A 1 A 0.5 A C 20 s 20 s 2% F/F 0.5 A 20 s 0.5 A G124C 20 s 5% F/F 0.5 A G123C I125C 10 s 10 s 3% F/F 5 A 3% F/F 5 A G123C I125C 2% F/F 1 A 10 s G124C 5% F/F 10 A 10 M Bz-ATP N120C 3% F/F 2 A P121C B 10 s E122C 6% F/F 2 A 2% F/F 5 A 10 s 10 M ATP 10 s 2% F/F 5 A 10 s 4% F/F 2 A N120C P121C E122C A 20 s 8% F/F 300 nM TNP-ATP N120C 1.5% F/F P121C 30 s 10% F/F E122C 3% F/F 10 s 10 s G123C 3% F/F 5 A 1 A G124C 10 s 1 A 3% F/F I125C
Fig. S1. Examples of VCF recordings with (A) 10 μM ATP, (B) 10 μM Bz-ATP, and (C) 300 nM TNP-ATP on an extended time scale. Fits for current and fluorescent traces are shown as red and black lines, respectively. Current traces werefitted with Eq. S1 (receptor activation) and Eq. S4 (receptor desensitization) in the case of ATP and Bz-ATP. Fluorescence traces werefitted with Eq. S1 (fluorescence decrease) or Eq. S4 (fluorescence increase) and Eq. S1 (single exponential) or Eq. S2 (double exponential) in the case of TNP-ATP.
3% F/F 5 A N120C 10 M ATP 1 s 5 A P121C 2% F/F 1 s 10 M ATP A B P2X2T123C 5 s 5 A 30 M ATP C P2X2T123C 30 M ATP 1.5% F/F 5 A 5 s
Fig. S2. Reversibility offluorescence signals and speed of solution exchange. (A) Fluorescence changes in P2X1 receptor mutants N120C and P121C on 1-s ATP (10μM) pulses. In case of the P121C mutant, the fluorescence change became faster and could be fitted with a single exponential function (Table S3), sug-gesting that thefluorescence change in this mutant reflects movements during both opening and desensitization and that the shorter ligand application results in fewer desensitization movements. (B) Recording of a nondesensitizing rP2X2T123C mutant on application of 30 μM ATP in the VCF setup and the conventional TEVC setup (C). To show the reproducibility, two consecutive recordings are shown. Note that the current traces show slightly slower activation and much slower deactivation times than the correspondingfluorescent changes. This finding indicates that spillage of small amounts of agonist in the upper part of the recording chamber activates an additional population of receptors that is not accessible to ourfluorometry measurements and for which the solution exchange is delayed. In the TEVC, setup activation and deactivation are equally fast.
Fig. S3. Analysis of emission spectra of TMRM-labeled oocytes. (A) The normalized emission spectra (F/Fmax) of TMRM-labeled oocytes were measured by spectrophotometry (λex= 530 nm) before (black) and after (red) the application of 10μM ATP (Top and Middle) or 300 nM TNP-ATP (Bottom; n ≥ 3). Uninjected TMRM-labeled oocytes (blue; n = 4) were used as a negative control (Top Left). (B) Representative confocal images of a TMRM-labeled E122C mutant (Upper Left) and uninjected (Lower Left) oocytes to show the specific P2X receptor labeling by TMRM. After application of TNP-ATP, no differences were observed in the normalized emission spectra (F/Fmax) as determined by microscopy. Error bars represent SEM.
A
B
Fig. S4. Comparison of quenching efficiencies of ATP, Bz-ATP, TNP-ATP, and NATA. (A) Stern–Volmer plots showing NATA, Bz-ATP, or ATP quenching of 1 μM TMRM in Oocyte Ringer solution. The emission was measured at 573 nm with a 530 nm excitation. F0and F represent the TMRM fluorescence intensities before and after application of the quencher, respectively. A Stern–Volmer (Ksv) constant of 59.7 M−1was determined for NATA and is in agreement with previously published data (1). No quenching effect was observed for ATP. (B) Same data as in A but on a different scale to include TNP-ATP, which had much stronger quenching effect than both Bz-ATP and NATA in the same concentration ranges. Points represent the means of at least three independent experiments. Error bars represent SEM.
10 M ATP 10 s 2% F/F 5 A R139C 10 s G115C 1% F/F 2 A 10 s 5% F/F 2 A W164C 20 s 20 s 5% F/F 0.2 A 2% F/F 0.2 A 20 s 0.2 A 300 nM TNP-ATP R139C W164C G115C
Fig. S5. Recordings from P2X1 mutants R139C, W164C, and G115C on application of 10μM ATP and 300 nM TNP-ATP on an extended timescale. Current recordings werefitted with Eqs. S1 and S4. Fluorescence traces were fitted with Eqs. S1 (R139C with ATP and TNP-ATP) and S3 (W164C and G115C with ATP). 1. Pantazis A, Kohanteb AP, Olcese R (2010) Relative motion of transmembrane segments S0 and S4 during voltage sensor activation in the human BK(Ca) channel. J Gen Physiol 136:
645–657.
3% F/F 0.5 A N303C 2.5 s 0.5 A N303C 10 s 1 A K221C 0.5 A K221C 2.5 s 10 s 300 nM TNP-ATP 0.2 A L80C 1.5% F/F 10 s 0.8% F/F 1 A I144C 0.2 A I144C 2.5 s 10 s 2% F/F 3 A L80C 10 M ATP 2.5 s kDa 75 50
A C
B
2% F/F 1 A S245C 2.5 s 0.2 A S245C 1.5% F/F 10 s 6±1% (n=10) 4.4±0.8% (n=6) 0.2 A F297C 10 s 2.5 s 1 A F297C 0.75% F/FFig. S6. Control experiments with P2X1 mutants in regions distant from the ligand binding domain (L80C, I144C, K221C, S245C, F297C, and N303C). (A) Position of these mutants in the P2X1 homology model. (B) Accessibility of the introduced cysteine residues as determined by labeling with TMRM and SDS/ PAGE analysis. (C) Recordings from P2X1 mutants on application of 10 μM ATP and 300 nM TNP-ATP. Where applicable, averaged dF/F values are shown. The fluorescence changes in the L80C and S245C mutants suggest movements of these domains during ligand binding. EC50values (determined from three to four oocytes per mutant) ranged between 0.6 and 1.5μM and thus, did not greatly differ from the WT P2X1 receptor.
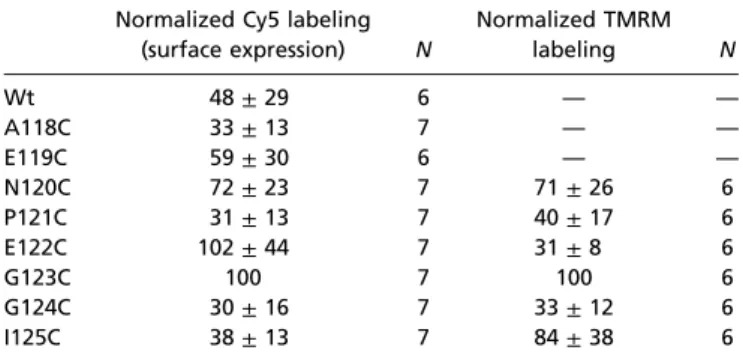
Table S1. Cy5 and TMRM labeling of cysteine-substituted His-P2X1 mutants
Normalized Cy5 labeling (surface expression) N Normalized TMRM labeling N Wt 48± 29 6 — — A118C 33± 13 7 — — E119C 59± 30 6 — — N120C 72± 23 7 71± 26 6 P121C 31± 13 7 40± 17 6 E122C 102± 44 7 31± 8 6 G123C 100 7 100 6 G124C 30± 16 7 33± 12 6 I125C 38± 13 7 84± 38 6
Intact oocytes expressing the indicated mutants were sequentially labeled with amino-reactive Cy5–N-hydroxysuccinimide ester and cysteine-reactive TMRM. Following purification by Ni2+nitrilo-triacetic acid (NTA) agarose, P2X1 protein was separated by SDS/PAGE and quantified by fluorescence scanning. Fluorescence intensities were normalized to the intensities of the G123C mutant, which generally revealed the largest signal for both Cy5 and TMRM.
Table S2. EC50values for ATP and Hill coefficients (n) at WT P2X1
and cysteine-substituted P2X1 mutants without and after labeling by TMRM (n = 4–11)
Mutant EC50(μM) n EC50(μM) + TMRM n + TMRM
WT 0.67± 0.03 1.07 ± 0.04 Not labeled Not labeled A118C 0.94± 0.05 1.12 ± 0.06 Not labeled Not labeled E119C 1.56± 0.23 1.31 ± 0.21 Not labeled Not labeled N120C 1.19± 0.13 1.14 ± 0.11 1.76± 0.08 1.34± 0.06 P121C 1.21± 0.14 1.09 ± 0.11 1.27± 0.19 1.13± 0.16 E122C 7.07± 0.98 0.88 ± 0.07 9.87± 3.4 0.83± 0.13 G123C 2.53± 0.21 1.46 ± 0.14 2.64± 0.16 1.32± 0.08 G124C 0.77± 0.1 0.99± 0.11 0.71± 0.04 1.15± 0.06 I125C 1.64± 0.28 0.79 ± 0.08 0.89± 0.06 1.15± 0.08 115C 1.02± 0.03 1.44 ± 0.05 n.d. n.d. 139C 6.89± 1.33 0.89 ± 0.13 n.d. n.d. 164C 14.06± 4.9 0.63± 0.08 n.d. n.d. n.d., not determined.
Table S3. Agonist- and antagonist-induced current responses and fluorescence changes of TMRM-labeled P2X1R mutants
Agonist I amplitude (μA) ΔF (%) τ Activation (s)
Desensitization (s) τ1/τ2 τ Δ F (s) n G115C ATP −6.5 ± 0.5 2.5± 0.3 0.2± 0.04 0.5± 0.1 0.6± 0.1 7 4.6± 0.3 5.1± 1.2 Bz-ATP −5.9 ± 0.2 2.2± 0.2 0.5± 0.02 0.8± 0.5 0.8± 0.6 8 5.4± 0.5 2.9± 0.1 N120C ATP −14.4 ± 3.4 −5.1 ± 0.4 0.2± 0.03 1± 0.1 0.3± 0.1 17 5.5± 0.5 ATP (1s) −13 ± 2.8 −6.2 ± 1.06 0.3± 0.1 1.6± 0.04 0.53± 0.04 5 ATPγS −13.1 ± 4.5 −3.1 ± 0.5 0.2± 0.02 0.8± 0.1 0.4± 0.1 11 5.3± 0.4 Bz-ATP −18.1 ± 3.2 −9.6 ± 0.7 0.5± 0.04 1.4± 0.3 0.6± 0.04 16 10.1± 1.3 TNP-ATP −20.3 ± 2.1 2.7± 0.2 14 44.4± 2.4 P121C ATP −5.2 ± 1.8 4.2± 0.6 1± 0.01 0.4± 0.1 1± 0.1 17 2.9± 0.4 9.6± 1.2 ATPγS −11.3 ± 5 6.8± 1.3 0.2± 0.02 1.1± 0.3 0.9± 0.1 12 4.4± 0.5 16.4± 1.6 ATP (1s) −13.1 ± 2.3 4.4± 0.7 0.3± 0.1 1.7± 0.2 0.6± 0.1 5 Bz-ATP −8.2 ± 1.7 6.5± 1.4 0.4± 0.06 1.4± 0.3 0.8± 0.1 7 6.8± 0.4 11.7± 2.1 TNP-ATP −3.7 ± 0.2 3.8± 0.7 10 13.2± 1.9 E122C ATP −8.8 ± 2.2 3.9± 0.5 0.2± 0.01 1.4± 0.2 2.4± 0.4 13 8.2± 1.1 19.2± 1.3 100μM −6.7 ± 1.75 5.1± 1.1 0.1± 0.004 1.7± 0.4 1.2± 0.1 4 9.2± 0.9 16.4± 1.9 ATPγS −9.5 ± 4.3 5.6± 0.6 0.2± 0.03 1.8± 0.2 2.6± 0.5 11 9.4± 1.7 17.3± 2.6 Bz-ATP −8 ± 2 −12.4 ± 1.7 0.55± 0.1 1.6± 0,3 0.9± 0.2 10 9.6± 0.7 TNP-ATP −43.4 ± 2.5 4.9± 0.7 9 39.6± 8.1 G123C ATP −19.5 ± 7.02 −2.7 ± 0.3 0.2± 0.02 2.3± 0.4 0.4± 0.04 11 8.3± 1.1 ATPγS −20.4 ± 5.7 −3.2 ± 0.4 0.3± 0.03 1.05± 0.08 0.9± 0.1 10 5.25± 0.3 Bz-ATP −23.1 ± 4.9 −5.4 ± 0.6 0.5± 0.09 1.9± 0.2 0.8± 0.2 8 8.2± 1.6 TNP-ATP −13.5 ± 1.7 4.2± 0.8 7 G124C ATP −5.2 ± 0.6 6± 1.1 0.25± 0.04 0.8± 0.1 0.3± 0.1 7 6.8± 1.5 Bz-ATP −3 ± 0.4 5.7± 1.8 0.5± 0.05 1.4± 0.18 0.8± 0.1 5 6.7± 0.8 I125C ATP −5.1 ± 1.6 6.1± 1.2 0.1± 0.03 0.5± 0.1 1.3± 0.2 9 4.2± 0.4 9.6± 2 ATPγS −4.5 ± 1.6 4.8± 1 0.3± 0.02 0.7± 0.1 1.7± 0.3 9 4.8± 0.4 16± 1.9 Bz-ATP −5.3 ± 1.7 11.55± 1.2 0.2± 0.03 0.8± 0.1 1.2± 0.06 9 12± 2.5 7.1± 0.7 TNP-ATP −2.3 ± 0.3 2.8± 0.4 7
Table S3. Cont.
Agonist I amplitude (μA) ΔF (%) τ Activation (s)
Desensitization (s) τ1/τ2 τ Δ F (s) n R139C ATP −6.3 ± 0.4 −2.8 ± 0.4 0.3± 0.03 0.8± 0.1 0.8± 0.1 7 6.6± 0.4 100μM −8.8 ± 1.1 −4.2 ± 0.2 0.1± 0.01 n.d. 0.18± 0.1 6 Bz-ATP −4.9 ± 0.52 −10.3 ± 2 0.7± 0.1 1.8± 0.2 0.7± 0.1 9 9.2± 0.7 TNP-ATP −25.4 ± 5.3 5± 0.7 9 26.8± 2.7 W164C ATP −4.65 ± 0.9 7.1± 0.7 0.2± 0.02 1.2± 0.02 0.7± 0.04 9 6.5± 0.4 12± 1.1 Bz-ATP −4.54 ± 1.4 6.7± 0.7 0.7± 0.2 1.2± 0.1 0.8± 0.1 5 6.8± 0.4 13.3± 2.8 If not otherwise noted, 10μM ATP, 10 μM ATPγS, 10 μM Bz-ATP, and 300 nM TNP-ATP were applied. n.d., not determined.