Ultrafast Charge Carrier Dynamics in CH
3NH
3PbI
3: Evidence
for Hot Hole Injection into Spiro-OMeTAD
Jan C. Brauera†, Yong Hui Leeb, Mohammad Khaja Nazeeruddinb and Natalie Banerjia
Supporting Information
Transient absorption (TA) spectra were recorded using femtosecond pulsed
pump-probe spectroscopy. The samples were placed into a sealed chamber under nitrogen to prevent degradation by oxygen and humidity. The probe beam consisted of a white light continuum (400-1000 nm), generated by passing part of the 800 nm amplified 1 kHz Ti:sapphire output (Coherent, Astrella) through a 5 mm sapphire plate. The remaining intensity of the fundamental was removed by a 750 nm low pass filter. Excitation pulses at 580 nm or 760 nm were generated in an OPA (OperaSolo, Coherent). To avoid any excitation-intensity effects, the data presented in the manuscript were recorded at low fluence (<2.5 µJ cm-2 and < 6.5 µJ cm-2 for 580 nm and 760/770 nm excitation respectively. The
probe intensity was always less than the pump intensity, and the probe spot size was chosen to be much smaller than the pump spot size to allow for a homogeneous excitation over the probed area. The pump/probe pulses were delayed with respect to each other using a computerized translation stage.
The probe pulses were split before the sample by means of a beamsplitter into a signal (transmitted through the sample and crossed with the pump) and a reference beam. The probe signal and reference beams were then detected separately using a pair of spectrographs (home-built prism spectrometers),
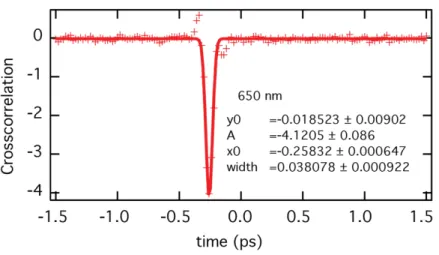
equipped with 512 x 58 pixel back-thinned CCDs (Hamamatsu S07030-0906) and assembled by Entwicklungsbüro Stresing, Berlin. The pump beam was chopped as half the amplifier frequency to improve the sensitivity of the set-up. The transmitted intensity of the probe beam was recorded shot by shot and corrected for laser intensity fluctuations using the reference beam. The transient spectra were averaged at each delay until the desired signal-to-noise ratio was achieved. To avoid polarization effects, the relative polarization of the probe and pump pulses was set to the magic angle. All spectra were corrected for the chirp of the white-light probe. The cross-correlation has been measured on a glass microscope slide to extract the chirp and the IRF. A typical IRF trace is shown in Fig S1.
Figure S1 Typical cross-correlation trace (crosses) and Gaussian fit (solid line)
indicating a time resolution of ~40 fs.
Multi-exponential global analysis. Multi-exponential global analysis serves to
simultaneously analyze the set of dynamics recorded during a white light transient absorption spectroscopy experiment. Dynamics corresponding to many
different probe wavelengths were obtained by taking cross sections through the chirp-corrected TA spectra recorded at about 350 different time delays in the -1 ps to 2 ns range. The interpretation of such dynamics is not trivial, given the complexity of processes occurring in the samples. First, there are often overlapping broad spectral signatures, making assignment of the dynamics at a particular probe wavelength to a unique species or process difficult. Then, the time evolution of the TA signals can be influenced by multiple processes, for example the pure charge transfer dynamics might be entangled with spectral shifts due to relaxation. For all the above reasons, the analysis of a single-wavelength TA dynamics is typically not very meaningful. Therefore, we have opted for global analysis, i.e. for simultaneous analysis of the TA dynamics taken every 5 nm throughout the spectrum. Apart from being more robust to noise-related artifacts encountered at a single wavelength, this method allows for correlating the evolution of different signatures in the TA spectrum, greatly facilitating the interpretation.
Given the complexity of the TA dynamics, it is challenging to devise a kinetic model that accurately and comprehensively describes all the dynamics. Therefore, we have performed data analysis without imposing any specific model to the results, but instead by globally fitting a convolution of a Gaussian and a sum of exponential functions to the dynamics. There is not always a direct physical meaning to using such exponential functions. We also note that a Gaussian distribution of time constants for highly multiphasic processes can crystallize into only a few average exponential time constants. Nevertheless, the multi-exponential analysis allows an excellent overview of the data and allows estimating the time scale on which processes are occurring. Most useful are also
the pre-exponential factors associated with the exponential time constants and obtained at different wavelengths throughout the TA spectrum. The sign of the pre-exponential factor indicates whether the process associated with the time constant leads to a rise or a decay of the TA signal at a given probe wavelength. By plotting the pre-exponential factors as a function of probe wavelength (yielding decay associated amplitude spectra), concerted changes in different parts of the transient spectrum can be identified at one glimpse. This global appreciation of the evolution of several bands consolidates the assignment of the observed dynamics to physical processes.
Additional figures.
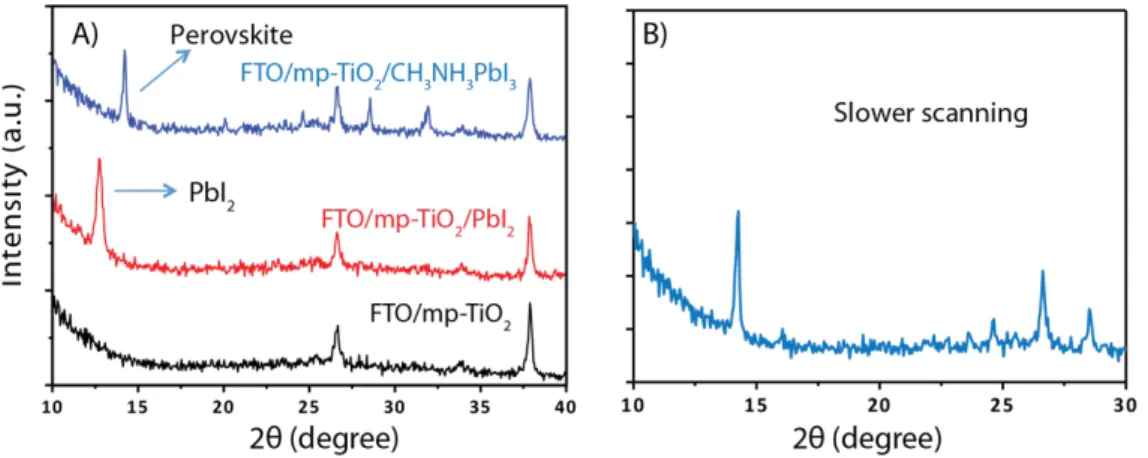
Figure S2 A) XRD spectra of films of FTO/mp-TiO2 (black), FTO/mp-TiO2/PbI2
(red) and FTO/mp-TiO2/CH3NH3PbI3 (blue). B) XRD spectrum of
FTO/mp-TiO2/perovskite recorded at lower scan rate. Within the sensitivity of the experiment,
Figure S3 Absorption spectrum of a FTO/meso-TiO2/CH3NH3PbI3 sample and a
FTO/meso-TiO2/CH3NH3PbI3/Spiro-OMeTAD sample. In the absorption
spectrum, no shift of the shoulder at 480-500nm is observed. The absorption feature of neutral Spiro-OMeTAD can be seen for wavelengths shorter than 450 nm.
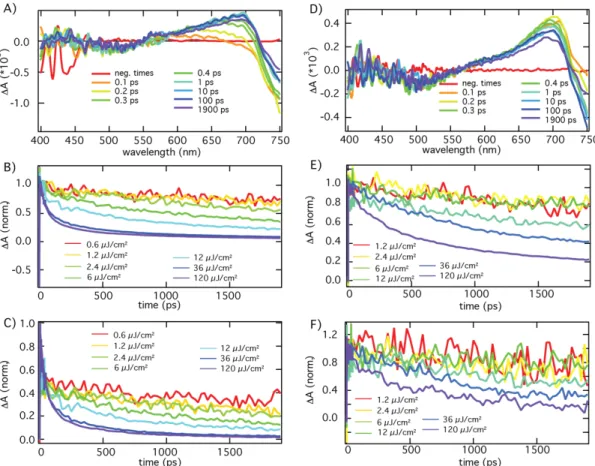
Figure S4 A) Transient spectra of a FTO/mp-TiO2/CH3NH3PbI3 sample upon
excitation at 580 nm with a fluence of 0.6 µJ/cm2. B) and C) Dynamics recorded at
650 and 740 nm respectively for different excitation fluences (excitation at 580 nm). D) Transient spectra of a FTO/mp-TiO2/CH3NH3PbI3 sample upon excitation at 770
nm with a fluence of 1.2 µJ/cm2. E) and F) Dynamics recorded at 650 and 740 nm
respectively for different excitation fluences (excitation at 770 nm). Bimolecular recombination becomes visible for fluences > 2.4µJ/cm2.
Figure S5 A) Transient spectra of a FTO/mp-TiO2/CH3NH3PbI3 sample upon
excitation at 580 nm with a fluence of 2.4 µJ/cm2 B) Dynamics recorded at 1050
nm (excitation at 770 nm).
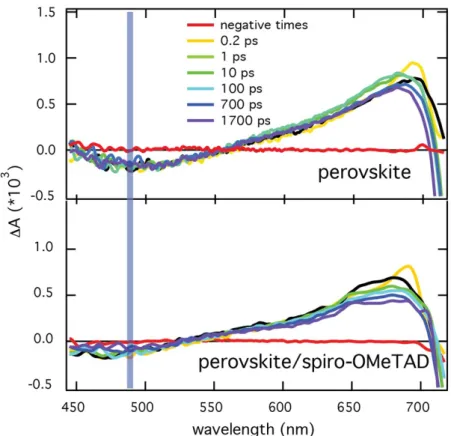
Figure S6 Transient spectra at various time delays after excitation at 760 nm for
FTO/mp-TiO2/CH3NH3PbI3 (upper panel) and FTO/mp-TiO2/CH3NH3PbI3
/Spiro-OMeTAD (lower panel). The shift of the bleaching at < 500 nm is apparent from the very early times indicating hole transfer on a sub-80 fs time scale for band gap resonant excitation. At early times (0.2 ps) the signature of excitons is visible for the samples with and without HTM.