EUROPEAN ORGANISATION FOR NUCLEAR RESEARCH (CERN)
Eur. Phys. J. C 79 (2019) 760
DOI:10.1140/epjc/s10052-019-7199-0
CERN-EP-2019-053 14th November 2019
Measurement of the cross-section and charge
asymmetry of W bosons produced in proton–proton
collisions at
√
s
= 8 TeV with the ATLAS detector
The ATLAS Collaboration
This paper presents measurements of the W+→µ+ν and W−→µ−ν cross-sections and the associated charge asymmetry as a function of the absolute pseudorapidity of the decay muon. The data were collected in proton–proton collisions at a centre-of-mass energy of 8 TeV with the ATLAS experiment at the LHC and correspond to a total integrated luminosity of 20.2 fb−1. The precision of the cross-section measurements varies between 0.8% to 1.5% as a function of the pseudorapidity, excluding the 1.9% uncertainty on the integrated luminosity. The charge asymmetry is measured with an uncertainty between 0.002 and 0.003. The results are compared with predictions based on next-to-next-to-leading-order calculations with various parton distribution functions and have the sensitivity to discriminate between them.
c
2019 CERN for the benefit of the ATLAS Collaboration.
Reproduction of this article or parts of it is allowed as specified in the CC-BY-4.0 license.
1 Introduction
Measurements of the W+and W−boson cross-sections in hadron collisions are a sensitive probe of quantum chromodynamics (QCD). High-precision predictions at next-to-next-to-leading-order (NNLO) accuracy in QCD are available to compare with data. Of particular interest is the ability of such measurements to discriminate between different parton distribution functions (PDFs) [1–7], because the W boson rapidity1 y is strongly correlated with the initial-state parton momentum fractions x. In high-energy proton–proton collisions, the main production mechanism of single W bosons is a valence quark annihilating with a sea antiquark. The W bosons are preferentially produced with a boost in the direction of the incoming valence quark, as the quark is more likely to be at a higher x than the corresponding antiquark. Since the PDFs of u and d quarks in the proton differ (largely due to there being two valence u quarks and one valence d quark), there is a production asymmetry between W+and W−bosons (referred to in this paper as the W boson charge asymmetry), which also varies as a function of rapidity. The boson rapidity cannot be determined unambiguously in leptonic decays of the W boson because the decay neutrino passes through the detector unobserved. The charge asymmetry can instead be measured as a function of the decay lepton’s pseudorapidity η`, which is strongly correlated with the W boson rapidity.
The W boson charge asymmetry was measured in proton–antiproton collisions by the CDF and D0 collaborations [8–10]. It was also measured, along with the individual cross-sections, in proton–proton collisions at the LHC by the ATLAS Collaboration at centre-of-mass energies of √s= 5 TeV [11] and 7 TeV [2], by the CMS Collaboration at √s= 7 and 8 TeV [12–14], and by the LHCb Collaboration at √s = 7 and 8 TeV [15–17].
This paper presents measurements of the integrated fiducial cross-sections for W+→µ+ν and W−→µ−¯ν, as well as the differential cross-sections, dσWµ+/dηµ and dσWµ−/dηµ, as a function of |ηµ|, where ηµ is the pseudorapidity of the decay muon. The data used were collected in proton–proton collisions at a centre-of-mass energy of √s= 8 TeV with the ATLAS experiment at the LHC and correspond to a total integrated luminosity of 20.2 fb−1[18]. The muon decay channel (W → µν) is particularly well suited for this measurement due to good lepton identification and small contributions from background processes. In addition, a measurement of the W boson charge asymmetry Aµis presented, also as a function of |ηµ|. The asymmetry is defined in terms of the W+and W−differential cross-sections as
Aµ =
dσWµ+/dηµ− dσWµ−/dηµ dσWµ+/dηµ+ dσWµ−/dηµ
. (1)
The measurements are performed in a fiducial phase space, which is defined by the kinematics and geometrical acceptance of the muon. All measurements are compared with predictions from a calculation performed at NNLO accuracy using the DYNNLO program [19]. The DYNNLO predictions are produced with six different PDF sets.
1ATLAS uses a right-handed coordinate system with its origin at the nominal interaction point in the centre of the detector and
the z-axis coinciding with the axis of the beam pipe. The x-axis points from the interaction point to the centre of the LHC ring, and the y-axis points upward. Polar coordinates (r, φ) are used in the transverse plane, φ being the azimuthal angle around the beam pipe. The pseudorapidity is defined in terms of the polar angle θ as η= − ln tan(θ/2). The rapidity y of a system is defined in terms of its energy E and its longitudinal momentum pzas y= (1/2) ln[(E + pz)/(E − pz)]. Angular separations
2 The ATLAS detector
The ATLAS detector [20] at the LHC covers nearly the entire solid angle around the collision point. It consists of an inner tracking detector (ID) surrounded by a thin superconducting solenoid, electromagnetic and hadronic calorimeters, and a muon spectrometer (MS) incorporating three large superconducting toroid magnets. The ID is immersed in a 2 T axial magnetic field and provides charged-particle tracking in the range |η| < 2.5. A high-granularity silicon pixel detector typically provides three measurements per track and is followed by a silicon microstrip tracker, which usually provides four three-dimensional measurement points per track. These silicon detectors are complemented by a transition radiation tracker, which enables radially extended track reconstruction up to |η|= 2.0.
The calorimeter system covers the pseudorapidity range |η| < 4.9. Electromagnetic calorimetry is provided by barrel and endcap high-granularity lead/liquid-argon (LAr) sampling calorimeters in the |η| < 3.2 region. A thin LAr presampler, covering |η| < 1.8, corrects for energy loss in the material upstream of the calorimeters. Hadronic calorimetry is provided in the |η| < 1.7 region by the steel/scintillator tile calorimeter, segmented into three barrel structures, and in the endcap region by two copper/LAr calorimeters. The forward regions 3.1 < |η| < 4.9 are covered by copper/LAr and tungsten/LAr calorimeter modules optimised for electromagnetic and hadronic measurements, respectively.
The MS has separate trigger and precision tracking chambers measuring the deflection of muons in a magnetic field generated by superconducting air-core toroids. The precision chamber system covers the region |η| < 2.7 with three layers of monitored drift tubes, complemented by cathode-strip chambers in the forward regions 2.0 < |η| < 2.7, where the background is highest. There is a transition between the barrel and endcap muon detectors around |η|= 1.05. The muon trigger system covers the range of |η| < 2.4 with resistive-plate chambers in the barrel and thin-gap chambers in the endcap regions.
A three-level trigger system [21,22] selected candidate events in 2012. The level-1 trigger was implemented in hardware and used a subset of detector information to reduce the event rate to a design value of at most 75 kHz. This was followed by two software-based trigger levels which together reduced the event rate to about 400 Hz.
3 Analysis methodology
3.1 Description of the measurements
The integrated cross-sections for W+→µ+ν and W−→µ−¯ν production are measured in a fiducial phase space defined at the particle level by requiring the muon transverse momentum pµTto be greater than 25 GeV and the neutrino transverse momentum pνTto be greater than 25 GeV. The absolute muon pseudorapidity is required to be less than 2.4. The W boson transverse mass is
mT = q
2pµTpνT(1 − cos (φµ−φν)), (2)
where φµ and φν are the azimuthal angles of the muon and neutrino, respectively. For this analysis, mT must be at least 40 GeV, both at reconstruction and particle level. The requirements on fiducial quantities are defined before the emission of final-state photon radiation (i.e. at the ‘Born level’).
The differential cross-sections and charge asymmetry are measured in the same fiducial phase space as for the integrated measurement. These are measured in 11 bins of absolute muon pseudorapidity between 0 and 2.4 with bin edges at 0, 0.21, 0.42, 0.63, 0.84, 1.05, 1.37, 1.52, 1.74, 1.95, 2.18, and 2.4. The bin edges are identical to those used in the ATLAS 7 TeV measurement [2].
3.2 Data and simulated event samples
The data for this analysis comprise the entire ATLAS √s = 8 TeV data set recorded between April and December 2012, corresponding to an integrated luminosity of 20.2 fb−1. The average number of proton–proton interactions per bunch crossing hµi was 20.7. Only events recorded with stable beams and the detector operating well are selected. The relative uncertainty of the LHC proton beam energy of ±0.1% [23] has no significant effect on the results.
Events from Monte Carlo (MC) simulations, including simulation of the ATLAS detector, are used for the background estimation and to correct the measured data for detector acceptance, efficiency, and resolution effects.
The W → µν signal process was simulated using Powheg-Box [24,25] at next-to-leading order (NLO) in perturbative QCD using the CT10 set of PDFs [26] and interfaced to Pythia 8.170 [27] with the AU2 set of tuned parameters [28] to simulate the parton shower, hadronisation, and underlying event and to Photos [29] to simulate final-state photon radiation (FSR). This is referred to as Powheg+Pythia8 in this paper. An alternative signal sample was simulated using NLO Sherpa 1.4 [30] and the CT10 PDF set to cross-check the results obtained using Powheg+Pythia8 and to evaluate systematic uncertainties in the signal modelling.
Powheg+Pythia8 with the CT10 PDF set was used to simulate the background processes W → τν and Z → µµ (with the AU2 tune set) and Powheg+Pythia6 [31,32] also with the CT10 PDF set was used to simulate the t¯t process (with the P2011C tune set [33]). The Z → ττ process was simulated using Alpgen [34] with the CTEQ6L1 PDF set [35] interfaced to Herwig [36] to simulate the parton shower and Jimmy [37] to model the underlying event. The single-top process in the s-channel and Wt-channels was simulated with MC@NLO [38] interfaced to Jimmy. The t-channel was generated with AcerMC [39] interfaced to Pythia. The backgrounds from the diboson processes WW, WZ, and ZZ were simulated using Herwig at leading order with the CTEQ6L1 PDF set. In all cases, the Geant4 [40] program was used to simulate the passage of particles through the ATLAS detector [41]. The multijet background is estimated using a data-driven technique, described in Section3.4. A b¯b → µX MC sample, simulated using Pythia8 with the AU2 tune set, is used to cross-check the data-driven estimation.
Differences in reconstruction, trigger, and isolation efficiencies for muons between MC simulations and data are evaluated using a tag-and-probe method [42] and are corrected by reweighting the MC simulated events. The muon reconstruction efficiencies are parameterised versus η and φ, the muon isolation efficiencies versus η and transverse momentum pT, and the muon trigger efficiencies versus η, φ, and pT. The reconstruction, trigger and isolation efficiencies are evaluated separately for positive and negative muons. This separate evaluation is particularly necessary in the case of the trigger efficiencies, which differ by up to 3% (depending on η) between positive and negative muons, much greater than the total uncertainty in the cross-section from other sources. Corrections are also applied to MC events for the description of the muon momentum scales and resolution, which are determined from fits to the observed mass distributions of Z → µµ candidates in data and MC simulations [42]. To correct for charge-dependent biases of the muon momentum scale due to residual misalignments in the ID and MS, an additional momentum-dependent
correction parameterised versus η and φ is applied. An associated uncertainty corresponding to the full size of the correction is included.
All simulated samples are normalised using their respective inclusive cross-sections at higher orders in perturbative QCD. The W and Z predictions are scaled to the NNLO calculation obtained with DYNNLO v1.5 [19, 43] and the MSTW2008 PDF set [44]. The production of top quarks is normalised using the prediction at NNLO+NNLL precision from the Top++2.0 program for t¯t [45–51], to the calculations in Refs. [52–54] for single top quarks, and for diboson production to the NLO calculations following the procedure described in Ref. [55].
The effect of multiple interactions per bunch crossing (pile-up) is simulated by overlaying minimum-bias MC events generated with Pythia8 (with the A2 tune set) [56]. The simulated event samples are reweighted to describe the distribution of the number of pile-up events in the data. The MC simulations are also reweighted to better describe the distribution of the longitudinal position of the primary proton–proton collision vertex [57] in data.
3.3 Event selection
Candidate W → µν events are selected with the requirement that at least one of two single-muon triggers are satisfied. A high-threshold trigger requires muons to have pT > 36 GeV, whilst a low-threshold trigger requires pT> 24 GeV alongside the requirement that the muon must be isolated from additional nearby tracks.
Muon candidates are reconstructed by combining tracks measured in both the ID and the MS [42]. The pTof the ID track is required to be greater than 25 GeV and the absolute pseudorapidity to be less than 2.4. Track quality requirements are imposed for muon identification and background suppression. The transverse impact parameter significance is required to be less than 3 to ensure that the muon candidates originate from a primary proton–proton interaction vertex. The muon candidates are also required to be isolated, satisfying Iµ< 0.1, where Iµ is the scalar sum of the pTof tracks within a cone of size∆R = 0.4 around the muon (excluding the muon track) divided by the pTof the muon. Events are required to contain exactly one muon candidate satisfying the above criteria.
To reduce background contamination, in particular from multijet processes, events are required to have missing transverse momentum EmissT greater than 25 GeV. The EmissT is reconstructed using energy depositions in the calorimeters and tracks reconstructed in the inner detector and muon spectrometer [58]. It is defined as the absolute value of the negative of the vectorial sum of the transverse momenta of reconstructed objects (e.g. electrons, muons, jets) and tracks not associated with these objects. These are labelled the hard and soft terms, respectively.
The W boson transverse mass mTis required to be larger than 40 GeV. This variable is defined analogously to Eq. (2) with pνTreplaced by EmissT and φν replaced by the azimuthal angle related to the ETmiss.
3.4 Estimation of backgrounds
The backgrounds from all sources other than multijet processes are estimated using the MC samples detailed in Section3.2. The Z → µµ process with one of the muons not identified contributes between 1% and 8% of selected data events, depending on the value of |ηµ|. This is the largest background for |ηµ| & 1.4. The contribution from W → τν where the τ-lepton decays into a muon is 2% of the selected
data events and approximately constant as a function of |ηµ|. The backgrounds from Z → ττ, t¯t, and the diboson processes WW, WZ, and ZZ each amount to less than 0.3% of the selected data.
Multijet processes contribute between 2% and 4% of the selected data and are the largest sources of background for |ηµ| . 1.4. The number and properties of the background events arising from multijet processes are estimated using a data-driven template-fit technique, similar to that used in Ref. [59]. A multijet-dominated sample is obtained from data by selecting events passing the nominal selection except that the muon fails the isolation criterion. For this purpose, events satisfying a trigger without an isolation requirement are used. Multijet templates are constructed from this sample, in a series of mutually exclusive slices in muon isolation, for each distribution of interest. The residual contribution from signal and other background sources, estimated from MC simulations, is subtracted. The normalisations of the multijet templates in the signal region are obtained by fitting the templates to data in three discriminating variables: ETmiss, mT, and the ratio pµT/mT. The fits are performed in two phase-space regions (fitting regions) in which the selections on EmissT and mTare relaxed in order to enrich the multijet background contribution. A requirement that the W transverse momentum be less than 30 GeV is introduced in one fitting region to remove a region poorly modelled by signal MC simulations. The normalisation of the multijet template is allowed to float in each of the fits and the total MC-based signal plus background is kept constant. The multijet normalisation in the signal selection is extracted using each discriminating variable in both fitting regions (a total of six estimates). It is assumed that the normalisations of the templates in the fitting regions are the same as for the signal selection. The fits described above are performed for each muon-isolation slice (i.e. six fits per slice). The normalisation estimate extracted in each muon-isolation slice (for a particular discriminating variable and fitting region) is used to linearly extrapolate to an isolation value of 0.05, which is the average isolation of multijet events in the signal region as estimated using the b¯b → µX MC simulation.
The central value of the multijet background is chosen to be the average of the extrapolated curves at Iµ = 0.05, and the spread gives one component of the systematic uncertainty, which is estimated to be bin-to-bin correlated and 50% charge correlated. This uncertainty component includes the effects from the choice of the discriminating variable and the definition of the fitting regions. Another component arises from the effect of the cross-section uncertainty on the signal simulation contribution in the fitting regions (±5%). The fit is repeated varying this and the deviation from the nominal normalisation is taken as an uncertainty, which is again treated as being charge and bin-to-bin correlated. The fit also has a statistical uncertainty, which is treated as being uncorrelated between charges and bins. This is largely due to the limited number of data events for the multijet templates passing the signal selection in each muon-isolation slice. The size of the multijet systematic uncertainty is reported in Section4. The above procedure is performed separately in each bin of muon pseudorapidity. A summary of the most important backgrounds including systematic uncertainties is given in Table1.
Figure1shows the muon η, muon pT, and W transverse mass distributions of selected events with positive muons (left) and with negative muons (right). The data are compared with the sum of MC and data-based estimates for the signal and the backgrounds. The predictions are normalised to the luminosity of the data, after first normalising each MC cross-section to a corresponding higher-order prediction. A normalisation shift between data and MC simulations of approximately 1% is observed for the positive muon plots. This is covered by the uncertainty in the MC signal prediction due to the cross-section uncertainty. Otherwise, the combined prediction describes the data well and within the uncertainties.
µ η -2 -1.5 -1 -0.5 0 0.5 1 1.5 2 η∆ Events / 2 4 6 8 10 12 14 16 18 20 22 6 10 × Data multi-jet ν µ → W W →τν µ µ → Z Other ATLAS -1 = 8 TeV, 20.2 fb s + µ µ η -2 -1.5 -1 -0.5 0 0.5 1 1.5 2 η∆ Events / 2 4 6 8 10 12 14 16 6 10 × Data multi-jet ν µ → W W →τν µ µ → Z Other ATLAS -1 = 8 TeV, 20.2 fb s − µ [GeV] µ T, p 30 40 50 60 70 80 Events / GeV 1000 2000 3000 4000 5000 3 10 × Data multi-jet ν µ → W W →τν µ µ → Z Other ATLAS -1 = 8 TeV, 20.2 fb s + µ [GeV] µ T, p 30 40 50 60 70 80 Events / GeV 500 1000 1500 2000 2500 3000 3500 3 10 × Data multi-jet ν µ → W W →τν µ µ → Z Other ATLAS -1 = 8 TeV, 20.2 fb s − µ [GeV] T, W m 40 50 60 70 80 90 100 110 120 Events / GeV 500 1000 1500 2000 2500 3 10 × Data multi-jet ν µ → W W →τν µ µ → Z Other ATLAS -1 = 8 TeV, 20.2 fb s + µ [GeV] T, W m 40 50 60 70 80 90 100 110 120 Events / GeV 200 400 600 800 1000 1200 1400 1600 1800 3 10 × Data multi-jet ν µ → W W →τν µ µ → Z Other ATLAS -1 = 8 TeV, 20.2 fb s − µ
Figure 1: The muon η (top), muon pT(centre), and W boson transverse mass (bottom) distributions of selected events with positive muons (left) and negative muons (right). The statistical uncertainties of the data points are smaller than the size of the markers.
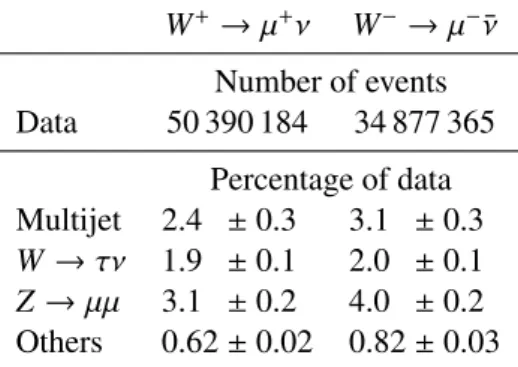
Table 1: The number of data events after event selection for W+ → µ+ν and W− → µ−¯ν and the percentage of selected data that each of the three major backgrounds constitutes.
W+→µ+ν W−→µ−¯ν Number of events Data 50 390 184 34 877 365 Percentage of data Multijet 2.4 ± 0.3 3.1 ± 0.3 W →τν 1.9 ± 0.1 2.0 ± 0.1 Z →µµ 3.1 ± 0.2 4.0 ± 0.2 Others 0.62 ± 0.02 0.82 ± 0.03
3.5 Obtaining the fiducial cross-sections
The fiducial W±differential cross-sections in bin i of pseudorapidity (dσWµ±/dηµ)iare obtained from dσWµ± dηµ ! i = Ndata,i− Nbkg,i ∆ηi· CW±,i· R Ldt,
where Ndata,iis the number of selected candidate events in data, Nbkg,iis the number of background events estimated using the methods described in Section3.4,∆ηiis the width of bin i, and
R
Ldt is the integrated luminosity. The results are provided as a function of absolute pseudorapidity, where∆|ηi|= 2 · ∆ηi. The term CW±,iis a factor (different for positive and negative channels) which corrects for the various detector
inefficiencies and resolution effects. This is estimated using W → µν signal MC simulations and defined for each bin i as the number of reconstructed events satisfying the same selection criteria as data divided by the number of generated events in the fiducial phase space. The charge asymmetry is then evaluated in each absolute pseudorapidity bin using Eq. (1). A bin-by-bin correction method is used as the purity of each bin is 99% or larger, where the bin purity is defined as the ratio of events generated and reconstructed in a certain bin to all events reconstructed in that bin (where all events are in the generator-level fiducial phase space).
The integrated fiducial cross-sections (σWµ±) are obtained using one global correction factor, CW±, (i.e.
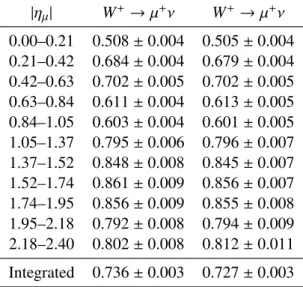
the total number of reconstructed events satisfying the same selection criteria as data divided by the total number of generated events in the integrated fiducial phase space). The values are also obtained by summing the differential cross-sections as a function of |ηµ|, and the results are consistent. Table2lists the CW±,ivalues with their associated systematic uncertainties as a function of |ηµ| and gives the integrated
global correction factor CW±, each for W+and W−.
4 Systematic uncertainties
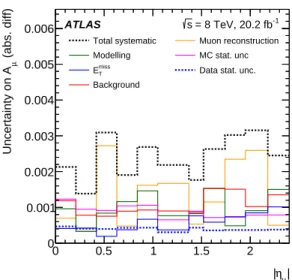
This section describes the sources of systematic uncertainty considered for the cross-section and the asymmetry measurements. The size of these uncertainties as a function of |ηµ| is provided in Figures2
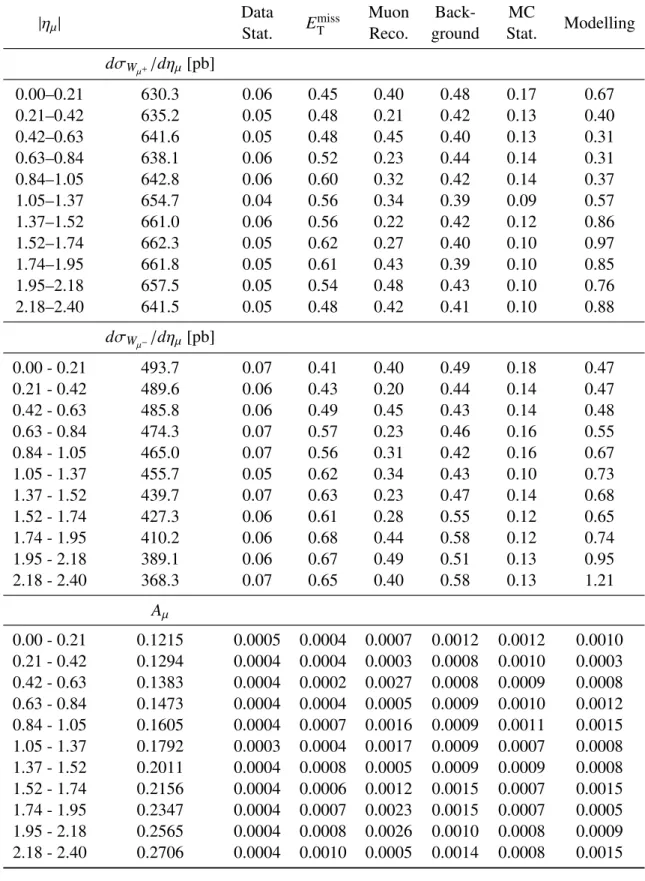
and3. The data statistical uncertainties are also shown and are small compared with the total systematic uncertainty. Table3lists the W+→µ+ν and W−→µ−¯ν cross-sections and the asymmetry as a function
Table 2: The CW±,ivalues with their associated systematic uncertainties as a function of |ηµ| and the integrated global correction factor CW±, each for W+and W−.
|ηµ| W+→µ+ν W+→µ+ν 0.00–0.21 0.508 ± 0.004 0.505 ± 0.004 0.21–0.42 0.684 ± 0.004 0.679 ± 0.004 0.42–0.63 0.702 ± 0.005 0.702 ± 0.005 0.63–0.84 0.611 ± 0.004 0.613 ± 0.005 0.84–1.05 0.603 ± 0.004 0.601 ± 0.005 1.05–1.37 0.795 ± 0.006 0.796 ± 0.007 1.37–1.52 0.848 ± 0.008 0.845 ± 0.007 1.52–1.74 0.861 ± 0.009 0.856 ± 0.007 1.74–1.95 0.856 ± 0.009 0.855 ± 0.008 1.95–2.18 0.792 ± 0.008 0.794 ± 0.009 2.18–2.40 0.802 ± 0.008 0.812 ± 0.011 Integrated 0.736 ± 0.003 0.727 ± 0.003
of the absolute pseudorapidity of the muon, along with the data statistical uncertainties and dominant systematic uncertainties. Most sources of systematic uncertainty, described below, are treated as being correlated between the positive and negative muon channels unless otherwise noted, and therefore their relative impact is reduced for the asymmetry measurement.
| µ η | 0 0.5 1 1.5 2 | [%] η µ /d| σ Relative uncertainty on d 0 0.5 1 1.5
2 Total systematic Muon reconstruction
Modelling MC stat. unc
miss T
E Data stat. unc.
Background -1 = 8 TeV, 20.2 fb s ATLAS ν + µ → + W | µ η | 0 0.5 1 1.5 2 | [%] η µ /d| σ Relative uncertainty on d 0 0.5 1 1.5
2 Total systematic Muon reconstruction
Modelling MC stat. unc
miss T
E Data stat. unc.
Background -1 = 8 TeV, 20.2 fb s ATLAS ν − µ → − W
Figure 2: The relative systematic uncertainty from each source for the W+(left) and W−(right) differential cross-sections as a percentage of the differential cross-section. Also shown are the total systematic and statistical uncertainties.
Experimental sources of uncertainty are possible mis-modelling of the muon momentum scale, resolution, or charge-dependent sagitta bias as well as of the reconstruction, trigger, and isolation efficiencies. Such uncertainties form a small but non-negligible fraction of the total uncertainty, 0.5% or less of the differential cross-section. A test is performed to check the compatibility of the cross-sections measured separately in positive and negative muon pseudorapidity; this is an important cross-check of the correction
| µ η | 0 0.5 1 1.5 2 (abs. diff)µ Uncertainty on A 0 0.001 0.002 0.003 0.004 0.005 0.006
Total systematic Muon reconstruction
Modelling MC stat. unc
miss T
E Data stat. unc.
Background
-1
= 8 TeV, 20.2 fb s
ATLAS
Figure 3: The systematic uncertainty from each source for the W boson charge asymmetry as an absolute difference from the central value. Also shown are the total systematic and statistical uncertainties.
procedure as the detector is not forward-backward symmetric with respect to the trajectory of a charged particle. A further small uncertainty (up to 0.4% depending on the |ηµ| bin) is added to cover the small differences observed. This uncertainty is treated as being uncorrelated between charges and propagated to the asymmetry measurement. The above uncertainties are combined in the column labelled ‘Muon Reconstruction’ in Table3. Additional sources of uncertainty are the mis-modelling of the pile-up event activity and of the primary vertex longitudinal position, both of which are small.
Uncertainties from the mis-modelling of the missing transverse momentum also contribute substantially to the total systematic uncertainty in the cross-section, although they are reduced for the asymmetry measurements. These include mis-modelling in the jet energy scale and resolution, as well as of the momentum balance between the soft term and the total transverse momentum of the hard objects in Z →µµ calibration events [58]. The muon-related uncertainties in the missing transverse momentum are treated as being fully correlated with those of the signal muon and are part of the muon systematic uncertainties. The sum of all soft-term uncertainties is the largest or second largest contributor (depending on the |ηµ| bin) to the total uncertainty in the differential cross-sections but is significantly less important for the asymmetry measurement. The hard-term uncertainties are small for both the cross-section and asymmetry measurements. The soft-term and hard-term uncertainties are assumed to be uncorrelated with each other.
Uncertainties due to the mis-modelling of the background processes are also considered. For the back-grounds modelled with MC simulations, these are estimated by varying their normalisation within theoret-ical uncertainties and observing the effect on the final measurements. The cross-section uncertainty for the Z → µµ process and the W → τν process is 5% [60]. The cross-section uncertainty for t¯t production is 6% [45–51], and for single top production 7% [52–54]. The cross-section uncertainty for diboson production is 5% for WW and ZZ production and 7% for WZ production [55].
As mentioned in Section3.4, there are three components of the uncertainty in the multijet background normalisation. The two correlated uncertainties are larger for the cross-section measurements (totalling around 0.5%), whilst the effect of the statistical component is larger for the asymmetry measurement.
The statistical uncertainty due to the limited number of MC events for the other backgrounds and for the signal process is small for the cross-section measurement (less than 0.2%) but becomes significant for the asymmetry measurement (around one third of the total uncertainty), as it is completely uncorrelated between positive and negative channels.
Theoretical sources of uncertainty arise from the choice of PDF interfaced to the Powheg+Pythia8 signal MC simulations (the CT10 PDF set). This uncertainty is estimated by reweighting the Powheg+Pythia8 events to the nominal values of the CT14 [1] and MSTW2008nlo68cl [44] PDF sets using the LHAPDF interface [61], taking the difference to the nominal values and adding in quadrature. The PDF uncertainty
is small for both the fiducial cross-section and asymmetry measurements.
The alternative Sherpa signal sample is used to estimate an uncertainty from Powheg+Pythia8 related to the modelling of the matrix elements that impact kinematics, as well as the underlying event activity and hadronisation (which affects the EmissT measurement). The difference between the dressed-level CW values obtained using the Powheg+Pythia8 and Sherpa simulations is statistically significant and assigned as a systematic uncertainty. This is labelled as ‘Modelling’ in Table3. The dressed-level is defined by combining the four-momentum of each muon after photon FSR with that of photons radiated within a cone defined by∆R = 0.1 around the muon. This is one of the largest systematic uncertainties for both the cross-section (up to 1% at large |ηµ|) and the asymmetry measurements. The uncertainty in the luminosity is 1.9% [18]. For the asymmetry, the uncertainty in the luminosity only affects the asymmetry measurement through negligible effects in the background estimation, and it is therefore considered fully correlated between the W+and W−samples.
5 Theoretical predictions
The W+and W−integrated and differential cross-sections and the W boson charge asymmetry are compared with theoretical predictions from an optimised version of the DYNNLO generator [19], which simulates initial-state QCD corrections to NNLO accuracy at leading order in the electroweak couplings with parameters set according to the Gµscheme [62]. The input parameters (the Fermi constant GF, the masses and widths of the W and Z bosons, and the CKM matrix elements) are taken from Ref. [63]. The DYNNLO predictions are calculated with the PDF sets from CT14 NNLO [1], ATLASepWZ2016 [2], HERAPDF2.0 [3], NNPDF3.1 [4], PDF4LHC15 [5] and MMHT2014 NNLO [6]. The renormalisation and factorisation scales are set equal to the invariant mass of the muon–neutrino pair.
Uncertainties in the DYNNLO prediction due the choice of scales are evaluated by varying the factorisation and renormalisation scales independently by factors of 0.5 and 2 from their nominal values. The uncertainty on the CT14 NNLO prediction is evaluated using the corresponding PDF error sets.
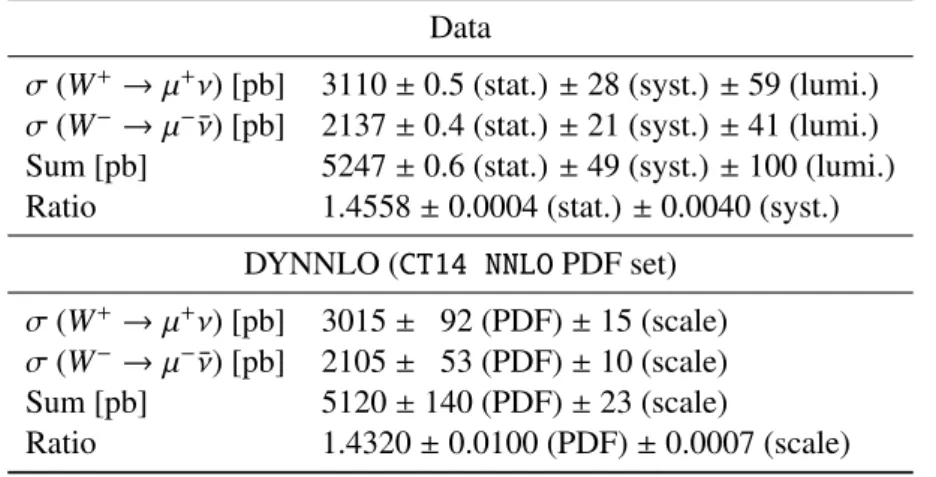
6 Results
The measured integrated fiducial cross-sections multiplied by the branching fraction for the decay into a muon and a neutrino are listed in Table4, along with the associated uncertainties which are dominated by the 1.9% uncertainty in the luminosity. Also provided is the sum of the W+ →µ+ν and W− →µ−¯ν integrated cross-sections and their ratio, the total uncertainties on which are 2.1% and 0.3% respectively. The data are compared with the NNLO predictions from DYNNLO, the total uncertainties on which
Table 3: Cross-sections (differential in ηµ) and asymmetry, as a function of |ηµ|. The central values are provided along with the statistical and dominant systematic uncertainties: the data statistical uncertainty (Data Stat.), the Emiss
T uncertainty, the uncertainties related to muon reconstruction (Muon Reco.), those related to the background, those from MC statistics (MC Stat.), and modelling uncertainties. The uncertainties of the cross-sections are given in percent and those of the asymmetry as an absolute difference from the nominal.
|ηµ| Data Stat. E miss T Muon Reco. Back-ground MC Stat. Modelling dσWµ+/dηµ[pb] 0.00–0.21 630.3 0.06 0.45 0.40 0.48 0.17 0.67 0.21–0.42 635.2 0.05 0.48 0.21 0.42 0.13 0.40 0.42–0.63 641.6 0.05 0.48 0.45 0.40 0.13 0.31 0.63–0.84 638.1 0.06 0.52 0.23 0.44 0.14 0.31 0.84–1.05 642.8 0.06 0.60 0.32 0.42 0.14 0.37 1.05–1.37 654.7 0.04 0.56 0.34 0.39 0.09 0.57 1.37–1.52 661.0 0.06 0.56 0.22 0.42 0.12 0.86 1.52–1.74 662.3 0.05 0.62 0.27 0.40 0.10 0.97 1.74–1.95 661.8 0.05 0.61 0.43 0.39 0.10 0.85 1.95–2.18 657.5 0.05 0.54 0.48 0.43 0.10 0.76 2.18–2.40 641.5 0.05 0.48 0.42 0.41 0.10 0.88 dσWµ−/dηµ[pb] 0.00 - 0.21 493.7 0.07 0.41 0.40 0.49 0.18 0.47 0.21 - 0.42 489.6 0.06 0.43 0.20 0.44 0.14 0.47 0.42 - 0.63 485.8 0.06 0.49 0.45 0.43 0.14 0.48 0.63 - 0.84 474.3 0.07 0.57 0.23 0.46 0.16 0.55 0.84 - 1.05 465.0 0.07 0.56 0.31 0.42 0.16 0.67 1.05 - 1.37 455.7 0.05 0.62 0.34 0.43 0.10 0.73 1.37 - 1.52 439.7 0.07 0.63 0.23 0.47 0.14 0.68 1.52 - 1.74 427.3 0.06 0.61 0.28 0.55 0.12 0.65 1.74 - 1.95 410.2 0.06 0.68 0.44 0.58 0.12 0.74 1.95 - 2.18 389.1 0.06 0.67 0.49 0.51 0.13 0.95 2.18 - 2.40 368.3 0.07 0.65 0.40 0.58 0.13 1.21 Aµ 0.00 - 0.21 0.1215 0.0005 0.0004 0.0007 0.0012 0.0012 0.0010 0.21 - 0.42 0.1294 0.0004 0.0004 0.0003 0.0008 0.0010 0.0003 0.42 - 0.63 0.1383 0.0004 0.0002 0.0027 0.0008 0.0009 0.0008 0.63 - 0.84 0.1473 0.0004 0.0004 0.0005 0.0009 0.0010 0.0012 0.84 - 1.05 0.1605 0.0004 0.0007 0.0016 0.0009 0.0011 0.0015 1.05 - 1.37 0.1792 0.0003 0.0004 0.0017 0.0009 0.0007 0.0008 1.37 - 1.52 0.2011 0.0004 0.0008 0.0005 0.0009 0.0009 0.0008 1.52 - 1.74 0.2156 0.0004 0.0006 0.0012 0.0015 0.0007 0.0015 1.74 - 1.95 0.2347 0.0004 0.0007 0.0023 0.0015 0.0007 0.0005 1.95 - 2.18 0.2565 0.0004 0.0008 0.0026 0.0010 0.0008 0.0009 2.18 - 2.40 0.2706 0.0004 0.0010 0.0005 0.0014 0.0008 0.0015
Table 4: The measured fiducial production cross-sections times branching ratio for W+→µ+ν and W−→µ−¯ν, their sum, and their ratio for both data and the predictions from DYNNLO (CT14 NNLO PDF set).
Data
σ (W+→µ+ν) [pb] 3110 ± 0.5 (stat.) ± 28 (syst.) ± 59 (lumi.) σ (W−→µ−¯ν) [pb] 2137 ± 0.4 (stat.) ± 21 (syst.) ± 41 (lumi.) Sum [pb] 5247 ± 0.6 (stat.) ± 49 (syst.) ± 100 (lumi.)
Ratio 1.4558 ± 0.0004 (stat.) ± 0.0040 (syst.)
DYNNLO (CT14 NNLO PDF set) σ (W+→µ+ν) [pb] 3015 ± 92 (PDF) ± 15 (scale) σ (W−→µ−¯ν) [pb] 2105 ± 53 (PDF) ± 10 (scale)
Sum [pb] 5120 ± 140 (PDF) ± 23 (scale)
Ratio 1.4320 ± 0.0100 (PDF) ± 0.0007 (scale)
are dominated by the component from the PDF uncertainty. Data and theory agree well and within the uncertainties, although the ratio measurements differ by approximately two standard deviations. The results presented in Table4are consistent, within about one standard deviation, with those measured using Wboson decays in the electron channel in data at a centre-of-mass energy of 8 TeV [64].
The W+and W−fiducial cross-sections, differential in muon pseudorapidity, multiplied by the branching fraction for the decay into a muon and a neutrino, are shown as a function of absolute muon pseudorapidity in Figure4. These are presented with systematic and total uncertainties. The data statistical uncertainties are smaller than the size of the markers. The cross-section values are detailed in Table3. The measured cross-sections are compared with theoretical predictions obtained using DYNNLO.
In the top plots of Figure4, DYNNLO is shown with its associated total theoretical uncertainty, and from the PDF uncertainty (evaluated with the CT14 NNLO error sets). The component from the PDF uncertainty dominates the total and is shown separately. The data precision is similar to the intrinsic theoretical uncertainty from scale variations but is much higher than the uncertainty from the PDF. Therefore the data are useful for constraining and evaluating the performance of different PDF sets. In the bottom plots the data are compared with the central values of each PDF set described above. The statistical uncertainties of the DYNNLO predictions are indicated by error bars.
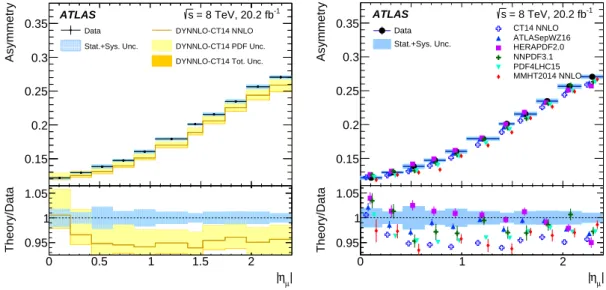
The measured W boson charge asymmetry as a function of absolute muon pseudorapidity is presented in Figure5. The values are detailed in Table3. Again the data are shown with its total systematic uncertainty. In Figure5(left) the data are compared with the prediction from DYNNLO in which the CT14 NNLO PDF set is used. The DYNNLO prediction is also shown with its associated total theoretical uncertainty, along with the component from the PDF set, which dominates. In Figure5(right) the data are compared with the central prediction from the six PDF sets considered. The statistical uncertainties of the DYNNLO predictions are indicated by error bars. The ratios of the data to the corresponding prediction are shown in the lower panels. The comparison with ATLASepWZ2016 and NNPDF3.1 is of particular interest as both include information from the ATLAS 7 TeV measurement [2], which is expected to be largely uncorrelated with the current data being presented. It is observed that its central value is generally closer to the data than the alternatives, other than HERAPDF2.0 which performs about as well.
| µ η | 0 0.5 1 1.5 2 [pb]µ η /d σ d 600 650 700 750 800
Data DYNNLO-CT14 NNLO
Stat.+Sys. Unc. DYNNLO-CT14 PDF Unc.
Stat.+Sys.+Lum. Unc. DYNNLO-CT14 Tot. Unc.
-1 = 8 TeV, 20.2 fb s ATLAS ν + µ → + W | µ η | 0 0.5 1 1.5 2 Theory/Data 0.95 1 1.05 | µ η | 0 0.5 1 1.5 2 [pb]µ η /d σ d 350 400 450 500 550 600 650 700
Data DYNNLO-CT14 NNLO
Stat.+Sys. Unc. DYNNLO-CT14 PDF Unc.
Stat.+Sys.+Lum. Unc. DYNNLO-CT14 Tot. Unc.
-1 = 8 TeV, 20.2 fb s ATLAS ν − µ → − W | µ η | 0 0.5 1 1.5 2 Theory/Data 0.95 1 1.05 0 0.5 1 1.5 2 µ η 600 650 700 750 800 [pb]µ η /d σ d Data Stat.+Sys. Unc. Stat.+Sys.+Lum. Unc. CT14 NNLO ATLASepWZ16 HERAPDF2.0 NNPDF3.1 PDF4LHC15 MMHT2014 NNLO -1 = 8 TeV, 20.2 fb s ATLAS ν + µ → + W 0 1 2 | µ η | 0.95 1 1.05 Theory/Data 0 0.5 1 1.5 2 µ η 350 400 450 500 550 600 650 700 [pb] µ η /d σ d Data Stat.+Sys. Unc. Stat.+Sys.+Lum. Unc. CT14 NNLO ATLASepWZ16 HERAPDF2.0 NNPDF3.1 PDF4LHC15 MMHT2014 NNLO -1 = 8 TeV, 20.2 fb s ATLAS ν − µ → − W 0 1 2 | µ η | 0.95 1 1.05 Theory/Data
Figure 4: The W+(left) and W−(right) fiducial cross-sections, differential in muon pseudorapidity multiplied by the branching fraction for the decay into a muon and a neutrino are shown as a function of the absolute muon pseudorapidity. The data are presented with systematic and total uncertainties (the data statistical uncertainties are smaller than the size of the markers) and are compared with the predictions from DYNNLO. In the top two plots, the CT14 NNLO PDF set is used, and DYNNLO is shown with its associated total theoretical uncertainty. In the bottom two plots, the data are compared with the central values of six different PDF sets described in the text. The statistical uncertainties of the DYNNLO predictions are indicated by error bars. The ratios of the data to the corresponding prediction are shown in the lower panels.
| µ η | 0 0.5 1 1.5 2 Asymmetry 0.15 0.2 0.25 0.3 0.35
Data DYNNLO-CT14 NNLO
Stat.+Sys. Unc. DYNNLO-CT14 PDF Unc.
DYNNLO-CT14 Tot. Unc. -1 = 8 TeV, 20.2 fb s ATLAS | µ η | 0 0.5 1 1.5 2 Theory/Data 0.95 1 1.05 0 0.5 1 1.5 2 µ η 0.15 0.2 0.25 0.3 0.35 Asymmetry Data Stat.+Sys. Unc. CT14 NNLO ATLASepWZ16 HERAPDF2.0 NNPDF3.1 PDF4LHC15 MMHT2014 NNLO -1 = 8 TeV, 20.2 fb s ATLAS 0 1 2 | µ η | 0.95 1 1.05 Theory/Data
Figure 5: The W boson charge asymmetry as a function of absolute muon pseudorapidity. The data are presented with systematic and total uncertainties (the data statistical uncertainties are smaller than the size of the markers). In the left plot, the data are compared with the prediction from DYNNLO in which the CT14 NNLO PDF set is used. The DYNNLO prediction is also shown with its associated total theoretical uncertainty, along with the component from the PDF set. In the right plot, the data are compared with the central prediction from DYNNLO produced using a selection of PDFs. The statistical uncertainties of the DYNNLO predictions are indicated by error bars. The ratios of the data to the corresponding prediction are shown in the lower panels.
7 Conclusion
Fiducial cross-sections for W+→µ+ν and W−→µ−¯ν and the W boson charge asymmetry are measured differentially as a function of the absolute muon pseudorapidity using 20.2 fb−1of data from proton–proton collisions at a centre-of-mass energy of 8 TeV with the ATLAS experiment at the LHC. The muon and neutrino transverse momenta are required to be greater than 25 GeV and the W boson transverse mass to be greater than 40 GeV. A precision of 0.8–1.5% is achieved for the cross-section values, depending on the pseudorapidity, whilst an uncertainty between 0.002 and 0.003 (in absolute units) is obtained for the asymmetry. The integrated fiducial W±production cross-sections are also determined. The measurements are compared to predictions at NNLO accuracy in QCD computed with the DYNNLO program. The precision of the measurement is better than both the uncertainties on the PDF sets as well as the spread between different sets, showing the sensitivity of the measurement to discriminate between them and serve as input to improve the knowledge on the proton structure.
Acknowledgements
We thank CERN for the very successful operation of the LHC, as well as the support staff from our institutions without whom ATLAS could not be operated efficiently.
We acknowledge the support of ANPCyT, Argentina; YerPhI, Armenia; ARC, Australia; BMWFW and FWF, Austria; ANAS, Azerbaijan; SSTC, Belarus; CNPq and FAPESP, Brazil; NSERC, NRC and CFI, Canada; CERN; CONICYT, Chile; CAS, MOST and NSFC, China; COLCIENCIAS, Colombia; MSMT CR, MPO CR and VSC CR, Czech Republic; DNRF and DNSRC, Denmark; IN2P3-CNRS, CEA-DRF/IRFU, France; SRNSFG, Georgia; BMBF, HGF, and MPG, Germany; GSRT, Greece; RGC, Hong Kong SAR, China; ISF and Benoziyo Center, Israel; INFN, Italy; MEXT and JSPS, Japan; CNRST, Morocco; NWO, Netherlands; RCN, Norway; MNiSW and NCN, Poland; FCT, Portugal; MNE/IFA, Romania; MES of Russia and NRC KI, Russian Federation; JINR; MESTD, Serbia; MSSR, Slovakia; ARRS and MIZŠ, Slovenia; DST/NRF, South Africa; MINECO, Spain; SRC and Wallenberg Foundation, Sweden; SERI, SNSF and Cantons of Bern and Geneva, Switzerland; MOST, Taiwan; TAEK, Turkey; STFC, United Kingdom; DOE and NSF, United States of America. In addition, individual groups and members have received support from BCKDF, CANARIE, CRC and Compute Canada, Canada; COST, ERC, ERDF, Horizon 2020, and Marie Skłodowska-Curie Actions, European Union; Investissements d’ Avenir Labex and Idex, ANR, France; DFG and AvH Foundation, Germany; Herakleitos, Thales and Aristeia programmes co-financed by EU-ESF and the Greek NSRF, Greece; BSF-NSF and GIF, Israel; CERCA Programme Generalitat de Catalunya, Spain; The Royal Society and Leverhulme Trust, United Kingdom.
The crucial computing support from all WLCG partners is acknowledged gratefully, in particular from CERN, the ATLAS Tier-1 facilities at TRIUMF (Canada), NDGF (Denmark, Norway, Sweden), CC-IN2P3 (France), KIT/GridKA (Germany), INFN-CNAF (Italy), NL-T1 (Netherlands), PIC (Spain), ASGC (Taiwan), RAL (UK) and BNL (USA), the Tier-2 facilities worldwide and large non-WLCG resource providers. Major contributors of computing resources are listed in Ref. [65].
References
[1] S. Dulat et al., New parton distribution functions from a global analysis of quantum chromodynamics,
Phys. Rev. D 93 (2016) 033006, arXiv:1506.07443 [hep-ph].
[2] ATLAS Collaboration, Precision measurement and interpretation of inclusive W+, W−and Z/γ∗ production cross sections with the ATLAS detector,Eur. Phys. J. C 77 (2017) 367, arXiv:1612.
03016 [hep-ex].
[3] H1 and ZEUS Collaborations, Combination of measurements of inclusive deep inelastic e±p scattering cross sections and QCD analysis of HERA data,Eur. Phys. J. C 75 (2015) 580, arXiv:
1506.06042 [hep-ex].
[4] R. D. Ball et al., Parton distributions from high-precision collider data,Eur. Phys. J. C 77 (2017) 663, arXiv:1706.00428 [hep-ph].
[5] J. Butterworth et al., PDF4LHC recommendations for LHC Run II,J. Phys. G 43 (2016) 023001, arXiv:1510.03865 [hep-ph].
[6] L. A. Harland-Lang, A. D. Martin, P. Motylinski and R. S. Thorne, Parton distributions in the LHC era: MMHT 2014 PDFs,Eur. Phys. J. C 75 (2015) 204, arXiv:1412.3989 [hep-ph].
[7] S. Alekhin, J. Blümlein, S. Moch and R. Plaˇcakyt˙e, Parton distribution functions, αs, and heavy-quark masses for LHC Run II,Phys. Rev. D 96 (2017) 014011, arXiv:1701.05838 [hep-ph]. [8] CDF Collaboration, Direct Measurement of the W Production Charge Asymmetry in p ¯p Collisions
at √s= 1.96 TeV,Phys. Rev. Lett. 102 (2009) 181801, arXiv:0901.2169 [hep-ex].
[9] D0 Collaboration, Measurement of the muon charge asymmetry in p ¯p → W+X → µν + X events at√ s=1.96 TeV,Phys. Rev. D 88 (2013) 091102, arXiv:1309.2591 [hep-ex].
[10] D0 Collaboration, Measurement of the electron charge asymmetry in p ¯p → W+ X → eν + X decays in p¯p collisions at √s= 1.96 TeV,Phys. Rev. D 91 (2015) 032007, arXiv:1412.2862 [hep-ex], Erratum:Phys. Rev. D 91 (2015) 079901.
[11] ATLAS Collaboration, Measurements of W and Z boson production in pp collisions at √s = 5.02 TeV with the ATLAS detector,Eur. Phys. J. C 79 (2019) 128, arXiv:1810.08424 [hep-ex]. [12] CMS Collaboration, Measurement of the electron charge asymmetry in inclusive W production in
pp collisions at √s= 7 TeV,Phys. Rev. Lett. 109 (2012) 111806, arXiv:1206.2598 [hep-ex]. [13] CMS Collaboration, Measurement of the muon charge asymmetry in inclusive pp → W + X
production at √s = 7 TeV and an improved determination of light parton distribution functions,
Phys. Rev. D 90 (2014) 032004, arXiv:1312.6283 [hep-ex].
[14] CMS Collaboration, Measurement of the differential cross section and charge asymmetry for inclusive pp → W±+ X production at √s = 8 TeV,Eur. Phys. J. C 76 (2016) 469, arXiv:1603.
01803 [hep-ex].
[15] LHCb Collaboration, Measurement of the forward W boson cross-section in pp collisions at√ s= 7 TeV,JHEP 12 (2014) 079, arXiv:1408.4354 [hep-ex].
[16] LHCb Collaboration, Measurement of forward W and Z boson production in pp collisions at √s= 8
TeV,JHEP 01 (2016) 155, arXiv:1511.08039 [hep-ex].
[17] LHCb Collaboration, Measurement of forward W → eν production in pp collisions at √s= 8 TeV,
[18] ATLAS Collaboration, Luminosity determination in pp collisions at √s= 8 TeV using the ATLAS detector at the LHC,Eur. Phys. J. C 76 (2016) 653, arXiv:1608.03953 [hep-ex].
[19] S. Catani, L. Cieri, G. Ferrera, D. de Florian and M. Grazzini, Vector Boson Production at Hadron Colliders: A Fully Exclusive QCD Calculation at Next-to-Next-to-Leading Order,Phys. Rev. Lett.
103 (2009) 082001, arXiv:0903.2120 [hep-ph].
[20] ATLAS Collaboration, The ATLAS Experiment at the CERN Large Hadron Collider,JINST 3 (2008)
S08003.
[21] ATLAS Collaboration, Performance of the ATLAS Trigger System in 2010, Eur. Phys. J. C 72
(2012) 1849, arXiv:1110.1530 [hep-ex].
[22] ATLAS Collaboration, Performance of the ATLAS muon trigger in pp collisions at √s= 8 TeV,Eur.
Phys. J. C 75 (2015) 120, arXiv:1408.3179 [hep-ex].
[23] E. Todesco and J. Wenninger, Large Hadron Collider momentum calibration and accuracy,Phys.
Rev. Accel. Beams 20 (2017) 081003.
[24] S. Alioli, P. Nason, C. Oleari and E. Re, NLO vector-boson production matched with shower in POWHEG,JHEP 07 (2008) 060, arXiv:0805.4802 [hep-ph].
[25] S. Alioli, P. Nason, C. Oleari and E. Re, A general framework for implementing NLO calculations in shower Monte Carlo programs: the POWHEG BOX,JHEP 06 (2010) 043, arXiv:1002.2581
[hep-ph].
[26] H.-L. Lai et al., New parton distributions for collider physics, Phys. Rev. D 82 (2010) 074024, arXiv:1007.2241 [hep-ph].
[27] T. Sjöstrand, S. Mrenna and P. Z. Skands, A brief introduction to PYTHIA 8.1, Comput. Phys.
Commun. 178 (2008) 852, arXiv:0710.3820 [hep-ph].
[28] ATLAS Collaboration, Summary of ATLAS Pythia 8 tunes, ATL-PHYS-PUB-2012-003, 2012, url:
https://cds.cern.ch/record/1474107.
[29] P. Golonka and Z. Was, PHOTOS Monte Carlo: a precision tool for QED corrections in Z and W decays,Eur. Phys. J. C 45 (2006) 97, arXiv:hep-ph/0506026.
[30] T. Gleisberg et al., Event generation with SHERPA 1.1,JHEP 02 (2009) 007, arXiv:0811.4622
[hep-ph].
[31] S. Frixione, P. Nason and G. Ridolfi, A Positive-weight next-to-leading-order Monte Carlo for heavy flavour hadroproduction,JHEP 09 (2007) 126, arXiv:0707.3088 [hep-ph].
[32] T. Sjöstrand, S. Mrenna and P. Z. Skands, PYTHIA 6.4 physics and manual,JHEP 05 (2006) 026, arXiv:hep-ph/0603175.
[33] ATLAS Run 1 Pythia8 tunes, tech. rep. ATL-PHYS-PUB-2014-021, CERN, 2014, url:https:
//cds.cern.ch/record/1966419.
[34] M. L. Mangano, M. Moretti, F. Piccinini, R. Pittau and A. D. Polosa, ALPGEN, a generator for hard multiparton processes in hadronic collisions,JHEP 07 (2003) 001, arXiv:hep-ph/0206293. [35] J. Pumplin et al., New Generation of Parton Distributions with Uncertainties from Global QCD
Analysis,JHEP 07 (2002) 012, arXiv:hep-ph/0201195.
[36] G. Corcella et al., HERWIG 6: An event generator for hadron emission reactions with interfering gluons (including supersymmetric processes),JHEP 01 (2001) 010, arXiv:hep-ph/0011363.
[37] J. Butterworth, J. R. Forshaw and M. Seymour, Multiparton Interactions in Photoproduction at HERA,Z. Phys. C 72 (1996) 637, arXiv:hep-ph/9601371.
[38] S. Frixione and B. R. Webber, Matching NLO QCD computations and parton shower simulations,
JHEP 06 (2002) 029, arXiv:hep-ph/0204244.
[39] B. P. Kersevan and E. Richter-Was, The Monte Carlo event generator AcerMC versions 2.0 to 3.8 with interfaces to PYTHIA 6.4, HERWIG 6.5 and ARIADNE 4.1,Comput. Phys. Commun. 184
(2013) 919, arXiv:hep-ph/0405247.
[40] S. Agostinelli et al., GEANT4 — a simulation toolkit, Nucl. Instrum. Meth. Phys. Res. A 506 (2003) 250.
[41] ATLAS Collaboration, The ATLAS Simulation Infrastructure,Eur. Phys. J. C 70 (2010) 823, arXiv:
1005.4568 [physics.ins-det].
[42] ATLAS Collaboration, Measurement of the muon reconstruction performance of the ATLAS detector using 2011 and 2012 LHC proton–proton collision data,Eur. Phys. J. C 74 (2014) 3130, arXiv:
1407.3935 [hep-ex].
[43] S. Catani and M. Grazzini, Next-to-Next-to-Leading-Order Subtraction Formalism in Hadron Colli-sions and its Application to Higgs-Boson Production at the LHC,Phys. Rev. Lett. 98 (2007) 222002, arXiv:hep-ph/0703012.
[44] A. D. Martin, W. J. Stirling, R. S. Thorne and G. Watt, Parton distributions for the LHC,Eur. Phys.
J. C 63 (2009) 189, arXiv:0901.0002 [hep-ph].
[45] M. Cacciari, M. Czakon, M. Mangano, A. Mitov and P. Nason, Top-pair production at had-ron colliders with next-to-next-to-leading logarithmic soft-gluon resummation,Phys. Lett. B 710
(2012) 612, arXiv:1111.5869 [hep-ph].
[46] M. Beneke, P. Falgari, S. Klein and C. Schwinn, Hadronic top-quark pair production with NNLL threshold resummation,Nucl. Phys. B 855 (2012) 695, arXiv:1109.1536 [hep-ph].
[47] P. Bärnreuther, M. Czakon and A. Mitov, Percent-Level-Precision Physics at the Tevatron: First Genuine Next-to-Next-to-Leading Order QCD Corrections to q¯q → t¯t+ X,Phys. Rev. Lett. 109
(2012) 132001, arXiv:1204.5201 [hep-ph].
[48] M. Czakon and A. Mitov, NNLO corrections to top-pair production at hadron colliders: the all-fermionic scattering channels,JHEP 12 (2012) 054, arXiv:1207.0236 [hep-ph].
[49] M. Czakon and A. Mitov, NNLO corrections to top pair production at hadron colliders: the quark-gluon reaction,JHEP 01 (2013) 080, arXiv:1210.6832 [hep-ph].
[50] M. Czakon, P. Fiedler and A. Mitov, Total Top-Quark Pair-Production Cross Section at Hadron Colliders Through O(α4S),Phys. Rev. Lett. 110 (2013) 252004, arXiv:1303.6254 [hep-ph]. [51] M. Czakon and A. Mitov, Top++: A program for the calculation of the top-pair cross-section at
hadron colliders,Comput. Phys. Commun. 185 (2014) 2930, arXiv:1112.5675 [hep-ph]. [52] N. Kidonakis, Next-to-next-to-leading logarithm resummation for s-channel single top quark
pro-duction,Phys. Rev. D 81 (2010) 054028, arXiv:1001.5034 [hep-ph].
[53] N. Kidonakis, Next-to-next-to-leading-order collinear and soft gluon corrections for t-channel single top quark production,Phys. Rev. D 83 (2011) 091503, arXiv:1103.2792 [hep-ph]. [54] N. Kidonakis, Two-loop soft anomalous dimensions for single top quark associated production with
[55] ATLAS Collaboration, Multi-Boson Simulation for 13 TeV ATLAS Analyses, ATL-PHYS-PUB-2017-005, 2017, url:https://cds.cern.ch/record/2261933.
[56] ATLAS Collaboration, The ATLAS Simulation Infrastructure,Eur. Phys. J. C 70 (2010) 823, arXiv:
1005.4568 [physics.ins-det].
[57] ATLAS Collaboration, Performance of primary vertex reconstruction in proton–proton collisions at √
s= 7 TeV in the ATLAS experiment, ATLAS-CONF-2010-069, 2010, url:https://cds.cern.
ch/record/1281344.
[58] ATLAS Collaboration, Performance of algorithms that reconstruct missing transverse momentum in√ s= 8 TeV proton–proton collisions in the ATLAS detector,Eur. Phys. J. C 77 (2017) 241, arXiv:
1609.09324 [hep-ex].
[59] ATLAS Collaboration, Measurement of the W-boson mass in pp collisions at √s= 7 TeV with the ATLAS detector,Eur. Phys. J. C 78 (2018) 110, arXiv:1701.07240 [hep-ex].
[60] ATLAS Collaboration, ATLAS simulation of boson plus jets processes in Run 2, ATL-PHYS-PUB-2017-006, 2017, url:https://cds.cern.ch/record/2261937.
[61] M. Whalley, D. Bourilkov and R. Group, The Les Houches Accord PDFs (LHAPDF) and LHAGLUE, (2005), arXiv:hep-ph/0508110.
[62] W. F. L. Hollik, Radiative Corrections in the Standard Model and Their Role for Precision Tests of the Electroweak Theory,Fortsch. Phys. 38 (1990) 165.
[63] C. Patrignani et al., Review of Particle Physics,Chin. Phys. C40 (2016) 100001.
[64] ATLAS Collaboration, Measurement of differential cross sections and W+/W−cross-section ratios for W boson production in association with jets at √s= 8 TeV with the ATLAS detector,JHEP 05
(2018) 077, arXiv:1711.03296 [hep-ex].
[65] ATLAS Collaboration, ATLAS Computing Acknowledgements, ATL-GEN-PUB-2016-002, url:
The ATLAS Collaboration
G. Aad101, B. Abbott128, D.C. Abbott102, O. Abdinov13,*, A. Abed Abud70a,70b, K. Abeling53, D.K. Abhayasinghe93, S.H. Abidi167, O.S. AbouZeid40, N.L. Abraham156, H. Abramowicz161, H. Abreu160, Y. Abulaiti6, B.S. Acharya66a,66b,n, B. Achkar53, S. Adachi163, L. Adam99, C. Adam Bourdarios132, L. Adamczyk83a, L. Adamek167, J. Adelman121, M. Adersberger114, A. Adiguzel12c,ah, S. Adorni54, T. Adye144, A.A. Affolder146, Y. Afik160, C. Agapopoulou132,
M.N. Agaras38, A. Aggarwal119, C. Agheorghiesei27c, J.A. Aguilar-Saavedra140f,140a,ag, F. Ahmadov79, X. Ai15a, G. Aielli73a,73b, S. Akatsuka85, T.P.A. Åkesson96, E. Akilli54, A.V. Akimov110, K. Al Khoury132, G.L. Alberghi23b,23a, J. Albert176, M.J. Alconada Verzini88, S. Alderweireldt119, M. Aleksa36,
I.N. Aleksandrov79, C. Alexa27b, D. Alexandre19, T. Alexopoulos10, A. Alfonsi120, M. Alhroob128, B. Ali142, G. Alimonti68a, J. Alison37, S.P. Alkire148, C. Allaire132, B.M.M. Allbrooke156, B.W. Allen131, P.P. Allport21, A. Aloisio69a,69b, A. Alonso40, F. Alonso88, C. Alpigiani148, A.A. Alshehri57,
M. Alvarez Estevez98, B. Alvarez Gonzalez36, D. Álvarez Piqueras174, M.G. Alviggi69a,69b, Y. Amaral Coutinho80b, A. Ambler103, L. Ambroz135, C. Amelung26, D. Amidei105,
S.P. Amor Dos Santos140a, S. Amoroso46, C.S. Amrouche54, F. An78, C. Anastopoulos149, N. Andari145, T. Andeen11, C.F. Anders61b, J.K. Anders20, A. Andreazza68a,68b, V. Andrei61a, C.R. Anelli176,
S. Angelidakis38, A. Angerami39, A.V. Anisenkov122b,122a, A. Annovi71a, C. Antel61a, M.T. Anthony149, M. Antonelli51, D.J.A. Antrim171, F. Anulli72a, M. Aoki81, J.A. Aparisi Pozo174, L. Aperio Bella36, G. Arabidze106, J.P. Araque140a, V. Araujo Ferraz80b, R. Araujo Pereira80b, C. Arcangeletti51, A.T.H. Arce49, F.A. Arduh88, J-F. Arguin109, S. Argyropoulos77, J.-H. Arling46, A.J. Armbruster36, L.J. Armitage92, A. Armstrong171, O. Arnaez167, H. Arnold120, A. Artamonov111,*, G. Artoni135, S. Artz99, S. Asai163, N. Asbah59, E.M. Asimakopoulou172, L. Asquith156, K. Assamagan29, R. Astalos28a,
R.J. Atkin33a, M. Atkinson173, N.B. Atlay151, H. Atmani132, K. Augsten142, G. Avolio36, R. Avramidou60a, M.K. Ayoub15a, A.M. Azoulay168b, G. Azuelos109,av, M.J. Baca21, H. Bachacou145, K. Bachas67a,67b, M. Backes135, F. Backman45a,45b, P. Bagnaia72a,72b, M. Bahmani84, H. Bahrasemani152, A.J. Bailey174, V.R. Bailey173, J.T. Baines144, M. Bajic40, C. Bakalis10, O.K. Baker183, P.J. Bakker120, D. Bakshi Gupta8, S. Balaji157, E.M. Baldin122b,122a, P. Balek180, F. Balli145, W.K. Balunas135, J. Balz99, E. Banas84,
A. Bandyopadhyay24, Sw. Banerjee181,i, A.A.E. Bannoura182, L. Barak161, W.M. Barbe38,
E.L. Barberio104, D. Barberis55b,55a, M. Barbero101, T. Barillari115, M-S. Barisits36, J. Barkeloo131, T. Barklow153, R. Barnea160, S.L. Barnes60c, B.M. Barnett144, R.M. Barnett18, Z. Barnovska-Blenessy60a, A. Baroncelli60a, G. Barone29, A.J. Barr135, L. Barranco Navarro174, F. Barreiro98,
J. Barreiro Guimarães da Costa15a, R. Bartoldus153, G. Bartolini101, A.E. Barton89, P. Bartos28a,
A. Basalaev46, A. Bassalat132, R.L. Bates57, S.J. Batista167, S. Batlamous35e, J.R. Batley32, B. Batool151, M. Battaglia146, M. Bauce72a,72b, F. Bauer145, K.T. Bauer171, H.S. Bawa31,l, J.B. Beacham126, T. Beau136, P.H. Beauchemin170, F. Becherer52, P. Bechtle24, H.C. Beck53, H.P. Beck20,q, K. Becker52, M. Becker99, C. Becot46, A. Beddall12d, A.J. Beddall12a, V.A. Bednyakov79, M. Bedognetti120, C.P. Bee155,
T.A. Beermann76, M. Begalli80b, M. Begel29, A. Behera155, J.K. Behr46, F. Beisiegel24, A.S. Bell94, G. Bella161, L. Bellagamba23b, A. Bellerive34, P. Bellos9, K. Beloborodov122b,122a, K. Belotskiy112, N.L. Belyaev112, D. Benchekroun35a, N. Benekos10, Y. Benhammou161, D.P. Benjamin6, M. Benoit54, J.R. Bensinger26, S. Bentvelsen120, L. Beresford135, M. Beretta51, D. Berge46, E. Bergeaas Kuutmann172, N. Berger5, B. Bergmann142, L.J. Bergsten26, J. Beringer18, S. Berlendis7, N.R. Bernard102,
G. Bernardi136, C. Bernius153, F.U. Bernlochner24, T. Berry93, P. Berta99, C. Bertella15a, I.A. Bertram89, G.J. Besjes40, O. Bessidskaia Bylund182, N. Besson145, A. Bethani100, S. Bethke115, A. Betti24,
A.J. Bevan92, J. Beyer115, R. Bi139, R.M. Bianchi139, O. Biebel114, D. Biedermann19, R. Bielski36, K. Bierwagen99, N.V. Biesuz71a,71b, M. Biglietti74a, T.R.V. Billoud109, M. Bindi53, A. Bingul12d,
C. Bini72a,72b, S. Biondi23b,23a, M. Birman180, T. Bisanz53, J.P. Biswal161, A. Bitadze100, C. Bittrich48, K. Bjørke134, K.M. Black25, T. Blazek28a, I. Bloch46, C. Blocker26, A. Blue57, U. Blumenschein92, G.J. Bobbink120, V.S. Bobrovnikov122b,122a, S.S. Bocchetta96, A. Bocci49, D. Boerner46, D. Bogavac14, A.G. Bogdanchikov122b,122a, C. Bohm45a, V. Boisvert93, P. Bokan53,172, T. Bold83a, A.S. Boldyrev113, A.E. Bolz61b, M. Bomben136, M. Bona92, J.S. Bonilla131, M. Boonekamp145, H.M. Borecka-Bielska90, A. Borisov123, G. Borissov89, J. Bortfeldt36, D. Bortoletto135, V. Bortolotto73a,73b, D. Boscherini23b, M. Bosman14, J.D. Bossio Sola103, K. Bouaouda35a, J. Boudreau139, E.V. Bouhova-Thacker89,
D. Boumediene38, S.K. Boutle57, A. Boveia126, J. Boyd36, D. Boye33b,ap, I.R. Boyko79, A.J. Bozson93, J. Bracinik21, N. Brahimi101, G. Brandt182, O. Brandt61a, F. Braren46, U. Bratzler164, B. Brau102, J.E. Brau131, W.D. Breaden Madden57, K. Brendlinger46, L. Brenner46, R. Brenner172, S. Bressler180, B. Brickwedde99, D.L. Briglin21, D. Britton57, D. Britzger115, I. Brock24, R. Brock106, G. Brooijmans39, W.K. Brooks147b, E. Brost121, J.H Broughton21, P.A. Bruckman de Renstrom84, D. Bruncko28b,
A. Bruni23b, G. Bruni23b, L.S. Bruni120, S. Bruno73a,73b, B.H. Brunt32, M. Bruschi23b, N. Bruscino139, P. Bryant37, L. Bryngemark96, T. Buanes17, Q. Buat36, P. Buchholz151, A.G. Buckley57, I.A. Budagov79, M.K. Bugge134, F. Bührer52, O. Bulekov112, T.J. Burch121, S. Burdin90, C.D. Burgard120, A.M. Burger129, B. Burghgrave8, K. Burka84, J.T.P. Burr46, V. Büscher99, E. Buschmann53, P.J. Bussey57, J.M. Butler25, C.M. Buttar57, J.M. Butterworth94, P. Butti36, W. Buttinger36, A. Buzatu158, A.R. Buzykaev122b,122a, G. Cabras23b,23a, S. Cabrera Urbán174, D. Caforio56, H. Cai173, V.M.M. Cairo153, O. Cakir4a, N. Calace36, P. Calafiura18, A. Calandri101, G. Calderini136, P. Calfayan65, G. Callea57, L.P. Caloba80b,
S. Calvente Lopez98, D. Calvet38, S. Calvet38, T.P. Calvet155, M. Calvetti71a,71b, R. Camacho Toro136, S. Camarda36, D. Camarero Munoz98, P. Camarri73a,73b, D. Cameron134, R. Caminal Armadans102, C. Camincher36, S. Campana36, M. Campanelli94, A. Camplani40, A. Campoverde151, V. Canale69a,69b, A. Canesse103, M. Cano Bret60c, J. Cantero129, T. Cao161, Y. Cao173, M.D.M. Capeans Garrido36, M. Capua41b,41a, R. Cardarelli73a, F.C. Cardillo149, I. Carli143, T. Carli36, G. Carlino69a, B.T. Carlson139, L. Carminati68a,68b, R.M.D. Carney45a,45b, S. Caron119, E. Carquin147b, S. Carrá68a,68b, J.W.S. Carter167, M.P. Casado14,e, A.F. Casha167, D.W. Casper171, R. Castelijn120, F.L. Castillo174, V. Castillo Gimenez174, N.F. Castro140a,140e, A. Catinaccio36, J.R. Catmore134, A. Cattai36, J. Caudron24, V. Cavaliere29,
E. Cavallaro14, D. Cavalli68a, M. Cavalli-Sforza14, V. Cavasinni71a,71b, E. Celebi12b, F. Ceradini74a,74b, L. Cerda Alberich174, A.S. Cerqueira80a, A. Cerri156, L. Cerrito73a,73b, F. Cerutti18, A. Cervelli23b,23a, S.A. Cetin12b, D. Chakraborty121, S.K. Chan59, W.S. Chan120, W.Y. Chan90, J.D. Chapman32, B. Chargeishvili159b, D.G. Charlton21, T.P. Charman92, C.C. Chau34, S. Che126, A. Chegwidden106, S. Chekanov6, S.V. Chekulaev168a, G.A. Chelkov79,au, M.A. Chelstowska36, B. Chen78, C. Chen60a, C.H. Chen78, H. Chen29, J. Chen60a, J. Chen39, S. Chen137, S.J. Chen15c, X. Chen15b,at, Y. Chen82, Y-H. Chen46, H.C. Cheng63a, H.J. Cheng15a,15d, A. Cheplakov79, E. Cheremushkina123,
R. Cherkaoui El Moursli35e, E. Cheu7, K. Cheung64, T.J.A. Chevalérias145, L. Chevalier145, V. Chiarella51, G. Chiarelli71a, G. Chiodini67a, A.S. Chisholm36,21, A. Chitan27b, I. Chiu163, Y.H. Chiu176,
M.V. Chizhov79, K. Choi65, A.R. Chomont132, S. Chouridou162, Y.S. Chow120, M.C. Chu63a, J. Chudoba141, A.J. Chuinard103, J.J. Chwastowski84, L. Chytka130, K.M. Ciesla84, D. Cinca47, V. Cindro91, I.A. Cioar˘a27b, A. Ciocio18, F. Cirotto69a,69b, Z.H. Citron180, M. Citterio68a, D.A. Ciubotaru27b, B.M. Ciungu167, A. Clark54, M.R. Clark39, P.J. Clark50, C. Clement45a,45b, Y. Coadou101, M. Cobal66a,66c, A. Coccaro55b, J. Cochran78, H. Cohen161, A.E.C. Coimbra36, L. Colasurdo119, B. Cole39, A.P. Colijn120, J. Collot58, P. Conde Muiño140a,f, E. Coniavitis52, S.H. Connell33b, I.A. Connelly57, S. Constantinescu27b, F. Conventi69a,aw, A.M. Cooper-Sarkar135, F. Cormier175, K.J.R. Cormier167, L.D. Corpe94, M. Corradi72a,72b, E.E. Corrigan96, F. Corriveau103,ac, A. Cortes-Gonzalez36, M.J. Costa174, F. Costanza5, D. Costanzo149, G. Cowan93, J.W. Cowley32, J. Crane100, K. Cranmer124, S.J. Crawley57, R.A. Creager137, S. Crépé-Renaudin58, F. Crescioli136, M. Cristinziani24, V. Croft120, G. Crosetti41b,41a, A. Cueto5, T. Cuhadar Donszelmann149,
A.R. Cukierman153, S. Czekierda84, P. Czodrowski36, M.J. Da Cunha Sargedas De Sousa60b, J.V. Da Fonseca Pinto80b, C. Da Via100, W. Dabrowski83a, T. Dado28a, S. Dahbi35e, T. Dai105, C. Dallapiccola102, M. Dam40, G. D’amen23b,23a, V. D’Amico74a,74b, J. Damp99, J.R. Dandoy137, M.F. Daneri30, N.P. Dang181, N.D Dann100, M. Danninger175, V. Dao36, G. Darbo55b, O. Dartsi5,
A. Dattagupta131, T. Daubney46, S. D’Auria68a,68b, W. Davey24, C. David46, T. Davidek143, D.R. Davis49, E. Dawe104, I. Dawson149, K. De8, R. De Asmundis69a, M. De Beurs120, S. De Castro23b,23a,
S. De Cecco72a,72b, N. De Groot119, P. de Jong120, H. De la Torre106, A. De Maria15c, D. De Pedis72a, A. De Salvo72a, U. De Sanctis73a,73b, M. De Santis73a,73b, A. De Santo156, K. De Vasconcelos Corga101, J.B. De Vivie De Regie132, C. Debenedetti146, D.V. Dedovich79, A.M. Deiana42, M. Del Gaudio41b,41a, J. Del Peso98, Y. Delabat Diaz46, D. Delgove132, F. Deliot145, C.M. Delitzsch7, M. Della Pietra69a,69b, D. Della Volpe54, A. Dell’Acqua36, L. Dell’Asta73a,73b, M. Delmastro5, C. Delporte132, P.A. Delsart58, D.A. DeMarco167, S. Demers183, M. Demichev79, G. Demontigny109, S.P. Denisov123, D. Denysiuk120, L. D’Eramo136, D. Derendarz84, J.E. Derkaoui35d, F. Derue136, P. Dervan90, K. Desch24, C. Deterre46, K. Dette167, C. Deutsch24, M.R. Devesa30, P.O. Deviveiros36, A. Dewhurst144, S. Dhaliwal26,
F.A. Di Bello54, A. Di Ciaccio73a,73b, L. Di Ciaccio5, W.K. Di Clemente137, C. Di Donato69a,69b, A. Di Girolamo36, G. Di Gregorio71a,71b, B. Di Micco74a,74b, R. Di Nardo102, K.F. Di Petrillo59, R. Di Sipio167, D. Di Valentino34, C. Diaconu101, F.A. Dias40, T. Dias Do Vale140a, M.A. Diaz147a, J. Dickinson18, E.B. Diehl105, J. Dietrich19, S. Díez Cornell46, A. Dimitrievska18, W. Ding15b, J. Dingfelder24, F. Dittus36, F. Djama101, T. Djobava159b, J.I. Djuvsland17, M.A.B. Do Vale80c,
M. Dobre27b, D. Dodsworth26, C. Doglioni96, J. Dolejsi143, Z. Dolezal143, M. Donadelli80d, J. Donini38, A. D’onofrio92, M. D’Onofrio90, J. Dopke144, A. Doria69a, M.T. Dova88, A.T. Doyle57, E. Drechsler152, E. Dreyer152, T. Dreyer53, Y. Duan60b, F. Dubinin110, M. Dubovsky28a, A. Dubreuil54, E. Duchovni180, G. Duckeck114, A. Ducourthial136, O.A. Ducu109, D. Duda115, A. Dudarev36, A.C. Dudder99,
E.M. Duffield18, L. Duflot132, M. Dührssen36, C. Dülsen182, M. Dumancic180, A.E. Dumitriu27b, A.K. Duncan57, M. Dunford61a, A. Duperrin101, H. Duran Yildiz4a, M. Düren56, A. Durglishvili159b, D. Duschinger48, B. Dutta46, D. Duvnjak1, G.I. Dyckes137, M. Dyndal36, S. Dysch100, B.S. Dziedzic84, K.M. Ecker115, R.C. Edgar105, T. Eifert36, G. Eigen17, K. Einsweiler18, T. Ekelof172, M. El Kacimi35c, R. El Kosseifi101, V. Ellajosyula172, M. Ellert172, F. Ellinghaus182, A.A. Elliot92, N. Ellis36,
J. Elmsheuser29, M. Elsing36, D. Emeliyanov144, A. Emerman39, Y. Enari163, J.S. Ennis178, M.B. Epland49, J. Erdmann47, A. Ereditato20, M. Errenst36, M. Escalier132, C. Escobar174,
O. Estrada Pastor174, E. Etzion161, H. Evans65, A. Ezhilov138, F. Fabbri57, L. Fabbri23b,23a, V. Fabiani119, G. Facini94, R.M. Faisca Rodrigues Pereira140a, R.M. Fakhrutdinov123, S. Falciano72a, P.J. Falke5, S. Falke5, J. Faltova143, Y. Fang15a, Y. Fang15a, G. Fanourakis44, M. Fanti68a,68b, A. Farbin8, A. Farilla74a, E.M. Farina70a,70b, T. Farooque106, S. Farrell18, S.M. Farrington178, P. Farthouat36, F. Fassi35e,
P. Fassnacht36, D. Fassouliotis9, M. Faucci Giannelli50, W.J. Fawcett32, L. Fayard132, O.L. Fedin138,o, W. Fedorko175, M. Feickert42, S. Feigl134, L. Feligioni101, A. Fell149, C. Feng60b, E.J. Feng36, M. Feng49, M.J. Fenton57, A.B. Fenyuk123, J. Ferrando46, A. Ferrante173, A. Ferrari172, P. Ferrari120, R. Ferrari70a, D.E. Ferreira de Lima61b, A. Ferrer174, D. Ferrere54, C. Ferretti105, F. Fiedler99, A. Filipˇciˇc91,
F. Filthaut119, K.D. Finelli25, M.C.N. Fiolhais140a, L. Fiorini174, F. Fischer114, W.C. Fisher106, I. Fleck151, P. Fleischmann105, R.R.M. Fletcher137, T. Flick182, B.M. Flierl114, L.F. Flores137, L.R. Flores Castillo63a, F.M. Follega75a,75b, N. Fomin17, G.T. Forcolin75a,75b, A. Formica145, F.A. Förster14, A.C. Forti100, A.G. Foster21, M.G. Foti135, D. Fournier132, H. Fox89, P. Francavilla71a,71b, S. Francescato72a,72b, M. Franchini23b,23a, S. Franchino61a, D. Francis36, L. Franconi20, M. Franklin59, A.N. Fray92, B. Freund109, W.S. Freund80b, E.M. Freundlich47, D.C. Frizzell128, D. Froidevaux36, J.A. Frost135, C. Fukunaga164, E. Fullana Torregrosa174, E. Fumagalli55b,55a, T. Fusayasu116, J. Fuster174, A. Gabrielli23b,23a, A. Gabrielli18, G.P. Gach83a, S. Gadatsch54, P. Gadow115, G. Gagliardi55b,55a, L.G. Gagnon109, C. Galea27b, B. Galhardo140a, G.E. Gallardo135, E.J. Gallas135, B.J. Gallop144,