HAL Id: hal-01507098
https://hal.archives-ouvertes.fr/hal-01507098
Submitted on 12 Apr 2017
HAL is a multi-disciplinary open access
archive for the deposit and dissemination of
sci-entific research documents, whether they are
pub-lished or not. The documents may come from
teaching and research institutions in France or
abroad, or from public or private research centers.
L’archive ouverte pluridisciplinaire HAL, est
destinée au dépôt et à la diffusion de documents
scientifiques de niveau recherche, publiés ou non,
émanant des établissements d’enseignement et de
recherche français ou étrangers, des laboratoires
publics ou privés.
Evaluation of fusion methods for crop monitoring
purposes
Mar Bisquert, Agnès Bégué, Pascal Poncelet, Maguelonne Teisseire
To cite this version:
Mar Bisquert, Agnès Bégué, Pascal Poncelet, Maguelonne Teisseire. Evaluation of fusion methods for
crop monitoring purposes. IGARSS: International Geoscience and Remote Sensing Symposium, Jul
2014, Québec, Canada. pp.1429-1432, �10.1109/IGARSS.2014.6946704�. �hal-01507098�
EVALUATION OF FUSION METHODS FOR CROP MONITORING PURPOSES
M. Bisquert
1,2,*, A. Bégué
3, P. Poncelet
1, M. Teisseire
21
LIRMM, UM2, 161 Rue Ada, 34095, Montpellier (France)
2
IRSTEA, UMR TETIS, Maison de la Télédétection, 500 rue J.-F. Breton, 34093 Montpellier (France)
3CIRAD, UMR TETIS, Maison de la Télédétection, 500 rue J.-F. Breton, 34093 Montpellier (France)
ABSTRACT
In this contribution we present a local evaluation procedure of Landsat-MODIS fusion methods for crop monitoring purposes. Two fusion methods are applied to obtain a two-year time series of Landsat-resolution images. The validation is applied at pixel level in order to analyze if the simulated images are capable of unmixing coarse-resolution pixels and obtaining an accurate temporal profile of the high-resolution pixels near the boundaries between two fields. The experiment has been conducted in two neighbor fields and results have shown that the temporal profile of these high-resolution pixels agrees with the temporal profile of a pure coarse-resolution pixel in the corresponding field. They highlight that the simulated images allow identifying the membership of the high-resolution simulated pixels to one field or the neighbor one.
Index Terms — MODIS-Landsat fusion, remote
sensing, validation
1. INTRODUCTION
The knowledge of the vegetation phenology is important for many purposes including land cover classification and vegetation monitoring. In [1] the vegetation phenology is used for obtaining an accurate regional land cover classification and afterwards for studying the effect of extreme meteorological conditions on the different land covers previously identified. The agricultural monitoring systems need to have dense temporal information, as it is known that agricultural production follows strong seasonal patterns and depends highly on climate and management practices [2]. For vegetation monitoring purposes, remote sensing has proved to be a very valuable tool.
In natural vegetation patches, such as forests or rangelands, a low/medium spatial resolution (hecto- to kilometric) is appropriate, and earth-observing systems providing this spatial information on a daily step exist (MODIS, MERIS, VGT…). For crop monitoring, the problem is different, as most of the fields need high/very high resolution (decametric to metric) images that usually have the constraint of having low temporal frequency (e.g.
16 days for Landsat), and in some cases, high economic cost of the images (high frequency image tasking is generally not affordable for agriculture applications). Furthermore, low temporal frequency has an additional problem in regions frequently cloudy. Actually the presence of clouds may lead to long periods were none image can be acquired. In this context fusion methods are highly valuable because they allow to simulate images at high spatial resolution in dates where only information at coarse spatial resolution is available [3]. Fusion methods usually combine the information of at least one pair of high and coarse spatial resolution images as in the STARFM (Spatio Temporal
Adaptive Reflectance Fusion Method) [4] and ESTARFM
(Enhanced Spatio Temporal Adaptive Reflectance Fusion
Method) [5]. In [6] a simple fusion method WA (Weighted Average) was developed which only needs two input
images: a high spatial resolution image at no matter which date (obviously closer dates lead to better results) and a coarse spatial resolution image at the date to be simulated or at a close date. This method uses soft operators and is based on the temporal distance between the input images and the timestamp of the image to be simulated. Evaluation techniques of the fusion methods are usually based in global statistics, such as correlation coefficient, root mean square error (RMSE) and mean absolute deviation (MAD). However, the evaluation method should be adapted to the specific objective of the simulated images.
The objective of the present work is to go further the statistical evaluation of the fusion methods by proposing a thematic evaluation focused on time series crop monitoring. Simulated images are obtained by using the fusion methods ESTARFM and WA presented in [5] and [6]. These methods were applied to fuse Landsat and MODIS (MODerate Imaging Spectroradiometer) images in an agricultural region of Brazil. In this sense we examine the quality of the temporal profile of a specific crop extracted from the temporal series of high resolution images (Landsat) including the simulated images, compared to the temporal profiles obtained from coarse-resolution images (MODIS). The quality of the simulated images is therefore analyzed at pixel level.
The remainder of this paper is organized as follows: Section 2 presents the data used, Section 3 describes the
fusion methods and the evaluation methodology applied, Section 4 shows the evaluation results and Section 5 summarizes the main conclusions.
2. DATA
The study area is a well-known region of Brazil with important plantations of Eucalyptus [7]. Therefore the crop selected in this study corresponds to Eucalyptus.
MODIS images are used as coarse-spatial resolution images. Specifically the product MOD13Q1 with 250 m spatial resolution and 16-day composites has been selected. 21 images of the year 2009 and 21 of the year 2010 have been downloaded.
As high resolution, the product Landsat Surface Reflectance Climate Data Record has been selected. This product provides surface reflectances from Landsat 5 satellite with 30 m spatial resolution and 16 days revisit cycle. Six Landsat images were available for 2009 (corresponding to the dates 02/01, 04/22, 05/24, 08/12, 08/25 and 09/13; unfortunately the image of 09/13 presented an important cloud coverage) and three for 2010 (03/02, 08/28 and 11/03).
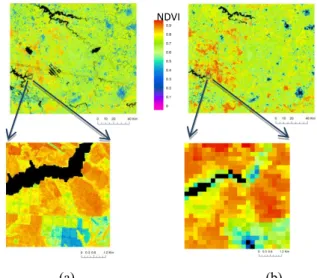
Figure 1 shows an example of the study area from the Landsat and the MODIS images. We can notice that parcels can be easily identified in the Landsat image, while not in the MODIS one.
3. METHODOLOGY
Considering that we have a dense temporal series of coarse-spatial resolution images and a scarce temporal series of high resolution images, the first step consists in applying the fusion methods ESTARFM and WA [5, 6] for simulating NDVI (Normalized Difference Vegetation Index) images at the Landsat spatial resolution in those dates where no Landsat images are available. This leads to obtain an enriched temporal series of high resolution (real + simulated) images.
The fusion method developed in [6] combines a coarse-resolution image near the date to simulate (target) and a high-resolution image in a different date. This method is based on the temporal distance between the input images and the target image. The first step is radiometrically normalizing the Landsat images to the MODIS ones. Afterwards the MODIS images are up-scaled to the Landsat resolution. Finally the weighted average (WA) per pixel is obtained, where the weight is related to the temporal distance between each input image and the target image by using the following equation:
𝑊𝐴(𝐻, 𝐿) = ( )∗( ) ( )∗( ) (1)
where H and L reference respectively high and low-resolution pixels (Landsat and MODIS), and the µ’s stand
for the weights assigned to each image and are calculated as follows:
If t0 ti < t then 𝜇𝑡
(
𝑡𝑖)
= (𝑡𝑖− 𝑡0) (𝑡 − 𝑡⁄
0)If t ti < tE then 𝜇 (𝑡 ) = (𝑡 − 𝑡 ) (𝑡 − 𝑡 )⁄
where ti corresponds to the timestamp of the high or
low-resolution image, and t0 and tE are timestamps identified
outside the temporal range of the input and output images being used.
The ESTARFM (Enhanced Spatio Temporal Fusion
Method) [5] needs two high resolution images and three
coarse-resolution images as inputs and is much more complex.
For the thematic validation we intend to analyze if the simulated high-resolution pixels near a boundary between two parcels can be identified as belonging to one parcel or the neighbor one and reproduce the temporal profile of the corresponding field. The following experiment has been performed (Cf. Figure 2): pure coarse-resolution pixels have been identified in two neighboring eucalyptus fields, and four mixed coarse-resolution pixels were identified along the boundary of both fields. Several high-resolution pixels corresponding to the mixed coarse-resolution ones have been identified at each side of the boundary, belonging to one or the other field. The NDVI temporal profile for the high-resolution pixels have been extracted from the enriched Landsat time series (including the available and the simulated images) and averaged for each field. Moreover the temporal profiles of the pure coarse-resolution pixels inside each field have been extracted from the MODIS time series. This experiment allows verifying if the simulated images are capable to unmix pixels at high resolution belonging to the same mixed coarse-resolution pixel.
(a) (b)
Fig. 1. Example of the study area seen by: a) Landsat
(image corresponding to 04/22/2009 normalized using image in Figure1b), and b) MODIS composite image (04/07/2009-04/22/2009).
Fig. 2. Eucalyptus parcels (A and B) selected for the
validation at local scale. Two pure coarse-resolution pixels (1, 2) are identified in the parcels, while four mixed coarse-pixels (3-6) are identified along the boundary between the two parcels. In each mixed coarse-pixel several high resolution pixels are identified belonging either to parcel A or to parcel B.
4. RESULTS AND DISCUSSION
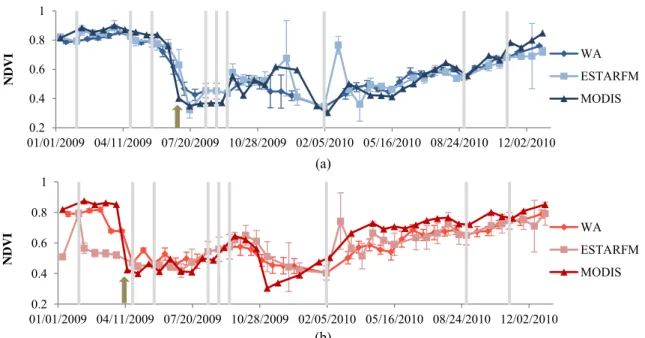
In figure 3 we present the temporal profiles corresponding to the pure coarse-resolution pixels (extracted from MODIS temporal series) and the high resolution pixels (extracted from the enriched time series) belonging to the two fields: field A (Figure 3a) and field B (Figure 3b). Both fields correspond to eucalyptus plantations that have been cut at
different dates (Figure 3). A good agreement between the temporal profile obtained from the Landsat enriched time series and the MODIS time series is observed for both fields. Moreover we observe how the profiles obtained from the high-resolution pixels of each field are different, which shows the ability of identifying the membership of the simulated pixels to one or the other field.
ESTARFM and WA are generally performing similar except for some dates where ESTARFM leads to some anomalies in the NDVI values. Good overall results are obtained for the temporal profile with both methods except when sharp changes are present; in this case none of the fusion methods analyzed is able to identify this sharp change but identifies a monotone one. Figure 3 shows a sharp change for each field (arrows) representing the clear-cut harvest of the eucalyptus field. MODIS temporal series identifies this harvest date showing a sharp drop of the NDVI, while with the simulated images a monotone drop is observed.
Figure 4 illustrates two examples of the original and simulated images. One can observe how both simulated images are able to correctly identify the boundary between the two parcels analyzed which is not identifiable in the MODIS image. In the case of 05/24 both simulated images show similar values to the original one, however in the second one (08/28) the ESTARFM presents important errors in the left field. This is not the case in the WA method.
(a)
(b)
Fig. 3. Temporal profiles obtained for the pure coarse-resolution pixels (MODIS), and the average values of the
high-resolution pixels in: a) parcel A, b) parcel B. Temporal profiles of the high-high-resolution pixels are obtained from the enriched time series using WA and ESTARFM methods. Vertical lines correspond to Landsat image acquisition dates. Arrows correspond to the eucalyptus harvest dates identified from MODIS temporal series.
0.2 0.4 0.6 0.8 1 01/01/2009 04/11/2009 07/20/2009 10/28/2009 02/05/2010 05/16/2010 08/24/2010 12/02/2010 ND V I WA ESTARFM MODIS 0.2 0.4 0.6 0.8 1 01/01/2009 04/11/2009 07/20/2009 10/28/2009 02/05/2010 05/16/2010 08/24/2010 12/02/2010 NDV I WA ESTARFM MODIS 1 2 3 4 5 6 A B
Date Landsat original ESTARFM WA MODIS
05/24/2009
08/28/2009
Fig.4. Example of original (Landsat and MODIS) and simulated (ESTARFM and WA) images for two dates of 2009.
MODIS pur (red) and mixed (white) pixels used for obtaining the temporal profiles are represented.
5. CONCLUSIONS
This study shows a local evaluation procedure of simulated images for monitoring purposes. A two-year time series of Landsat-resolution images is obtained including 9 Landsat images and 35 simulated images. The evaluation procedure has focused on a boundary between two fields which is not identifiable with the coarse-resolution images. We have shown that the simulated images allow identifying the high-resolution pixels belonging to each field and obtaining a temporal profile which agrees with the temporal profiles obtained from pure coarse-resolution pixels inside each field in the case of monotone changes. Therefore the simulated images are highly valuable for monitoring purposes as well as for any application needing temporal series, such as for classification purposes. However the presence of abrupt changes (harvest, fire…) is not well achieved with the simulated images, an adaptation of the method is being considered for identifying these sharp changes.
Acknowledgements
This work was supported by public funds received in the framework of GEOSUD, a project (ANR-10-EQPX-20) of the program ‘Investissements d’Avenir’ managed by the French National Research Agency.
6. REFERENCES
[1] B. A. Bradley and J. F. Mustard, “Comparison of phenology trends by land cover class: a case study in the Great Basin, USA,” Glob. Change Biol., vol. 14, no. 2, pp. 334-346, 2008.
[2] C. Atzberger, “Advances in Remote Sensing of Agriculture: Context Description, Existing Operational Monitoring Systems and Major Information Needs,” Remote Sens., vol. 5, no. 2, pp. 949–981, Feb. 2013.
[3] J. Amorós-López, L. Gómez-Chova, L. Alonso, L. Guanter, R. Zurita-Milla, J. Moreno, and G. Camps-Valls, “Multitemporal fusion of Landsat/TM and ENVISAT/MERIS for crop monitoring,” Int. J. Appl. Earth Obs. Geoinformation, vol. 23, no. 0, pp. 132–141, Aug. 2013.
[4] Feng Gao, J. Masek, M. Schwaller, and F. Hall, “On the blending of the Landsat and MODIS surface reflectance: predicting daily Landsat surface reflectance,” Geosci. Remote
Sens. IEEE Trans. On, vol. 44, no. 8, pp. 2207–2218, Aug.
2006.
[5] X. Zhu, J. Chen, F. Gao, X. Chen, and J. G. Masek, “An enhanced spatial and temporal adaptive reflectance fusion model for complex heterogeneous regions,” Remote Sens.
Environ., vol. 114, no. 11, pp. 2610–2623, Nov. 2010.
[6] M. Bisquert, G. Bordogna, M. Boschetti, P. Poncelet, and M. Teisseire, “Soft Fusion of Heterogeneous Image Time Series,”
Proceedings of the 15th International Conference on Information Processing and Management of Uncertainty in Knowledge-based Systems, Jul-2014.
[7] G. le Maire, C. Marsden, W. Verhoef, F. J. Ponzoni, D. Lo Seen, A. Bégué, J.-L. Stape, and Y. Nouvellon, “Leaf area index estimation with MODIS reflectance time series and model inversion during full rotations of Eucalyptus plantations,” Remote Sens. Environ., vol. 115, no. 2, pp. 586– 599, Feb. 2011.
NDVI