Publisher’s version / Version de l'éditeur:
Optics Express, 25, 3, pp. 2413-2421, 2017-02-06
READ THESE TERMS AND CONDITIONS CAREFULLY BEFORE USING THIS WEBSITE. https://nrc-publications.canada.ca/eng/copyright
Vous avez des questions? Nous pouvons vous aider. Pour communiquer directement avec un auteur, consultez la première page de la revue dans laquelle son article a été publié afin de trouver ses coordonnées. Si vous n’arrivez pas à les repérer, communiquez avec nous à [email protected].
Questions? Contact the NRC Publications Archive team at
[email protected]. If you wish to email the authors directly, please see the first page of the publication for their contact information.
This publication could be one of several versions: author’s original, accepted manuscript or the publisher’s version. / La version de cette publication peut être l’une des suivantes : la version prépublication de l’auteur, la version acceptée du manuscrit ou la version de l’éditeur.
For the publisher’s version, please access the DOI link below./ Pour consulter la version de l’éditeur, utilisez le lien DOI ci-dessous.
https://doi.org/10.1364/OE.25.002413
Access and use of this website and the material on it are subject to the Terms and Conditions set forth at
Sequential signal detection for high dynamic range time-resolved
laser-induced incandescence
Mansmann, Raphael; Thomson, Kevin; Smallwood, Greg; Dreier, Thomas;
Schulz, Christof
https://publications-cnrc.canada.ca/fra/droits
L’accès à ce site Web et l’utilisation de son contenu sont assujettis aux conditions présentées dans le site LISEZ CES CONDITIONS ATTENTIVEMENT AVANT D’UTILISER CE SITE WEB.
NRC Publications Record / Notice d'Archives des publications de CNRC:
https://nrc-publications.canada.ca/eng/view/object/?id=735bd513-4905-47d3-92b6-51deab652996 https://publications-cnrc.canada.ca/fra/voir/objet/?id=735bd513-4905-47d3-92b6-51deab652996Sequential signal detection for high dynamic
range time-resolved laser-induced
incandescence
R
APHAELM
ANSMANN,
1,*K
EVINT
HOMSON,
2G
REGS
MALLWOOD,
2T
HOMASD
REIER,
1ANDC
HRISTOFS
CHULZ11
Institute for Combustion and Gas Dynamics (IVG) and Center for Nanointegration Duisburg-Essen (CENIDE), University of Duisburg-Essen, Germany
2
National Research Council Canada, Ottawa, Canada
Abstract: A new method for collecting time-resolved laser-induced incandescence
(TiRe-LII) signals with high dynamic range is presented. Gated photomultiplier tubes (PMT) are used to detect temporal sections of the LII signal. This helps to overcome the limitations of PMTs caused by restricted maximum signal current at the strong initial signal and poor signal-to-noise ratios when the signal intensity approaches the noise level. We present a simple method for increasing the accuracy of two-color pyrometry at later decay times and two advanced strategies for getting high accuracy over the complete temperature trace or even achieve single-shot capability with high dynamic range. Validation measurements in a standardized flame show that the method is sensitive enough to even resolve the local increase in gas temperature as a consequence of heating the soot particles with a laser pulse.
© 2017 Optical Society of America
OCIS codes: (120.0120) Instrumentation, measurement, and metrology; (120.1740) Combustion diagnostics;
(350.4990) Particles.
References and links
1. L. A. Melton, “Soot diagnostics based on laser heating,” Appl. Opt. 23(13), 2201–2208 (1984). 2. H. A. Michelsen, C. Schulz, G. J. Smallwood, and S. Will, “Laser-induced incandescence: Particulate
diagnostics for combustion, atmospheric, and industrial applications,” Prog. Energy Combust. Sci. 51, 2–48 (2015).
3. T. Lehre, B. Jungfleisch, R. Suntz, and H. Bockhorn, “Size distributions of nanoscaled particles and gas temperatures from time-resolved laser-induced-incandescence measurements,” Appl. Opt. 42(12), 2021–2030 (2003).
4. S. De Iuliis, F. Cignoli, and G. Zizak, “Two-color laser-induced incandescence (2C-LII) technique for absolute soot volume fraction measurements in flames,” Appl. Opt. 44(34), 7414–7423 (2005).
5. S. Will, S. Schraml, and A. Leipertz, “Two-dimensional soot-particle sizing by time-resolved laser-induced incandescence,” Opt. Lett. 20(22), 2342–2344 (1995).
6. K. J. Daun, B. J. Stagg, F. Liu, G. J. Smallwood, and D. R. Snelling, “Determining aerosol particle size distributions using time-resolved laser-induced incandescence,” Appl. Phys. B 87(2), 363–372 (2007). 7. A. Tosi, A. Dalla Mora, F. Zappa, A. Gulinatti, D. Contini, A. Pifferi, L. Spinelli, A. Torricelli, and R. Cubeddu,
“Fast-gated single-photon counting technique widens dynamic range and speeds up acquisition time in time-resolved measurements,” Opt. Express 19(11), 10735–10746 (2011).
8. D. R. Snelling, G. J. Smallwood, F. Liu, Ö. L. Gülder, and W. D. Bachalo, “A calibration-independent laser-induced incandescence technique for soot measurement by detecting absolute light intensity,” Appl. Opt. 44(31), 6773–6785 (2005).
9. D. R. Snelling, K. A. Thomson, F. Liu, and G. J. Smallwood, “Comparison of LII derived soot temperature measurements with LII model predictions for soot in a laminar diffusion flame,” Appl. Phys. B 96(4), 657–669 (2009).
10. C. Schulz, B. F. Kock, M. Hofmann, H. Michelsen, S. Will, B. Bougie, R. Suntz, and G. Smallwood, “Laser-induced incandescence: recent trends and current questions,” Appl. Phys. B 83(3), 333–354 (2006). 11. T. P. Jenkins and R. K. Hanson, “Soot pyrometry using modulated absorption/emission,” Combust. Flame
126(3), 1669–1679 (2001).
12. F. Liu, D. R. Snelling, K. A. Thomson, and G. J. Smallwood, “Sensitivity and relative error analyses of soot temperature and volume fraction determined by two-color LII,” Appl. Phys. B 96(4), 623–636 (2009).
#279215 https://doi.org/10.1364/OE.25.002413
13. E. Nordström, N.-E. Olofsson, J. Simonsson, J. Johnsson, H. Bladh, and P.-E. Bengtsson, “Local gas heating in sooting flames by heat transfer from laser-heated particles investigated using rotational CARS and LII,” Proc. Combust. Inst. 35(3), 3707–3713 (2015).
14. Ö. L. Gülder, D. R. Snelling, and R. A. Sawchuk, “Influence of hydrogen addition to fuel on temperature field and soot formation in diffusion flames,” Proc. Combust. Inst. 26(2), 2351–2358 (1996).
1. Introduction
Time-resolved laser-induced incandescence (TiRe-LII) is a well-established in situ measurement method for soot particle concentration and primary particle-sizes [1–3]. Two-color (2C) pyrometry is frequently used for detecting the particle temperature by measuring the ratio of LII signals in two wavelength bands [2–6]. The signal-to-noise ratio (SNR) of LII measurements strongly decreases with signal duration because of the exponential decay of the signal intensity following the initial heat-up of the gas-borne particles with a pulsed laser. For fast decaying LII signals (e.g., very small particles, elevated pressure, large differences between particle peak temperature and local gas temperature) the dynamic range of the detection system is important for retrieving a temperature trace that can be used for comparison with LII models.
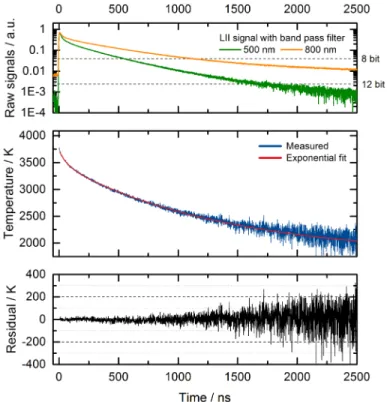
Figure 1 gives an example of the strongly varying temperature results at the end of the signal decay period due to low signal levels (middle) and the deviation from a double exponential fit (bottom). The temperature trace was calculated from averaged LII signals (top) over 100 laser shots, further averaging does not provide significant improvement. Analog digital converter (ADC) quantization resolution for 8 bit and 12 bit is indicated for the 800 nm and 500 nm channels, respectively, to demonstrate the limits for single-shot acquisition.
Fig. 1. Example for a typical temperature trace of LII in-flame measurements starting from the signal peak. Temperatures (blue) are calculated from the ratio of two LII signals in two different wavelength ranges (orange/green) using a relative channel calibration, double exponential regression (red) and the residual between fit and measured data (black).
In TiRe-LII, signals are detected with fast photomultiplier tubes (PMTs, typically < 1 ns response time). The dynamic range relevant in this application needs to be distinguished between the dynamic range for a fixed detector setting and the total dynamic range of the LII setup with detector settings adjusted to the respective signal levels.
When measuring LII signals, the signal peak represents the upper limit of the dynamic range. Due to non-linear behavior and saturation effects, the maximum PMT anode current needs to be limited at this maximum signal value. This can be achieved by attenuation of light by appropriate neutral density filters and adjustment of the PMT gain control voltage.
The lower limit of the dynamic range is the vertical resolution of the analog digital converter of the oscilloscope. As a result, the decreasing signal-to-noise ratio during the (approximately exponential) signal decay limits the detection time despite the fact that the signal intensity at later times is still on a level that could be detected with PMTs. The PMT gain control voltage, however, requires a settling time of 100 ms to 2 s (specified by the manufacturer) and thus cannot be adjusted to the varying signal level during a single signal trace; the same applies for the neutral density filter.
Thus, in the conventional arrangement, only a fraction of the total dynamic range of PMTs can be used. Here, we show that the combination of gated photomultipliers with switching of neutral density filters and gain voltage variation allows one to overcome this limitation, and thus dramatically improve the quality of TiRe-LII measurements.
Tosi et al. [7] presented a method to increase the dynamic range in time-correlated single-photon counting (TCSPC) with time-gated single-single-photon avalanche diodes (SPAD). There, delayed gating of the SPAD was used to prevent the detection of unwanted photons in the initial part of the signal trace thus prolonging the signal recording to later times. There is a fundamental difference compared to the intensity-based measurements presented in the present paper. Single-photon counting techniques rely on high repetition frequencies and large numbers of samples and can work with ultra-low laser powers. LII in contrast requires a minimum laser fluence in the range of 0.5 to 1 mJ/mm2 to generate measurable signals and has a long signal lifetime in the range of up to several microseconds. LII is thus not suitable for the high-repetition-rate lasers usually used for TCSPC.
2. Method
Gated photomultiplier tubes (PMT) can be triggered with variable delay with respect to the laser pulse to discard the high-intensity portion of the LII signal trace. The low-intensity portion of the signal can then be measured with reduced or no optical signal attenuation and at increased gain, resulting in dramatically increased SNR. The various sections of the LII signal can thus be measured taking advantage of the full dynamic range of the LII setup.
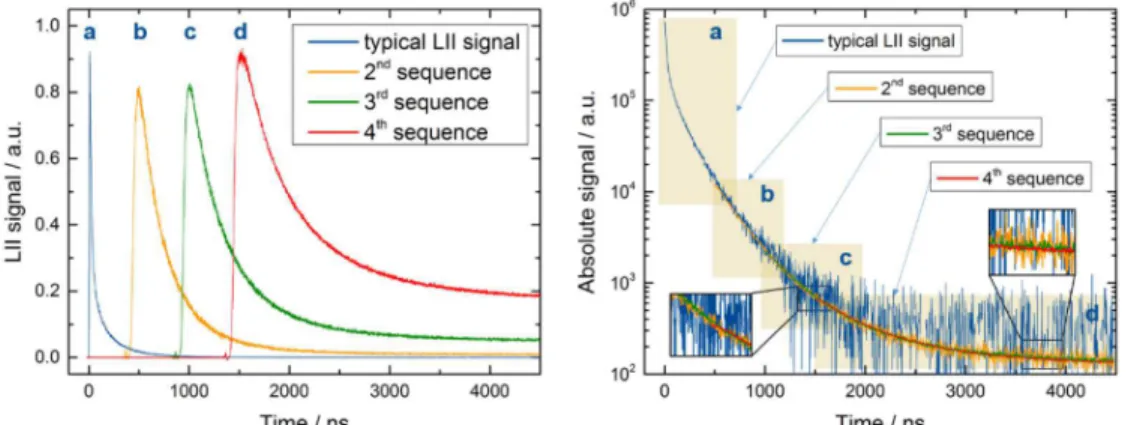
Figure 2 (left) illustrates the method starting from the typical LII signal (trace a). From trace b to d (i.e., 2nd to 4th sequence), the PMT gate delay is increased by 500 ns increments and therefore the initial part of the LII signal is suppressed. For each sequence, appropriate neutral density (ND) filters are selected and the gain is adjusted to ensure similar peak signal intensities at the beginning of each signal trace to maximize the SNR. Additional delays can be used until optical signal attenuation is not required anymore and the PMT gain cannot be further increased. The absolute signals (Fig. 2, right) can then be calculated for each sequence using an absolute light-intensity calibration and gain correction [8]. With this approach, called high-dynamic range TiRe-LII (or HDR-TiRe-LII), the LII signal is detected in multiple segments resulting in a much improved signal quality (Fig. 2, right).
Fig. 2. Principle of the basic sequential detection technique: Raw signals (left) are used to calculate absolute signals (right); (a) typical LII signal, (b–d) Sequential detection technique applied three times.
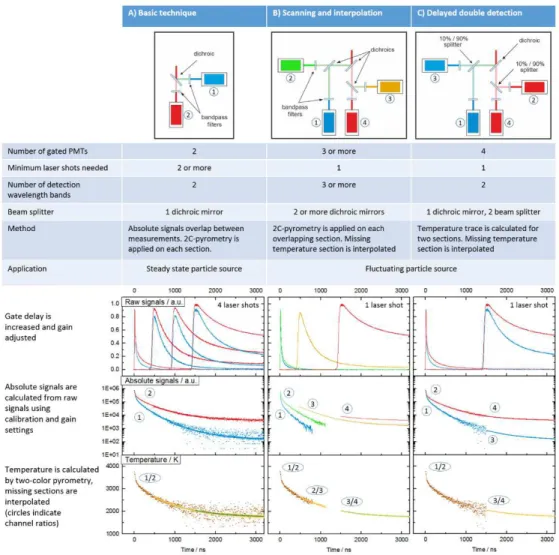
Table 1 shows various possible configurations of this detection technique. The basic principle (Table 1-A) uses one gated PMT for each of the two colors that are required for two-color LII. A series of subsequent experiments provides the high dynamic range. For each single experiment, the evaluation of signal ratios yields particle temperature traces for a limited part of the decay curve that then can be combined to reconstruct the full temperature trace.
This method can be extended by increasing the number of gated PMTs to provide improved accuracy while maintaining single-shot capability. The scanning and interpolation technique (Table 1-B) uses three or more gated photomultipliers in different wavelength bands, which result from the combination of dichroic and bandpass filter transmissions. Two PMTs are used to collect the entire LII signal trace and any additional PMT is delayed to an appropriate later time. The signal of two PMT channels must overlap to allow for temperature detection. Sections where only a single channel is collected can be interpolated with high fidelity because of the near-exponential characteristics of the LII decay at later times. The wavelength bands should be selected to detect shorter wavelengths at the beginning and longer wavelengths at the later section of the signal according to Wien’s displacement law causing a red-shift of the signal with time during particle cooling.
The delayed double detection strategy (Table 1-C) requires four gated PMTs, two at each of the two detection wavelengths. The LII signal is split by a dichroic mirror and then by two beam splitters on the four detectors. Each wavelength channel is detected by two PMTs with different gate delays. The temperature trace can be collected for two sections and the missing section in between can be interpolated. The beam splitter should be selected so that the PMT with the early gate starting time receives a smaller fraction of the signal, while the PMTs with the later gate starting time capture a larger fraction of the signal (e.g., 10:90 split ratio).
While technique A can only be applied on a steady source where particle size and morphology does not change between laser pulses, such as in steady laminar flames, techniques B and C are instantaneous, and suitable for all sources, including those that are unsteady or turbulent.
Table 1. Schematic comparison of basic (A) and two advanced (B and C) sequential detection techniques: circled numbers denote respective PMT detectors and generated
signal (and temperature) traces.
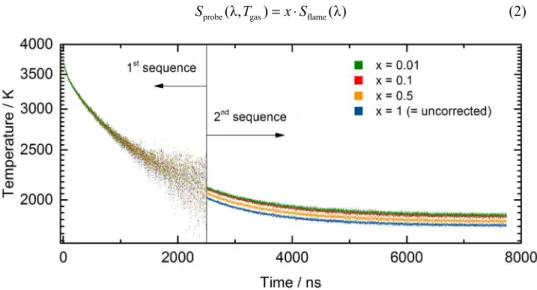
When using this technique in flames where the flame temperature is still in the range that can be detected with two-color pyrometry (i.e., >1500 K), the pulsed LII signal is accompanied by a DC signal resulting from flame radiation. Snelling et al. [9] presented a method to correct for this bias by splitting the measured radiation into flame radiation and radiation from the probe volume. Because the fraction of the soot radiation that comes from the unheated soot in the probe volume is unknown, an iterative correction procedure is used. In our case with gated PMT detection, the baseline before the gate opening (zero-level) and after gate opening Sflame (flame radiation) can be measured. Equation (1) shows how the DC corrected signal Sprobe can be estimated, which can then be used to determine the unbiased two-color temperature trace. The contribution from flame radiation is subtracted from the measured signal Stotal and the contributing part from the probe volume Sprobe is added again.
probe(λ, ) total(λ, ) flame(λ) probe(λ, gas)
S T =S T −S +S T (1)
Since Sprobe(λ,Tgas) is unknown, we estimate the radiation from the probe volume through the geometrically defined ratio of probe volume to total measurement volume x.
probe(λ, gas) flame(λ)
S T =x S⋅ (2)
Fig. 3. Temperature trace (log scale) calculated from two sequences and corrected for flame radiation (1750 K) as a function of probe volume to total measurement volume ratio x
Figure 3 shows temperature traces calculated by sequential signal detection and corrected for different ratios of probe volume and total measurement volume. The strongest deviation occurs for very small probe-volume-to-total-volume ratios and high flame temperatures. For example, when the probe volume is only 1% of the total measurement volume and the flame temperature is 1750 K, the temperature is underestimated up to a maximum of 85 K at later decay times.
3. Experiment
Validation measurements were performed using a laminar non-premixed flame (Gülder burner) which has been investigated by TiRe-LII previously [8,10]. The burner is operated at its standard conditions of 0.194 slpm ethene and 284 slpm air. The soot particles are heated by pulses (8 ns FWHM) from an Nd:YAG laser at 1064 nm. A square (2.4 × 2.4 mm2) laser beam profile was produced by an aperture and relay-imaged to the measurement position. For all measurements, the laser fluence was set to 1.5 mJ/mm2. Two plano-convex lenses were used to image the cylindrical probe volume (1 mm diameter, 2.4 mm length) into a 1-mm diameter fiber. The light exiting the fiber was collimated, split by a dichroic beamsplitter (Semrock FF605-Di02), and focused on two gated PMTs (Hamamatsu H11526-20). Bandpass filters with a center wavelength of 500 nm (Semrock FF01-500/24) and 800 nm (Semrock FF01-800/12) were attached to the two PMTs, respectively. To avoid saturation for the initial high-intensity signals, neutral-density filters were used to attenuate the signal. Signals were collected with a 500-MHz oscilloscope (PicoScope 6404C) with a vertical resolution of 8 bit and 0.8-ns sampling intervals. The triggering of laser and PMT gate time was controlled by a digital delay/pulse generator.
4. Results
The basic sequential detection technique (Table 1-A) was applied with three gating time steps in the flame at a height above burner of 42 mm. Laser fluence, measurement position and PMT gain were kept constant and the PMT delay was varied. For each sequence, appropriate neutral density filters (transmission of 1, 10, and 79%) were used to prevent saturation of the detectors.
The temperature trace was calculated by applying Eq. (3) [9,11] for each data point assuming a constant ratio of the absorption function E(mλ1)/E(mλ2) = 1.
(
)
(
)
(
)
(
)
2 1 1 6 λ λ 1 p 0 1 p 2 1 λ 2 p λ 2 λ , λ 1 1 λ λ λ , λ B E m I T h c T ln k I T E m − = − (3)with the particle temperature Tp, the Planck constant h, the speed of light in vacuum c0, the Boltzmann constant kB, the detection wavelengths λ (i.e., the center wavelengths of the 500 and 800 nm bandpass filters), and the absolute spectral intensity Iλ. The sensitivity and error analyses of soot temperature determined by two-color LII were previously published by Liu et al. [12].
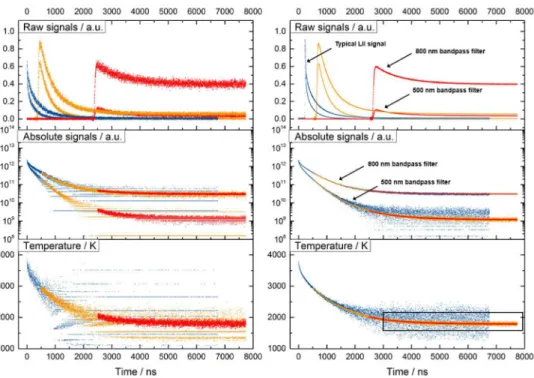
Figure 4 shows a comparison of signal processing results between single-shot (left) and multi-signal average of 100 laser shots (right) starting from the raw signals for three different gate delay times (top). Absolute signals are calculated using the instrument and filter calibrations (middle). The temperature trace (bottom) is calculated by two-color pyrometry using Eq. (3). Particles reach a maximum temperature of 3820 K and approach the local gas temperature of 1790 K at about 7 µs after the signal peak.
Fig. 4. Comparison of single-shot (left) and multi-shot analysis (right) (100 laser shots); Absolute signals (middle graphs) are calculated from raw signals (upper graphs) using spectral calibration and gain settings; Temperature (lower graphs) calculated by two-color pyrometry; the portion covered by the rectangle is enlarged in Fig. 5. The following ND filters were used: (blue: 1%, orange: 10%, red: 79%).
For the single-shot signals, quantization noise caused by the restricted vertical resolution of the ADC can already be seen after 1 µs in the absolute signals as multiple horizontal lines (blue curve). By using the detector arrangement of technique C (Table 1), a full temperature trace can even be measured for a single laser shot.
The improved capability of this technique is demonstrated by measuring the gas heat-up as a consequence of laser-induced particle heating. While LII is considered a non-intrusive technique, recent studies have demonstrated that energy deposition in the probe volume due to laser heating of particles is not negligible and influences the simulation of conduction cooling of the particles [9,13]. Complex measurements using CARS [13] and
extrapolation/modeling techniques [9] confirm evidence of local gas heating. This effect strongly depends on the soot volume fraction and varies with the laser fluence.
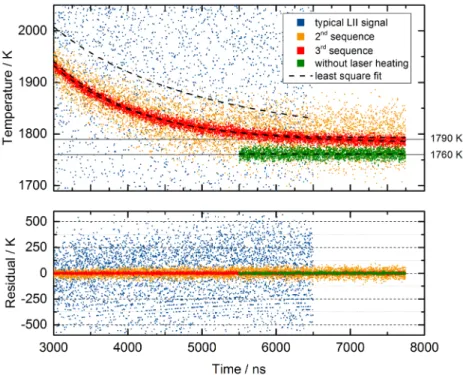
HDR-TiRe-LII for the first time allows determination of the temperatures even at very late times when particles are in thermal equilibrium with the surrounding gas. Comparing two-color pyrometry without and with laser heating allows one to measure the heat-up effect (see Fig. 5). At 6.5 µs after the laser pulse, the typical LII signals lead to a temperature of 1840 ± 268 K (blue) while the first sequential detection gives 1795 ± 30 K (orange) and the second 1790 ± 10 K (red). The error bars represent the 2σ standard deviation from the mean. For comparison of the (laser-induced) temperature increase, the incandescence was measured for a gate duration of 2 µs. For the selected measurement position the local gas temperature (without laser-heating) was determined as 1760 ± 10 K (green), which is very close to the previously reported CARS temperatures of 1730 ± 25 K [14] and 1740 K [13].
This demonstrates that HDR-TiRe-LII can detect particle temperatures in atmospheric pressure flames even 8 µs after the laser pulse. As mentioned previously, the asymptotic temperature decay after laser heating and subsequent cooling leads to a particle temperature of 1790 K at 7 µs after the signal peak. For the DC flame radiation correction, the probe-volume-to-total-measurement-volume ratio in our measurements was geometrically determined as 0.24 that leads to a corrected local gas temperature of 1840 K, indicating an increase in the local gas temperature of 80 K.
Fig. 5. Enlarged portion of the temperature trace from Fig. 4: Temperature traces from the conventional analysis of full LII decays (blue) and results of the sequential detection technique (orange and red) show the dramatic improvement in data quality that now allows to determine the effect of local gas heating (red) compared to measurements without laser heating (green). Residual of least square fit of measured data (bottom). After DC flame radiation correction (x = 0.24), local gas heating could be determined as 80 K for these laser settings and flame conditions.
5. Conclusions
We presented a new method for collecting LII signals with high dynamic range using delayed sequential detection. The suggested two-step approach of gate-delayed voltage switching for blocking the beginning of a LII signal and adjustment of filter/gain settings to an optimum
level can be applied in different ways. We have suggested three techniques using gated PMTs to get detailed information of the later temperature decay, two of which provide single shot capability. The method is sensitive enough to measure local gas-heating during LII, which is an uncertainty in research that until now needed to be determined by other—much more complex—measurement techniques (e.g., CARS). Particularly advantageous for very short LII signals such as with small particles or high pressures, this method can be used to collect a larger/longer temperature range and therefore improve data accuracy and model-based evaluation.
Funding
German Research Foundation (DFG) (SCHU 1369/20).
Acknowledgments
The authors gratefully acknowledge technical assistance by Robert Sawchuk from the National Research Council of Canada.