GLAUCOMA
Retinal neurovascular coupling in patients with glaucoma
and ocular hypertension and its association with the level
of glaucomatous damage
K. Gugleta&N. Waldmann&A. Polunina&
A. Kochkorov&R. Katamay&J. Flammer&
S. Orgul
Received: 1 November 2012 / Revised: 1 January 2013 / Accepted: 22 January 2013 / Published online: 19 February 2013 # Springer-Verlag Berlin Heidelberg 2013
Abstract
Purpose To analyze neurovascular coupling in the retina of untreated primary open-angle glaucoma (POAG) and ocular hypertension (OHT) patients.
Patients and methods Maximal vessel dilation in response to flicker light was analyzed with Retinal Vessel Analyzer (RVA) in temporal superior/inferior arterioles and veins in 51 POAG patients, 46 OHT and 59 control subjects. RVA parameters were compared between groups, between contralateral POAG eyes, and correlated to intraocular pressure, visual field mean defect and retinal nerve fiber layer thickness.
Results POAG eyes demonstrated generally smaller response of all vessels to flicker light than the other two groups (ANOVA p=0.026; mean arterial flicker response in percent of baseline, averaged superior and inferior was 3.48±2.22 % for controls , 2.35±2.06 % for POAG patients , and 2.97±2.35 % for OHT patients; corresponding values for venules were 3.88±1.98 %, 2.89±1.72 %, 3.45±2.77 %). There was no difference in flicker response between the eye with more and less advanced damage in each patient of the POAG group (ANOVA p=0.79). Correlation of flicker response to intraoc-ular pressure (IOP) was borderline at best, correlations to the level of glaucomatous damage were not significant.
Correlation of flicker response of superior and inferior vessels of the same eye was significant for the arteries (Pearson r=0.23, p=0.004), as well as venules (r=0.52, p<0.001). Conclusion General vessel response to flicker light was de-creased in POAG patients, compared to normal controls and OHT patients. In contrast to significant correlation between the two contralateral eyes of the flicker response itself, only its borderline correlation to IOP was seen. There was no correla-tion to the level of damage, altogether indicating a systemic dysregulation phenomenon.
Grants
Swiss National Foundation Grant 3200B0-113685, Velux Stiftung Grant, Freie Akademische Gesellschaft (FAG) Grant, Pfizer Inc. Grant
Clinical trial registration reference number ClinicalTrials.gov NCT00430209
Keywords Retinal vessels . Flicker . Glaucoma . Ocular hypertension
Introduction
Neurovascular coupling is a local, tissue-specific phenomenon and represents practically instant vascular reaction of the tissue
to elevated functional activity [1,2]. It has been explored in the
field of neurology, and in the last several years it has become
subject of interest in glaucoma as well [3–6]. Blood flow
alterations, and in particular the variability of perfusion of optic nerve head, is believed to be one of the major risk factors for
glaucoma [7]. Capability of the vascular system to respond to
changing metabolic needs is essential for the functional and morphological integrity of the neural tissue. Analysis of vessel Authors have full control of all primary data and agree to allow Graefes
Archive for Clinical and Experimental Ophthalmology to review their data upon request.
K. Gugleta (*)
:
N. Waldmann:
A. Polunina:
A. Kochkorov:
R. Katamay:
J. Flammer:
S. OrgulDepartment of Ophthalmology, University Hospital Basel, University Basel,
Mittlerestrasse 91,
CH-4031 Basel, Switzerland e-mail: Konstantin.Gugleta@usb.ch
response to challenge, rather than capturing a steady-state baseline flow, is essential for understanding the role of perfu-sion in glaucomatous damage, in particular because ischemia-reperfusion damage has been implicated in the pathogenesis of
glaucoma [8]. The retina is an optically easily accessible ocular
neural tissue, which makes the use of the Retinal Vessel Analyzer (RVA; IMEDOS GmbH, Jena, Germany) suitable
for this purpose [9,10]. Data on reproducibility of this device
[11,12], as well as protocols for specific use of the device, have
been published recently [13]. Several studies have indicated a
disturbance of ocular neurovascular coupling in glaucoma,
using various techniques [4–6]. For this reason, we initiated a
prospective project-study on retinal vessel response to flicker-ing light in patients with open-angle glaucoma and ocular hypertensives. Parts of the project's database were used to analyze the dynamics of the vessel response to repeated flicker
stimulation, and results were recently published [14]. Based on
the findings that some subjects may demonstrate alterations in
this regard [15], the focus of this partial analysis was on
differ-ences in diameter vessel behaviour during the three entire flicker periods (“area under the curve” of vessel diameter) in one retinal site. Herewith, we report final results of the cross-sectional analysis of neurovascular coupling in untreated patients with glaucoma and ocular hypertension, with particular emphasis on the association between the level of glaucomatous damage and a maximal flicker-induced dilatory capacity of retinal vessels. Comparisons of maximal vessel dilation were performed in various retinal sites (superior and inferior), as well as between the two contralateral eyes in glaucoma patients.
Patients and methods Subjects and methods
Local ethical committee approved the study, and after the study registration at ClinicalTrials.gov, the recruitment was con-ducted beginning in 2007 and lasted for 3 years. An informed consent was obtained from each study subject, following the tenets of the Declaration of Helsinki. Patients with primary open angle glaucoma (POAG) and ocular hypertension (OHT) were consecutively recruited from the glaucoma consultations at the Ophthalmology Department of the University Hospital Basel. As subjects of the cross-sectional analysis per protocol needed to be therapy-free, newly diagnosed and untreated POAG and OHT patients meeting study criteria underwent study examinations, patients on intraocular pressure (IOP)-lowering therapy were first subjected to a 4-week wash-out phase. Healthy controls were recruited through ads in local newspapers. A detailed medical and ophthalmic history was
recorded. As detailed previously [14], ophthalmological
examinations included the IOP readings with Goldmann applanation tonometry at 8 h, 11 h and 16 h. POAG was
diagnosed based on glaucomatous optic disc cupping (in particular: thinning of the inferior and/or superior rim, cup-to-disc ratio asymmetry of > 0.2 not due to optic disc size asymmetry), and based on matching glaucomatous visual field defects (specifically, a cluster of three or more test points with > 5 dB or two points with > 10 dB sensitivity reduction compared to age-eccentricity corrected
normal value) [16]. Importantly, untreated IOP was neither
exclusion nor inclusion criterion for POAG diagnosis; based
on this, patients from both the “high tension” and “normal
tension” sides of the IOP spectrum in POAG were included. In contrast, narrow angle glaucoma, as well as patients with any form of secondary glaucomas, including pigment dis-persion and pseudoexfoliation, were excluded. For ocular hypertensives, at least two daily readings of untreated IOP in the run-up to the study had to be equal or above 21 mmHg, in absence of disc or visual field damage. All participants with diabetes mellitus, untreated or unstable essential hypertension, untreated or unstable hypercholester-olemia, drug or alcohol abuse, history of eye surgery except uneventful cataract surgery, high ametropia (spherical
equiv-alent<−5 diopters or>+3 diopters), astigmatism above 2
diopters, and significant cataract were excluded from the
study. Smoking was an exclusion criterion [17]. In the
POAG group, both eyes were analyzed. In the OHT group an eye with the higher mean diurnal IOP was selected, and in healthy controls, one randomly selected eye per subject entered the analysis.
For retinal vascular examinations, we used RVA (IMEDOS GmbH, Jena, Germany). Details on the device and its flicker-light related application have been published
previously [9,10,13–15,18]. Briefly, an essential part of of
the RVA device is the fundus camera (FF450, Zeiss Jena, Germany), which allows the examination and recordings of the ocular fundus. It incorporates the illumination and the observation optical pathway. After being reflected from the retina, the light is delivered through the observation path-way to the observation ocular and to the charge-coupled device (CCD) chip of the video camera simultaneously. The measuring principle of the RVA is as follows: inside the walls of the retinal blood vessels there is a column of red blood cells, separated from the walls by the plasma edge stream. Red blood cells absorb one part of the light. RVA measures the diameter of the column of the red blood cells. The fundus camera was adjusted to the dilated pupil and a clear fundus image with good contrast and no reflections was obtained on the monitor. There are 25 captured full video frames per second. Flicker stimula-tion is achieved by the optoelectronic shutter with 12.5 Hz frequency, which darkens each second frame, leaving every other one normally exposed. These still pictures were analyzed by the RVA software. RVA pro-duces one vessel width measurement, expressed in units
of measurement (UM), for each segment length of 12.5 UM. In an emmetropic person, 1 UM = 1 micrometer.
Four major temporal vessel segments were selected for our measurements: one vein and one artery, one of each inferior and superior. Vascular geometry governed the exact
location of the measurement (Fig.1). After an initial
base-line still illumination during 50 seconds, the first of three flicker cycles, each lasting 20 seconds, was conducted; after each flicker cycle, there was a period of 80 seconds still illumination in between. There was no dark adaptation prior to examination, and the light exposure during the examina-tion was high, so the examined eye was constantly under photopic conditions. The length of the chosen vessel segment was also determined by the vessel geometry, but was in all cases between 500 and 750 micrometers, corresponding to 40 to 60 measuring points (the device is set to obtain one trans-verse diameter reading, based on vessel image brightness profile, at each 12.5 micrometer vessel length). Image stability of chosen vessel location is ensured by the eye/image-tracking software, which is in turn based on the vessel branching geometry.
Visual field was measured by automatic perimetry with Octopus (Interzeag, Schlieren, Switzerland), and the visual
field mean defect (MD) was entered in the analysis [19]. The
average peripapillary retinal nerve fiber layer thickness (RNFLT) was measured by optical coherence tomography (Stratus OCT, Carl Zeiss Meditec, Germany), as a measure
of morphologic glaucomatous damage. Details on this de-vice and its previous use in glaucoma have been published
elsewhere [18,20,21]. Fast RNFL thickness protocol was
applied, scans with signal strength (as a measure of scan quality) of less than 6/10 were repeated and if no higher value was possible, rejected.
Experimental setup and statistics
Since OCT scanning and retinal blood flow measurements (with RVA) required pupil dilatation, they were performed on the same day after the visual field testing. This was the second visual field (VF) testing and its result entered the analysis (first testing was performed in the recruitment phase for selection purposes). Pupil was dilated with tropi-camide drops in all subjects. The operator was masked to the status of the participants as well as to the visual field testing results during OCT and RVA measurements . After the OCT
measurement, a short break (10–20 minutes) followed to
gain stable hemodynamic conditions, which was confirmed by oscillometric blood pressure and pulse rate ments comparable to initial readings. All RVA measure-ments were conducted by the same experienced researcher (AK). Recordings were taken in two steps for each eye, separately for the superior and inferior branches, in a ran-dom order. Between each step, a time window of at least 20–30 minutes was left in place for recovery. In POAG patients, both eyes were measured. A maximal vessel dila-tion after flicker light exposure, calculated as the mean vessel diameter during the last 2 seconds of each 20-second flicker period, and then averaged for all three flicker periods, was the measure of vessel response. Vessel re-sponse was therefore expressed in micrometers, as a differ-ence between maximal dilation and the baseline diameter values, and also in relative numbers—dilation in percent to baseline. IOP was measured with the Goldmann applanation tonometry at the end, and this value (not the values recorded during recruitment) is reported in the Results section.
One-way analysis of variance was used for descriptive purposes and three way ANOVA models were used to analyze differences between groups. A P value of less than 0.05 was considered significant. One eye of healthy controls was ran-domly chosen, while in glaucoma patients, the eye with the more advanced damage (measured by OCT RNFLT, VF MD or both) was chosen, and in ocular hypertensives, the eye with the higher IOP was selected. We also examined the fellow eye in glaucoma patients and compared the two eyes in statistical models for dependent samples (repeated or dependent-samples ANOVA). Furthermore, Pearsons' correlation analy-sis was used to analyze association between glaucoma damage parameters (visual field MD and OCT RNFLT), and RVA parameters: average baseline vessel diameter and vessel re-sponse to flickering light. Correlations were calculated within Fig. 1 Typical Retinal Vessel Analyzer (RVA) measurement locations
on a fundus photo of a control subject: temporal inferior artery and vein, and temporal superior artery and vein
the POAG group using one (worse) eye per patient. Moreover, correlations of the same parameters, but using their interocular differences (delta), were also performed.
The only available data for the power calculations are the results of the mentioned study assessing the retinal
vessel response to flicker light in glaucoma patients [4].
However, in this study, a different flicker setting was used. Without appropriate pilot study results, the mini-mal sample size was set arbitrarily, based on the fol-lowing criteria: in the present study, four parameters were of primary interest, superior and inferior temporal retinal artery and vein flicker response (four parame-ters); and four were of secondary interest: visual field mean defect, OCT RNFL mean thickness, mean blood pressure and IOP. Taking ten subjects per parameter of primary interest sets the lower limit of required sample size at 40 participants in each of the study groups. In order to have a safety margin, because poor fixators and patients with poor RVA data quality were to be exclud-ed, we set the sample size at n = 50 per group. The recruitment was continued in parallel in all groups until the slowest recruiting one reached this threshold. OHT patients meeting the study criteria turned out to be a recruitment challenge, and the recruitment was stopped as soon as this last group reached n = 50. All subjects with poor fixation (RVA) and unreliable / poorly repro-ducible visual field and OCT testing were excluded.
Results
Parameters of interest are presented in Table1. There was no
significant statistical difference between the three groups either in age (ANOVA p=0.41) or in gender distribution (chi-square test contingency table 3x2, p=0.36).
The following medications were used from the following number of patients in the control/POAG/OHT group, re-spectively (some patients had more than one of the men-tioned medications): no systemic therapy 37/27/28, statins 5/8/8, beta-blockers 3/3/5, diuretics 1/5/3, angiotensin con-verting enzyme blockers 4/7/5, calcium channel blockers 0/2/0, magnesium 4/5/4, aspirin 2/5/8, antidepressants 2/4/5, hormonal substitution therapy 5/0/1. Chi-square test, analyzing the number of therapy free patients vs. patients with therapy, was not significant between each pair of groups (smallest p>0.1).
Differences across groups in systolic (ANOVA p=0.067) and diastolic blood pressure (ANOVA p=0.059) were bor-derline significant, with OHT patients having the highest and POAG patients the lowest readings.
Untreated IOP, OCT RNFL and visual field damage were all eo ipso highly statistically different across groups, with
highest IOP in the OHT group and lowest in controls, with thinnest OCT RNFL/highest VF MD in POAG patients and thickest OCT RNFL / lowest MD VF in controls. . Comparisons between three groups
Randomly selected eyes in the control group, the eye with more pronounced damage (worse eye) in the POAG group and the eye with higher IOP in the OHT group, one eye per subject in all groups, entered this analysis.
Regarding baseline vessel diameter, the three-way ANOVA model, with groups as the first factor, arter-ies/veins as the second and inferior/superior vessels as the third factor for the baseline diameter demonstrated only the arteries-to-veins difference as highly significant (p < 0.001), all other factors and interactions had p-values p > 0.05.
In the analog model for the average absolute flicker response, the difference between the groups was significant (p=0.014), and differences between arteries and veins, and superior versus inferior were both highly significant (p < 0.001).
Correlation between the baseline vessel caliber in micrometers and the absolute flicker response in micro-meters was absent in both arteries and veins, both superior and inferior (all four p values between 0.051 and 0.39), indicating that amplitude of dilation did not depend on the baseline vessel diameter. Nevertheless, the absolute flicker response was standardized for the vessel diameter and the relative response in percent (%)-to-baseline analyzed with the analogue three-way ANOVA model. The difference between the groups was again significant (p = 0.026), as was the difference between arteries and veins (p = 0.01), as well as the difference between superior versus inferior, which was highly significant (p < 0.001). The post-hoc analysis with the LSD (least significance differences) test revealed a significant difference in relative flicker re-sponse between the POAG and control eyes (p = 0.007), whereas no significant difference was present either between the OHT and POAG eyes (p = 0.15) or between the OHT and control eyes (p = 0.24). Results are
graph-ically presented in Fig. 2. In order to control for
con-founders, age and IOP readings were included in the above model as covariates—results remained essentially the same (difference between groups p = 0.033; LSD test between POAG and controls p = 0.005, between the OHT and POAG eyes p = 0.069, between OHT and control eyes p = 0.38). Moreover, after an exclusion of study subjects under systemic beta-blockers therapy (which, although equally distributed across three groups (3/3/5), could have influenced the results, no relevant
change in result pattern was observed; the same was the case with ACE-blockers (data not shown).
Comparisons between the“worse” and the “better” eye
in each patient in the POAG group
The eye with more advanced damage from each POAG patient constituted one group, and the fellow eye, the other group. There was no statistical difference in relative flicker response between the two groups (repeated ANOVA p=0.79), irrespective of the vessel nature (inter-action with arteries/veins not significant) and of position (interaction inferior versus superior not significant). With IOP as a covariate in the analysis above, results were similar (repeated ANOVA p=0.69).
Same results were observed also for baseline vessel diameters and absolute flicker response (all p values>0.1). Association between the RVA vessel parameters and the IOP Apart from group comparison of RVA vessel parameters between the controls and the OHT group, the analysis of association between the RVA vessel parameters and the IOP was also done by merging the control and the OHT group together and performing Pearson correlation analysis. Of all investigated RVA parameters, baseline diameter and relative flicker response in arteries and veins separately (values from superior and inferior regions were averaged for this analysis), the relative flicker responses correlated with borderline sig-nificance with the IOP: mean relative flicker response of Table 1 Parameters of interest± standard deviation: sample size of
each group, gender distribution, systolic and diastolic blood pressure (BP), intraocular pressure (IOP); Retinal Vessel Analyzer (RVA) parameters: baseline vessel diameter (average of first 50 seconds re-cording under still illumination), average diameter of the last two
seconds of three flicker periods minus the baseline diameter as the absolute flicker response, relative flicker response as the absolute response standardized with baseline diameter. All corresponding units are reported in brackets
Parameter Healthy controls POAG OHT
worse eye better eye
Sample size (n = ) 59 51 46 Gender (m/f) 32/27 21/30 24/22 Age (years) 59±9 60±10 61±9 Systolic BP (mmHg) 140.9±21.8 134.4±19.5 147.0±25.7 Diastolic BP (mmHg) 81.0±12.3 75.6±11.1 81.7±12.7 IOP (mmHg) 13.6±2.8 17.1±4.5 15.8±4.6 21.5±3.9
Baseline vessel diameter (micrometers)
Inferior artery 113.8±15.6 109.0±12.7 112. 0±12.5 111.8±14.9
Superior artery 112.0±12.4 110.7±10.8 111.8±14.3 110.8±14.4
Inferior vein 146.1±19.7 143.3±18.6 143.4±15.6 142.1±22.8
Superior vein 139.8±19.1 136.9±17.9 135.4±21.3 141.1±14.4
Average absolute flicker response
(last two seconds peak– baseline; in micrometers)
Inferior artery 4.4±3.3 2.9±2.8 2.9±4.2 4.2±4.9
Superior artery 3.2±2.9 2.2±2.7 1.7±3.4 2.2±2.3
Inferior vein 6.2±3.3 4.7±3.1 5.0±3.4 5.7±4.5
Superior vein 5.0±3.2 3.3±2.8 3.1±3.4 3.8±3.8
Average relative flicker response (last two seconds peak– baseline / baseline, × 100 %; in %) Inferior artery 4.0±3.0 2.7±2.7 2.8±3.8 3.9±4.4 Superior artery 2.9±2.7 2.0±2.5 1.6±3.0 2.0±2.1 Inferior vein 4.2±2.2 3.4±2.2 3.5±2.3 4.1±3.5 Superior vein 3.6±2.3 2.4±2.0 2.4±2.6 2.8±2.7 OCT RNFL (micrometers) 100.1±11.1 75.7±15.9 86.6±14.5 94.2±11.3 Visual field MD (dB) 0.79±1.6 3.4±3.2 1.4±2.1 0.29±1.44
arterioles (Pearson r =−0.19, p=0.048) and of venules (Pearson r=−0.20, p=0.042). After Holms correction for mul-tiple comparisons, this correlation was deemed not significant. Association between the RVA vessel parameters
and the glaucomatous damage in the POAG group separately
Of all investigated RVA parameters, baseline diameter and relative flicker response (arteries and veins were analyzed sep-arately; values from superior and inferior regions were averaged for this analysis), only baseline arterial diameter correlated significantly with an average OCT RNFL thickness (Pearson r=0.35, p=0.02; after Holms correction for multiple compar-isons, this correlation was deemed not significant). None of the RVA parameters correlated with the visual field damage.
Here, differences (delta) in each patient between eyes with more and less advanced glaucomatous damage were also subject of analysis. Whereas a strong correlation was observed between delta MD versus delta OCT RNFL (Pearson r=0.69, p<0.001), indicating strong function-structure relationship between the two eyes of the same patient in this data set, no correlation was observed between deltas of RVA parameters on one side and deltas of glaucomatous damage (visual field MD and OCT RNFL) on the other side.
Correlation between mean relative flicker responses, interocular in the POAG group and intraocular (superior versus inferior) in all groups merged together
Relative arterial flicker response (values from superior and inferior region were averaged for this analysis) correlated between the eyes in the POAG group, Pearson r=0.3, p= 0.04; results for relative venous flicker response were Pearson r=0.54, p<0.001.
Relative arterial flicker response correlated signifi-cantly between the superior and inferior region in all
three groups pooled together, one eye per subject
(Pearson r = 0.23, p = 0.004; Fig. 3). Relative venous
flicker response demonstrated similar pattern (Pearson
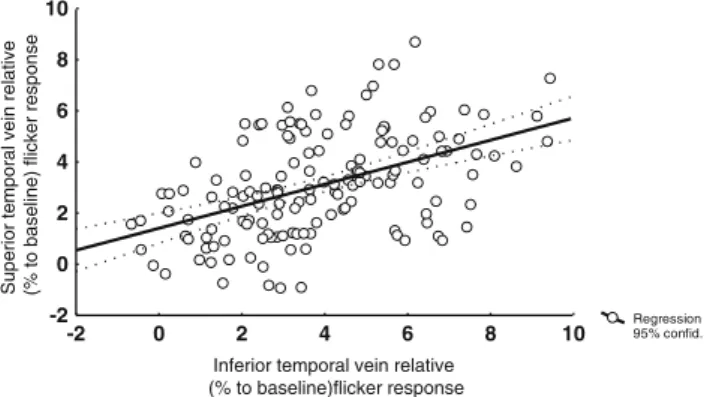
r = 0.52, p < 0.001; Fig. 4). Correlation of venous
re-sponse was significantly stronger than that of arteries (two-way correlation coefficient comparison test, p = 0.037).
Discussion
The present study demonstrated a strongly reduced reti-nal vessel response in POAG patients compared to healthy control eyes. Vascular response of OHT eyes differed significantly neither to control nor to POAG eyes. Comparison between eyes with more advanced and less advanced glaucomatous damage revealed differ-ences neither in terms of baseline vessel diameter nor vessel response to flicker light. There was no correlation between the vessel responses and either measure of glau-comatous damage, VF MD or OCT RNFLT. This was also the case when interocular differences in glaucoma damage were correlated to interocular differences in ves-sel response. In contrast, a weak (arterioles) to moderate (venules) correlation of vessel response itself was present between the two contralateral eyes, and also within the same eye superiorly and inferiorly, indicating common vascular regulatory mechanisms.
An obvious question arising from the cross-sectional design of the study is whether the observed reduced vessel response in POAG eyes could merely be a consequence of the glaucomatous damage. Due to tissue loss, activation through flickering light would require smaller perfusion increment, which would hence result in weaker vessel response. There are a number of arguments that challenge such explanation. The reported neurovascular coupling was recorded in the retina and retinal circulation, and not in the presumed primary site of glaucomatous
0 1 2 3 4 5 6 7 8
Vessel dilatation in % of baseline diameter, mean standard deviation
Art. temporalis inferior
Art. temporalis superior Ven. temporalis superior Ven. temporalis inferior
controls
P O A G
O H T
p=0.007 p=0.15
p=0.24
Fig. 2 Graphical representation of results, mean ± SD of the relative (in percent to baseline caliber) vessel response in three groups and on four measuring sites. Statistical results are given in text
Regression 95% confid. -2 0 2 4 6 8 10 -2 0 2 4 6 8 10 Inferior temporal artery relative
(% to baseline)flicker response
Superior temporal artery relative (% to baseline)
flicker response
Fig. 3 Correlation of relative arterial flicker response (in percent to baseline) in the inferior versus superior temporal region (Pearson r=0.23, p=0.004)
damage—in the optic nerve head. The retina, and in particular the retinal ganglion cells which are supplied by retinal circulation, are indeed damaged in glaucoma— but in relative terms not as much as the neural tissue of optic nerve head. Thus, an explanation for almost one third smaller retinal vessel response in POAG compared to control eyes should be sought elsewhere. Moreover, if the retinal tissue loss carried significant weight in these terms, one would expect smaller baseline retinal vessel calibers. This was not the case. There is one further argument, and that is the missing correlation between the vessel response and the level of glaucomatous damage. If reduced vessel response was merely a consequence of tissue loss, one would expect such a correlation—and there was none. Still, probably the most important
argu-ment against the “less tissue, less blood flow demand”
explanation is the observation of lacking vascular differ-ences between eyes with more and eyes with less ad-vanced glaucomatous damage. Again, if less tissue leads to less flow demand, more affected eyes would have to demon-strate differences compared to to the more preserved ones. This was not the case. POAG patients in our study were predominantly in an early damage stage of glaucoma, and this fact could at least in part explain a weak or missing correla-tion. Of note, Garhofer et al. reported on reduced retinal vascular response already in early stages of glaucoma, under-scoring that we are not dealing merely with a consequence of
the glaucomatous damage [4].
So, if not the consequence, can this vascular dysregula-tion be seen as a cause of the damage? Considering just the same arguments as above, the missing correlation between the level of glaucomatous damage and the retinal vessel response, it is conceivable that disturbed retinal neurovas-cular coupling is not a major direct contributor to the damage. Disturbances in retinal circulation are unlikely to directly cause the glaucomatous damage. Results of other studies confirm a weak or missing correlation between the glaucomatous damage and vascular parameters in the retina
[22]. However, a similar finding was reported for the optic
nerve head itself [5], indicating that disturbed neurovascular
coupling can be regarded as a strong indicator of underlying vascular dysregulation, rather than a direct damage causing mechanism. The observation of interocular and intraocular correlations of vessel responses across all groups, as well as the observation that both eyes of POAG patients show com-parable levels of vessel response reduction, might be explained by a possible systemic character of vascular distur-bance. This vascular dysregulation may in turn, in concert with other risk factors, contribute to the glaucomatous damage.
What, indeed, are possible causes of reduced neurovas-cular coupling in the retina of glaucoma patients? We ana-lyzed IOP as a factor influencing retinal vessel response. Previous studies demonstrated a flicker response
indepen-dence on short term IOP elevation [23–25]. In contrast to the
mentioned studies, we focused on the association with long term spontaneously elevated IOP. Our results were border-line. Given the very weak correlations between the IOP and vessel responses, and also a lack of difference in vessel responses between the OHT group and control eyes, it seems that the contribution of long term higher IOP to the vessel response disturbance would be modest at best, and the explanation likely lies elsewhere. THe following con-siderations are merely an attempt to interpret the study findings and put them into perspective based on the current literature and on the observations made in the study. Activation of neuronal tissue leads to complex gliovascular
dialogue, with nitric-oxide as the effective vasodilator [2,
26,27]. In the retina itself, it is not clear whether a general
release of nitric-oxide during flicker light exposure directly affects all the neighbouring vessels by diffusing across their walls, including those with calibers >70–80 micrometers, which are relevant for RVA measurements; or, alternatively, the first major effect takes place in smaller vessels and precapillary sphincters, where gliovascular contact is mostly realized through astrocytic processes, forming a functional microvascular unit consisting of endothelial and smooth muscle cells and their associated perivascular astrocytes,
like elsewhere in brain [28]. The next question is how the
information on vessel dilation is communicated from these smaller resistance vessels to the larger RVA relevant vessels. Due to their intercellular gap-junctions, endothelial cells can be seen as a functional syncytium, conveying information
along the vascular tree [29]. Alternatively, or perhaps as an
addition to the above mechanisms, once small resistance vessels are opened, the blood column starts moving faster through all the vessels. Larger arterioles and venules sense this motion by their endothelial cells through shear-stress signalling mechanisms, and dilate. Flow-mediated dilation is a well known regulatory mechanism in large vessels, but together with endothelium-independent myogenic mecha-nisms, it also plays a very important role in arterioles Regression 95% confid. -2 0 2 4 6 8 10 -2 0 2 4 6 8 10 Inferior temporal vein relative
(% to baseline)flicker response
Superior temporal vein
relative
(% to baseline)
flicker response
Fig. 4 Correlation of relative venous flicker response (in percent to baseline) in the inferior versus superior temporal region (Pearson r=0.52, p<0.001)
(40–80 microns) and venules (80–120 microns) as well [30,
31]. The flow mediated regulatory mechanism can be
dis-turbed, and indeed, the study by Fadini et al. reported on reduced flow-mediated dilation in the brachial artery of
POAG patients [32].
Moreover, our observation that several POAG patients demonstrated an arteriolar only or venous only dilation would further support such an explanation. Arterioles and venules seem to be regulated independently of each other. Interocular and intraocular correlations of venule responses are stronger than those of arterioles. Apart from more stable RVA signal from venules, one possible explanation lies in different regulatory mechanisms compared to arterioles, putting in former an emphasis on endothelial shear-stress flow regulatory mechanisms, and making it due to lower intraluminal pressures less dependent on rather local,
segment-based, myogenic regulatory components [31,33].
At present, it is not clear what specific molecular mech-anism or mechmech-anisms could lead to vascular dysregulation, which also includes disturbance of neurovascular coupling
in the retina. Possible culprits are the endothelin [34] or the
nitric-oxide systems [35].
In contrast to baseline vessel caliber, the vessel response both in relative and in absolute numbers was in the superior retinal half in all groups and in all vessels smaller than inferiorly. As different levels of retinal adaptation are un-likely because RVA recordings were taken in two regions in random order, this fairly robust finding still remains without explanation, apart perhaps from interpreting the ISNT rule
[36] in terms of less tissue, less perfusion.
There are several downsides of the present study. Although retinal circulation is highly important for the ret-inal ganglion cells and their axons, as mentioned earlier, prelaminar optic nerve head tissue and not the retina is the presumed primary site of glaucoma damage, and informa-tion on retinal vessels relates indirectly to glaucoma. Our results are further limited by the fact that RVA measures only the alteration of the vessel diameter, but not the blood flow velocity inside the vessel. In addition, the RVA ana-lyzes the thickness of the erythrocytes column, and not the whole wall-to-wall vessel diameter. Moreover, we only measured the vessel diameter in a chosen segment and not on the whole visible vessel tree. This downside was partly mitigated by obtaining sample information from both the superior and inferior part of the eye. The RNFL thickness might have in itself affected RVA measurements, because vessels are embedded in it. Indeed, baseline vessel diameter did correlate with the RNFL thickness, but relative flicker response did not. The next drawback of the study is that we used only the last two seconds of the flicker-induced diam-eter change averaged over all three flicker periods in our statistical analysis, corresponding to the maximal dilation. Although arbitrarily taken, this parameter could indeed be
representative of a maximal dilatory capacity of retinal vessels in this type of examination in glaucoma patients, a
point of view shared by other research groups as well [4].
Lastly, based on the untreated IOP (as mentioned earlier, IOP was not an exclusion/inclusion criterion for the POAG group, they were consecutively recruited in our referral institution specialized in vascular ocular disorders), it is likely that our cohort of POAG patients contains larger
percentage of the so-called “normal”-tension glaucoma
patients, giving more weight to pathogenetic mechanisms other than IOP, and thus providing only limited significance of results for the general POAG population.
There is a considerable overlap of the flicker response between the groups, which might be a disadvantage with respect to result interpretation in individual patient. In compar-ison to the mean relative flicker response of POAG eyes, 40 (of 59) control eyes demonstrated stronger arterial vasodilatory
response, 43 of 59 stronger venous response; the best
“cut-off” was achieved when an average arterial-venous flicker
response was analyzed—46 of 59 control eyes demonstrated a response stronger than the mean response of the POAG eyes. In summary, neurovascular coupling is disturbed in the retina of topically untreated POAG patients. This feature seems to be independent of IOP; it is not merely a conse-quence of glaucomatous damage, and is likely a strong indi-cator of an underlying vascular dysregulation that contributes to the damage. It will take longitudinal studies to evaluate the predictive value of retinal neurovascular coupling for the development of glaucomatous damage, and also to assess the value of neurovascular coupling as a follow-up parameter for the success of perfusion supporting glaucoma therapy.
Conflict of interest None
References
1. Bonvento G, Sibson N, Pellerin L (2002) Does glutamate image your thoughts? Trends Neurosci 25:359–364
2. Attwell D, Buchan A, Charpak S, Ritzen M, Macvicar BA, Newman EA (2010) Glial and neuronal control of brain. Nature 468:232–243
3. Gugleta K, Fuchsjager-Mayrl G, Orgul S (2007) Is neurovascular coupling of relevance in glaucoma? Surv Ophthalmol 52(Suppl 2): S139–S143
4. Garhofer G, Zawinka C, Resch H, Huemer KH, Schmetterer L, Dorner GT (2004) Response of retinal vessel diameters to flicker stimulation in patients with early open angle glaucoma. J Glaucoma 13:340–344
5. Riva CE, Salgarello T, Logean E, Colotto A, Galan EM, Falsini B (2004) Flicker-evoked response measured at the optic disc rim is reduced in ocular hypertension and early glaucoma. Invest Ophthalmol Vis Sci 45:3662–3668
6. Zeitz O, Mayer J, Hufnagel D, Praga R, Wagenfeld L, Galambos P, Wiermann A, Rebel C, Richard G, Klemm M (2009) Neuronal activity influences hemodynamics in the paraoptic short posterior ciliary arteries: a comparison between healthy and glaucomatous subjects. Invest Ophthalmol Vis Sci 50:5846–5850
7. Flammer J, Orgul S, Costa VP, Orzalesi N, Krieglstein GK, Serra LM, Renard JP, Stefánsson E (2002) The impact of ocular blood flow in glaucoma. Prog Retin Eye Res 21:359–393
8. Flammer J (2001) Glaucomatous optic neuropathy: a reperfusion injury. Klin Monatsbl Augenheilkd 218:290–291
9. Seifertl BU, Vilser W (2002) Retinal Vessel Analyzer (RVA) —de-sign and function. Biomed Tech (Berl) 47(Suppl 1 Pt 2):678–681 10. Vilser W, Nagel E, Lanzl I (2002) Retinal Vessel Analysis—new
possibilities. Biomed Tech (Berl) 47(Suppl 1 Pt 2):682–685 11. Pache M, Nagel E, Flammer J (2002) Reproducibility of
measure-ments with the retinal vessel analyzer under optimal conditions. Klin Monatsbl Augenheilkd 219:523–527
12. Nagel E, Vilser W, Fink A, Riemer T (2006) Variance of retinal vessel diameter response to flicker light a methodical clinical study. Ophthalmologe 103:114–119
13. Garhofer G, Bek T, Boehm AG, Gherghel D, Grunwald J, Jeppesen P, Kergoat H, Kotliar K, Lanzl I, Lovasik JV, Nagel E, Vilser W, Orgul S, Schmetterer L, Ocular Blood Flow Research Association (2010) Use of the retinal vessel analyzer in ocular blood flow research. Acta Ophthalmologica 88:717–722 14. Gugleta K, Kochkorov A, Waldmann N, Polunina A, Katamay R,
Flammer J, Orgul S (2012) Dynamics of retinal vessel response to flicker light in glaucoma patients and ocular hypertensives. Graefe's Arch Clin Exp Ophthalmol 250:589–594
15. Gugleta K, Zawinka C, Rickenbacher I, Kochkorov A, Katamay R, Flammer J, Orgul S (2006) Analysis of retinal vasodilation after flicker light stimulation in relation to vasospastic propensity. Invest Ophthalmol Vis Sci 47:4034–4041
16. European Glaucoma Society EGS (2008) Perimetry. In: EGS, Terminology and guidlines for glaucoma. Dogma, Savona pp 82–87 17. Wimpissinger B, Resch H, Berisha F, Weigert G, Schmetterer L, Polak K (2005) Response of retinal blood flow to systemic hyper-oxia in smokers and nonsmokers. Graefes Arch Clin Exp Ophthalmol 243:646–652
18. Gugleta K, Polunina A, Kochkorov A, Waldmann N, Portmann N, Katamay R, Flammer J, Orgul S (2012) Association Between Risk Factors and Glaucomatous Damage in Untreated Primary Open-angle Glaucoma. J Glaucoma [Epub ahead of print]
19. Flammer J (1986) The concept of visual field indices. Graefes Arch Clin Exp Ophthalmol 224:389–392
20. Medeiros FA, Zangwill LM, Bowd C, Weinreb RN (2004) Comparison of the GDx VCC scanning laser polarimeter, HRT II confocal scanning laser ophthalmoscope, and stratus OCT optical coherence tomograph for the detection of glaucoma. Arch Ophthalmol 122:827–837
21. Wollstein G, Ishikawa H, Wang J, Beaton SA, Schuman JS (2005) Comparison of three optical coherence tomography scanning areas for detection of glaucomatous damage. Am J Ophthalmol 139:39–43
22. Resch H, Schmidl D, Hommer A, Rensch F, Jonas JB, Fuchsjäger-Mayrl G, Garhöfer G, Vass C, Schmetterer L (2011) Correlation of optic disc morphology and ocular perfusion parameters in patients with primary open angle glaucoma. Acta Ophthalmologica 89(7): e544–e549
23. Garhofer G, Resch H, Weigert G, Lung S, Simader C, Schmetterer L (2005) Short-term increase of intraocular pressure does not alter the response of retinal and optic nerve head blood flow to flicker stimulation. Invest Ophthalmol Vis Sci 46:1721–1725
24. Nagel E, Vilser W, Lanzl I (2001) Retinal vessel reaction to short-term IOP elevation in ocular hypertensive and glaucoma patients. Eur J Ophthalmol 11:338–344
25. Nagel E, Vilser W, Lanzl I (2002) Functional analysis of retinal vessel diameter reaction to artificially raised intraocular pressure in glaucoma patients with and without dorzolamide therapy. Vasa 31:230–234 26. Buerk DG, Riva CE, Cranstoun SD (1996) Nitric oxide has a
vasodilatory role in cat optic nerve head during flicker stimuli. Microvasc Res 52:13–26
27. Dorner GT, Garhofer G, Kiss B, Polska E, Polak K, Riva CE, Schmetterer L (2003) Nitric oxide regulates retinal vascular tone in humans. Am J Physiol Heart Circ Physiol 285:H631–H636 28. Cohen Z, Bouchelet I, Olivier A, Villemure JG, Ball R,
Stanimirovic DB, Hamel E (1999) Multiple microvascular and astroglial 5-hydroxytryptamine receptor subtypes in human brain: molecular and pharmacologic characterization. J Cereb Blood Flow Metab 19:908–917
29. Climent B, Zsiros E, Stankevicius E, de la Villa P, Panyi G, Simonsen U, García-Sacristán A, Rivera L (2011) Intact rat supe-rior mesenteric artery endothelium is an electrical syncytium and expresses strong inward rectifier K + conductance. Biochem Biophys Res Commun 410:501–507
30. Kuo L, Davis MJ, Chilian WM (1990) Endothelium-dependent, flow-induced dilation of isolated coronary arterioles. Am J Physiol 259:H1063–H1070
31. Kuo L, Arko F, Chilian WM, Davis MJ (1993) Coronary venular responses to flow and pressure. Circ Res 72:607–615
32. Fadini GP, Pagano C, Baesso I, Kotsafti O, Doro D, de Kreutzenberg SV, Avogaro A, Agostini C, Dorigo MT (2010) Reduced endothelial progenitor cells and brachial artery flow-mediated dilation as evi-dence of endothelial dysfunction in ocular hypertension and primary open-angle glaucoma. Acta Ophthalmol 88:135–141
33. Kuo L, Chilian WM, Davis MJ (1991) Interaction of pressure- and flow-induced responses in porcine coronary resistance vessels. Am J Physiol 261:H1706–H1715
34. Flammer J, Haefliger IO, Orgul S, Resink T (1999) Vascular dysregulation: a principal risk factor for glaucomatous damage? J Glaucoma 8:212–219
35. Polak K, Luksch A, Berisha F, Fuchsjaeger-Mayrl G, Dallinger S, Schmetterer L (2007) Altered nitric oxide system in patients with open-angle glaucoma. Arch Ohthalmol 125:494–498
36. Harizman N, Oliveira C, Chiang A, Tello C, Marmor M, Ritch R, Liebmann JM (2006) The ISNT rule and differentiation of normal from glaucomatous eyes. Arch Ophthalmol 124:1579–1583