ORIGINAL PAPER
Risk factors for post-traumatic osteoarthritis of the ankle:
an eighteen year follow-up study
Anne Lübbeke&Davide Salvo&Richard Stern&Pierre Hoffmeyer&Nicolas Holzer&
Mathieu Assal
Received: 1 December 2011 / Accepted: 19 December 2011 / Published online: 17 January 2012 # Springer-Verlag 2012
Abstract
Purpose Long-term studies evaluating risk factors for de-velopment of ankle osteoarthritis (OA) following malleolar fractures are sparse.
Methods We conducted a retrospective cohort study includ-ing consecutive patients treated by open reduction and in-ternal fixation for malleolar fracture between January 1988 and December 1997. Perioperative information was obtained retrospectively. Patients were evaluated clinically and radiographically 12–22 years postoperatively. Radio-graphic ankle OA was determined on standardised radio-graphs using the Kellgren and Lawrence scale (grade 3–40 advanced OA). Uni- and multivariate regression analyses were performed to determine risk factors for OA.
Results During the inclusion period, 373 fractures (372 patients; 9% Weber A, 58% Weber B, 33% Weber C) were operated upon. The mean age at operation was 42.9 years. There were 102 patients seen at follow-up (mean follow-up 17.9 years). Those not available did not differ in demo-graphics and fracture type from those seen. Advanced ra-diographic OA was present in 37 patients (36.3%). Significant risk factors were: Weber C fracture, associated medial malleolar fracture, fracture-dislocation, increasing body mass index, age 30 years or more and length of time since surgery.
Conclusions Advanced radiographic OA was common 12– 22 years after malleolar fracture. The probability of devel-oping post-traumatic OA among patients having three or more risk factors was 60–70%.
Introduction
Ankle osteoarthritis (OA) is more frequently (70–80%) of post-traumatic origin compared to OA (<10%) of the hip or knee [1–3]. Malleolar fractures are the most frequent frac-ture type, present in 37–53% of patients with advanced or end-stage ankle OA [2–4]. Patients with post-traumatic an-kle OA are younger than those with primary OA [2, 3]. Long-term studies (follow-up greater than ten years) evalu-ating risk factors for the development of ankle OA after malleolar fractures are sparse. Most of them are limited by small sample size [5–9] focusing on one or two factors. Only one study [8] assessed risk factors using statistical methods which allow for the presence of other risk factors. Additionally, there are a few short- to midterm follow-up studies evaluating a larger number of patients and possible risk factors [10–12].
Several conditions have been associated with an in-creased risk of developing radiographic ankle OA or end-stage OA following a malleolar fracture. These include increasing age [4,13], female gender [14], fracture severity [10, 11,14], location and extent of cartilage lesions espe-cially of the medial malleolus [8], quality of fracture reduc-tion [10, 12] and presence of a fracture-dislocation [6,10, 11].
Our objective was to identify risk factors for ankle OA on average 17.9 years after a malleolar fracture treated by open
A. Lübbeke (*)
:
D. Salvo:
R. Stern:
P. Hoffmeyer:
N. Holzer:
M. Assal
Division of Orthopaedics and Trauma Surgery, Geneva University Hospitals,
4, rue Gabrielle-Perret-Gentil, 1211 Geneva, Switzerland
reduction and internal fixation (ORIF) and to quantify the impact of both the individual and the combined risk factors. We evaluated their influence on the development of (1) advanced radiographic OA and (2) symptomatic advanced radiographic OA.
Materials and methods
Study population and study design
We conducted a retrospective cohort study including all patients operated upon at our large university hospital be-tween January 1988 and December 1997 for a malleolar fracture treated by ORIF. Pilon or talus fractures were ex-cluded, as well as those patients younger than 18 years of age. Operations were performed by a number of different surgeons with varying levels of experience. The study was approved by our Hospital Ethics Committee.
Potential risk factors
The risk factors evaluated were: (a) age at the time of injury as continuous and categorical variable (<30 vs≥30 years as suggested by Lorez and Hintermann [13]); (b) sex; (c) body mass index (BMI) as continuous and categorical variable (normal weight0 BMI <25 kg/m2, overweight 0 BMI 25– 29.9 kg/m2, obese0 BMI ≥30 kg/m2); (d) work status at the time of operation (office, light or heavy work); (e) type of fracture according to the Danis-Weber classification [15, 16]; (f) associated fracture-dislocation (yes/no); (g) associ-ated fracture of the medial malleolus (yes/no); (h) associassoci-ated fracture of the posterior malleolus (yes/no); and (i) time between surgery and follow-up in years as continuous and categorical variable (< 15 years, 15–19.9 years, ≥ 20 years). Outcomes
The primary outcome of interest was the incidence of ad-vanced radiographic ankle OA 12–22 years after a malleolar fracture. Ankle OA was assessed using the Kellgren and Lawrence (K&L) scale [17], the most widely used radio-graphic classification of OA. It includes five grades, and advanced OA is classified as grades 3 and 4. Since no specific description of the K&L grades exists for the ankle, we based our radiographic evaluation on the description of the grades of OA for the knee. Grade 3 is characterised by the presence of moderate multiple osteophytes, definite nar-rowing of the joint space, some sclerosis and possible de-formity of bone ends. Grade 4 is defined by the presence of large osteophytes, marked narrowing of the joint space, severe sclerosis and definite deformity of bone ends [18].
In the context of knee OA the K&L scale is considered a reliable and valid instrument [19,20].
The second outcome of interest was the incidence of symptomatic advanced radiographic ankle OA. This was defined by the presence of pain together with advanced radiographic ankle OA. The American Orthopaedic Foot and Ankle Society (AOFAS) hindfoot score [21], which includes an item for pain (mild, moderate or severe), was used for evaluation at follow-up. All patients with an AOFAS pain sub-score less than 40 points and K&L grades 3 or 4 were considered as incident cases.
Data collection
Perioperative information was obtained retrospectively through chart review. Preoperative and immediate postoper-ative radiographs were not available. In six patients (1.6%) the fracture classification was missing. In 75 patients (20.1%) information on height at the time of surgery was missing making the calculation of their preoperative BMI impossible.
Clinical and radiographic follow-up was standardised. All patients were contacted by mail twice and telephone inviting them to participate. They were seen on average at 17.9 years postoperatively for clinical and radiographic assessment by two surgeons who had not performed the operations. Ankle OA was independently assessed on stand-ardised radiographs by two reviewers who were blinded to patient characteristics and clinical outcome.
Statistical analysis
Baseline characteristics were compared between patients seen and those not available for follow-up. Student’s t test was used for the comparison of continuous variables and the chi-square test for the comparison of categorical variables.
In order to estimate the association between each risk factor (predictor) and the main outcome we performed uni-variate analyses and presented relative risks (RR) and 95% confidence intervals (CI) as well as unadjusted odds ratios (OR) and their 95% CIs. We then fitted the full multivariate logistic regression model including all potential predictors. Predictors were excluded (one by one) if the p value of the log likelihood ratio test was greater than 0.10. Predictor exclusion was continued until all remaining predictors had p values less than 0.10, which was then defined as the final prediction model. The choice of a more restrictive p value, such as p00.05, is generally not recommended because of the risk of excluding important variables from the model.
Risk factors for the secondary outcome were only assessed in univariate analyses due to the limited number of outcome events. Finally, the incidence of the two outcomes was ana-lysed according to the number of risk factors present per
patient. The predictors BMI and time since surgery, evaluated as continuous variables in the final model, were dichotomised. For BMI the category at risk was a BMI≥25 kg/m2and for time since surgery an interval≥20 years.
Results
There were 373 malleolar fractures in 372 patients corresponding to the inclusion criteria and operated upon during the study period. Of these patients, 47 (12.6%) had died, 126 (33.9%) had left the area without current address and 97 (26.1%) refused or did not participate in the follow-up invitation. In total, 102 patients (27.3%) with 102
malleolar fractures attended the visit between 12 and 22 years post ORIF (median follow-up time 17.9 years, range 12.6–22.8 years). Comparison of the baseline charac-teristics between those patients who were seen at follow-up and those who were originally operated upon (Table 1) revealed that those at follow-up did not differ substantially with respect to age, sex, mean BMI and fracture-related characteristics from the original cohort.
Of the 102 patients available for follow-up, 37 (36.3%) had developed advanced radiographic ankle OA , the main outcome, with 28 patients classified as K&L grade 3 and nine patients as grade 4. The associations of risk factors with the absence or presence of advanced radiographic OA are presented in Table 2. In the univariate analyses the
Table 1 Baseline characteristics of all operated patients (1988–1997), those available for follow-up (FU) and those not seen
All interventions (n0373) Seen at FU (n0102) Not seen at FU (n0271) p value
Men (%) 215 (57.6) 64 (62.7) 151 (55.7) 0.221
Age at operation, mean (±SD) 42.9 (±17.1) 42.5 (±15.0) 43.1 (±17.8) 0.732
< 30 years 106 (28.4%) 24 (23.5%) 82 (30.3%)
30–49.9 years 130 (34.9%) 42 (41.2%) 88 (32.5%)
≥ 50 years 137 (36.7%) 36 (35.35) 101 (37.3%) 0.238
BMI at operation, mean (±SD)a 24.8 (±3.7) 25.1 (±3.6) 24.8 (±3.8) 0.579
Normal weight (%) 165 (55.4) 50 (49.0) 105 (59.7) Overweight (%) 107 (35.9) 46 (45.1) 53 (30.1) Obese (%) 26 (8.7) 6 (5.9) 18 (10.2) 0.033 Fracture classification (%)b 0.282 Weber A 30 (8.2) 5 (4.9) 25 (9.4) Weber B 216 (58.8) 65 (63.7) 151 (57.0) Weber C 121 (33.0) 32 (31.4) 89 (33.6) Fracture-dislocation yes (%) 67 (18.0) 18 (17.6) 49 (18.1) 0.922
Fracture medial malleolus yes (%) 181 (48.5) 43 (42.2) 138 (50.9) 0.131
Fracture posterior malleolus yes (%) 50 (13.4) 15 (14.7) 35 (12.9) 0.651
Syndesmosis fixation yes (%)c 240 (64.3) 63 (61.8) 177 (65.3) 0.524
Work (%) <0.001 Student 28 (7.5) 3 (2.9) 25 (9.2) Retired 52 (13.9) 8 (7.8) 44 (16.2) Office work 107 (28.7) 38 (37.3) 69 (25.5) Light work 104 (27.9) 39 (38.2) 65 (24.0) Heavy work 52 (13.9) 11 (10.8) 41 (15.1) None 30 (8.0) 3 (2.9) 27 (10.0) Type of accident (%) 0.146
Daily activity/at home 189 (50.7) 46 (45.1) 143 (52.8)
Sports accident 99 (26.5) 35 (34.3) 64 (23.6)
Traffic accident 56 (15.0) 11 (10.8) 45 (16.6)
Work accident 22 (5.9) 10 (9.8) 12 (4.4)
Other 7 (1.9) – 7 (2.6)
a
Preoperative BMI was missing in 75 interventions (20.1%); percentages calculated on a total of n0298 interventions b
Fracture classification according to Weber was missing for 6 interventions (1.6%); percentages calculated on a total of 367 interventions c
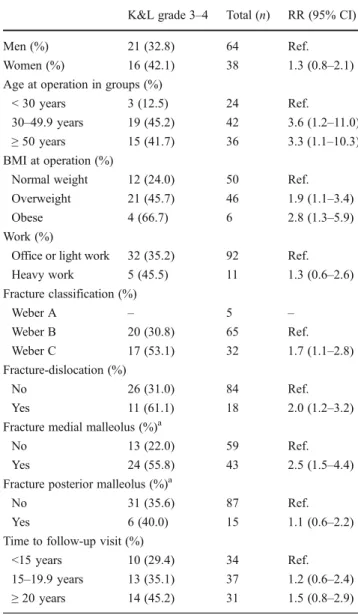
following were significantly associated with a higher inci-dence of advanced radiographic OA: age 30 years or more at the time of injury, overweight and obesity, the presence of a Weber C fracture, an associated medial malleolar fracture and an associated fracture-dislocation. An incidence greater than 50% was found in patients with a Weber C fracture (53%), a medial malleolar fracture (56%) and a fracture-dislocation (61%), as well as in obese patients (67%). In the multivariate logistic regression analysis the factors age over 30 years, a BMI (continuous), a Weber C fracture, an asso-ciated medial malleolar fracture and time since surgery (continuous) were independently associated with the out-come and constituted the final model as presented in Table3. Table4shows the incidences of the outcome per number of risk factors present in a patient (risk categories). The
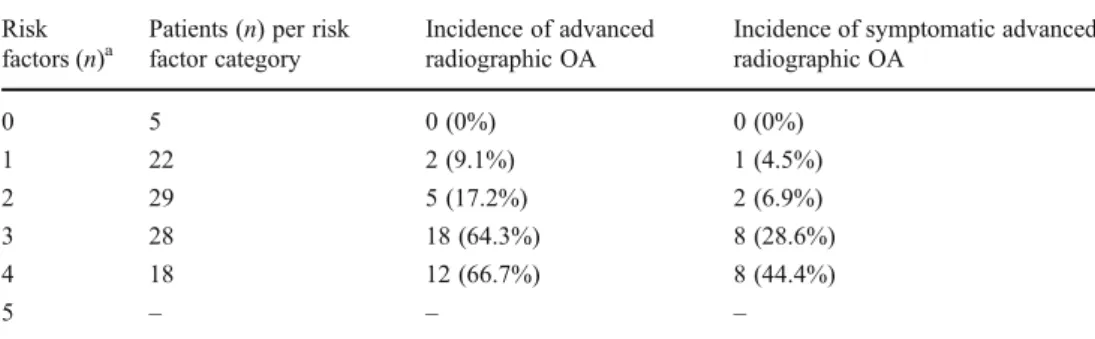
incidence of advanced radiographic OA increased substan-tially from low incidences (mean 12.5%) in patients with two risk factors or less to substantially higher incidences (mean 65.2%) in the presence of three or four risk factors (absolute risk increase 52.7%, 95% CI 36.4–69.0).
As regards the secondary outcome of symptomatic ad-vanced radiographic OA of the ankle, 19 patients (18.6%) presented with an AOFAS pain score greater than 40 points and a K&L grade 3–4. Symptomatic advanced radiographic OA occurred most often in patients with a Weber C fracture, a medial malleolar fracture, a fracture-dislocation and in obese patients (Table 5). Only the presence of a Weber C fracture [incidence 37.5 vs 10.8% for Weber B fracture, RR 3.6 (95% CI 1.6–8.2)] or an associated medial malleolar fracture [incidence 32.6 vs 8.5% with an intact medial malleolus, RR03.8 (95% CI 1.5–9.9)] were significantly associated with symptomatic advanced radiographic OA in univariate analyses. The incidences according to these two factors are shown in Fig. 1. Their relative risk estimates were higher as compared to those for the main outcome (Table 2). Relative risk estimates for obesity and fracture-dislocation were similar to the estimates for the main out-come, but the confidence intervals were larger and included one meaning less precise and statistically not significantly different. The incidence of symptomatic advanced OA in-creased substantially with an increasing number of risk factors (Table 4). It was low (<10%) in patients with up to two risk factors and increased to 29% and 44% for those patients with three and four risk factors, respectively.
Discussion
Advanced radiographic ankle OA developed in 36% of patients on average 17.9 years after a malleolar fracture treated with ORIF. The specific type of fracture (Weber C, medial malleolus), age of 30 years at the time of injury and older, being overweight or obese at the time of injury and a longer follow-up since surgery were associated with a sub-stantially increased risk of advanced radiographic ankle OA as defined by K&L grades 3–4. In the presence of three or more risk factors there was a 60–70% incidence of ankle OA. The most important risk factors for the development of symptomatic advanced radiographic OA were related to the type of fracture, either a Weber C or an associated fracture of the medial malleolus independent of whether the fracture was a Weber B or C.
Identification of risk factors for an undesirable event and the quantification of their effect permit one to establish a prognosis for a certain disease/outcome, which is important for physicians as well as patients. Risk factors might be modifiable or their influence reduced. In this study the only potentially modifiable risk factor was BMI at the time of
Table 2 Univariate association for each risk factor and the presence of
advanced radiographic OA (K&L scale 3–4)
K&L grade 3–4 Total (n) RR (95% CI)
Men (%) 21 (32.8) 64 Ref.
Women (%) 16 (42.1) 38 1.3 (0.8–2.1)
Age at operation in groups (%)
< 30 years 3 (12.5) 24 Ref.
30–49.9 years 19 (45.2) 42 3.6 (1.2–11.0)
≥ 50 years 15 (41.7) 36 3.3 (1.1–10.3)
BMI at operation (%)
Normal weight 12 (24.0) 50 Ref.
Overweight 21 (45.7) 46 1.9 (1.1–3.4)
Obese 4 (66.7) 6 2.8 (1.3–5.9)
Work (%)
Office or light work 32 (35.2) 92 Ref.
Heavy work 5 (45.5) 11 1.3 (0.6–2.6) Fracture classification (%) Weber A – 5 – Weber B 20 (30.8) 65 Ref. Weber C 17 (53.1) 32 1.7 (1.1–2.8) Fracture-dislocation (%) No 26 (31.0) 84 Ref. Yes 11 (61.1) 18 2.0 (1.2–3.2)
Fracture medial malleolus (%)a
No 13 (22.0) 59 Ref.
Yes 24 (55.8) 43 2.5 (1.5–4.4)
Fracture posterior malleolus (%)a
No 31 (35.6) 87 Ref.
Yes 6 (40.0) 15 1.1 (0.6–2.2)
Time to follow-up visit (%)
<15 years 10 (29.4) 34 Ref.
15–19.9 years 13 (35.1) 37 1.2 (0.6–2.4)
≥ 20 years 14 (45.2) 31 1.5 (0.8–2.9)
surgery. Patients should be informed about this additional risk and counselled regarding weight reduction. Another important reason for risk factor identification is to inform the patient about future risk of OA (individual predictions) and adapt therapy to available treatment options to postpone the undesirable outcome. Our study allowed prediction for individual factors as well as risk categories defined simply by the number of risk factors present in a particular patient. We are not aware of any published study with long-term follow-up that has assessed and quantified these issues in the context of post-traumatic ankle OA.
Of the limited studies on long-term outcomes following ankle fractures with follow-up beyond ten years [5–8], three [5–7] reported on small numbers of patients (25, 32 and 45, respectively). The fourth [8] evaluated the influence of location and severity of cartilage damage in 109 patients 13 years after ankle fracture. Deep lesions on the anterior and lateral aspect of the talus were associated with clinical signs of OA, and deep lesions on the medial malleolus were associated with both clinical and radiographic signs of OA. This is in agreement with our findings of a higher incidence of symptomatic advanced radiographic OA in the presence of an associated medial malleolar fracture. Other studies reporting on midterm results (less than ten years) found a greater incidence of post-traumatic ankle OA among patients classified with bimalleolar fractures as compared to those with a single malleolar fracture [10,11]. A fracture-dislocation has been identified as a risk factor for OA in previous studies [6,10,11]. The greater risk of radiographic OA following a Weber C as compared to a Weber B fracture was reported in some [12, 14, 22] but not all midterm follow-up studies [10]. Müller et al. [12] reported an inci-dence of 38 (Weber C) vs 14% (Weber B) four to 12 years
after malleolar fracture, Fleischer and Warncke [22] an incidence of 46 vs 28% (Weber C vs Weber B, respectively) eight years postoperatively and Lindsjö [11] an incidence of 33 (Weber C) vs 12% (Weber B) two to six years postoper-atively. These reported incidences are lower than ours (53 after Weber C vs 31% following Weber B), which can be explained by their much shorter follow-up and by use of different definitions of OA. With respect to the influence of age, our results are in agreement with Lorez and Hintermann [13] who reported on better radiographic and clinical results in patients less than 30 years of age at the time of injury. Finally, we found a substantially increasing risk for radio-graphic post-traumatic ankle OA with rising BMI. To the best of our knowledge BMI influence on midterm and long-term development of ankle OA has not been examined. In general, a higher risk for ankle fractures in overweight and obese persons has been suggested [23, 24]. Additionally, overweight and obese subjects seem to sustain more severe types of ankle fractures [25–27]. We also found a higher proportion of displaced fractures in the obese group (data not shown), but this does not entirely explain the higher OA risk in overweight and obese patients because a significant influence persisted even after adjusting for other risk factors including fracture severity. Böstman [28] reported a greater risk for loss of reduction after closed and open treatment of ankle fractures in overweight and obese patients. However, the proportion of all patients experiencing this complication was small (3.6%).
The criteria to determine radiographic and clinical OA, judging from the sparse indications in some studies, were different, which makes exact comparisons of incidences difficult. A variety of scores were used and whether authors evaluated only radiographic or clinical OA or both was
Table 4 Incidence of radio-graphic and symptomatic ad-vanced OA according to the number of risk factors present
aTo categorise a patient as being
at risk or not, the continuous risk factors were dichotomised: age<
30 vs≥30 years, BMI normal
weight vs overweight/obese,
time since surgery<20 vs≥
20 years
Risk
factors (n)a
Patients (n) per risk factor category
Incidence of advanced radiographic OA
Incidence of symptomatic advanced radiographic OA 0 5 0 (0%) 0 (0%) 1 22 2 (9.1%) 1 (4.5%) 2 29 5 (17.2%) 2 (6.9%) 3 28 18 (64.3%) 8 (28.6%) 4 18 12 (66.7%) 8 (44.4%) 5 – – –
Table 3 Risk factors for ad-vanced radiographic ankle OA (univariate and multivariate lo-gistic regression models)
Crude OR (95% CI) Adjusted OR (95% CI)
Age≥30 (01) vs <30 years 5.41 (1.49–19.65) 7.72 (1.82–32.78)
BMI, continuous 1.19 (1.04–1.36) 1.17 (1.01–1.37)
Fracture Weber C (01) vs B 2.83 (1.19–6.74) 3.19 (1.08–9.40)
Medial malleolar fracture (yes01) 4.47 (1.89–10.57) 3.97 (1.47–10.75)
sometimes not specified. Furthermore, the literature is char-acterised by a lack of long-term studies with adequate sam-ple size to evaluate several risk factors at the same time and to take potential confounding into account.
We also evaluated the influence of the identified risk factors according to risk categories, defined as number of risk factors present per patient, and observed a substantial
risk increase in the presence of three factors and more. Almost half of the patients (46 of 102) fell into this category with an incidence of advanced radiographic OA of 64–67% (30/102) and an incidence of symptomatic advanced radio-graphic OA of 28–45% (16 of 102). These numbers indicate that in the long term a considerable number of patients may ultimately require additional reconstructive surgery.
Fig. 1 Incidence of symptomatic advanced radiographic OA according to fracture type and presence or absence of an associated medial malleolar fracture
Table 5 Univariate association for each risk factor and the presence of symptomatic ad-vanced radiographic OA
a
All fracture types (Weber A, B and C) included
AOFAS pain score <40 & K&L grade 3–4 Total (n) RR (95% CI)
Men (%) 13 (20.3) 64 Ref.
Women (%) 6 (15.8) 38 0.8 (0.3–1.9)
Age at operation in groups (%)
< 30 years 2 (8.3) 24 Ref.
30–49.9 years 10 (23.8) 42 2.9 (0.7–12.0)
≥ 50 years 7 (19.4) 36 2.3 (0.5–10.3)
BMI at operation (%)
Normal weight 6 (16.0) 50 Ref.
Overweight 9 (19.6) 46 1.6 (0.6–4.2) Obese 2 (33.3) 6 2.8 (0.7–10.8) Fracture classification (%) Weber A – 5 – Weber B 7 (10.8) 65 Ref. Weber C 12 (37.5) 32 3.6 (1.6–8.2) Fracture-dislocation (%) No 13 (15.5) 84 Ref. Yes 6 (33.3) 18 2.2 (0.9–4.9)
Fracture medial malleolus (%)a
No 5 (8.5) 59 Ref.
Yes 14 (32.6) 43 3.8 (1.5–9.9)
Fracture posterior malleolus (%)a
No 15 (17.2) 87 Ref.
Yes 4 (26.7) 15 1.5 (0.6–4.0)
Time to follow-up visit (%)
<15 years 4 (11.8) 34 Ref.
15–19.9 years 8 (21.6) 37 1.8 (0.6–5.6)
Limitations
Our first limitation was that only 27% of patients operated upon were available for follow-up visit 12–22 years post-operatively. The considerable number of patients lost to follow-up (34%) is probably related to the fact that (1) at the time of operation patients were relatively young, and as a consequence a larger proportion had moved out of the area, and (2) our hospital is a reference trauma centre in a tourist area. It seems unlikely that this patient group includ-ed a higher proportion of good or poor results than those available for follow-up. However, we acknowledge that of patients who had not died or were lost to follow-up (26%), the decision to participate or not might have been related to their outcome which could have biased our results. Never-theless, at baseline the risk factor distribution did not sub-stantially differ between all patients who underwent ORIF and those eventually seen in follow-up.
Second, all fractures were classified only according to Danis-Weber, rather than any other classification systems (Lauge-Hansen, AO/OTA) [29,30], which might have pro-vided a more detailed analysis. Third, determination of the quality of fracture reduction and fixation was not possible because there was no systematic information available in the operative report, and we did not have immediate postoper-ative radiographs. Fourth, the number of secondary outcome events was limited (n019) and multivariate analysis was thus not suitable. However, similar risk factors were found in univariate analyses for both primary and secondary out-come. Fifth, while it is a weakness that we do not have information on preoperative OA, it has been noted that the prevalence of primary (not post-traumatic) OA in the ankle is very low [2, 31]. Moreover, about half of the patient population was under the age of 40 years, an age group in which OA rarely occurs. Thus, the presumption that the OA seen at follow-up was related to the fracture should be valid. Lastly, the risk factors identified in our study require vali-dation in other patient populations (external valivali-dation).
Conclusion
Advanced radiographic ankle OA was common (36.3%) 18 years after malleolar fractures, especially following We-ber C fractures and associated medial malleolar fractures. Risk is also increased with rising BMI, in patients over 30 years of age at the time of injury and with increasing length of time since surgery. The probability of developing post-traumatic ankle OA among patients having three or more risk factors was 60–70%. The most important risk factors identified for the development of symptomatic ad-vanced radiographic OA were related to the type of fracture, either a Weber C fracture or an associated fracture of the
medial malleolus independent of whether the fracture was a Weber B or C. Orthopaedic surgeons need to be aware of this information in order to clearly inform high-risk patients.
Acknowledgment We are indebted to Prof. Thomas Perneger for his
valuable comments regarding data analysis.
Conflict of interest The authors declare that they have no conflict of
interest.
References
1. Brown TD, Johnston RC, Saltzman CL, Marsh JL, Buckwalter JA (2006) Posttraumatic osteoarthritis: a first estimate of incidence, prevalence, and burden of disease. J Orthop Trauma 20(10):739–744 2. Saltzman CL, Salamon ML, Blanchard GM, Huff T, Hayes A, Buckwalter JA et al (2005) Epidemiology of ankle arthritis: report of a consecutive series of 639 patients from a tertiary orthopaedic
center. Iowa Orthop J 25:44–46
3. Valderrabano V, Horisberger M, Russell I, Dougall H, Hintermann B (2009) Etiology of ankle osteoarthritis. Clin Orthop Relat Res
467(7):1800–1806
4. Horisberger M, Valderrabano V, Hintermann B (2009) Posttrau-matic ankle osteoarthritis after ankle-related fractures. J Orthop
Trauma 23(1):60–67
5. Day GA, Swanson CE, Hulcombe BG (2001) Operative treatment of ankle fractures: a minimum ten-year follow-up. Foot Ankle Int
22(2):102–106
6. De Vries JS, Wijgman AJ, Sierevelt IN, Schaap GR (2005) Long-term results of ankle fractures with a posterior malleolar fragment. J Foot Ankle Surg 44(3):211–217
7. Jarde O, Vives P, Havet E, Gouron R, Meunier W (2000) Malleolar fractures. Predictive factors for secondary osteoar-thritis. Retrospective study of 32 cases. Acta Orthop Belg 66
(4):382–388
8. Stufkens SA, Knupp M, Horisberger M, Lampert C, Hintermann B (2010) Cartilage lesions and the development of osteoarthritis after internal fixation of ankle fractures: a prospective study. J Bone
Joint Surg Am 92(2):279–286
9. Stufkens SA, van den Bekerom MP, Kerkhoffs GM, Hintermann B, van Dijk CN (2011) Long-term outcome after 1822 operatively treated ankle fractures: a systematic review of the literature. Injury
42:119–127
10. Beris AE, Kabbani KT, Xenakis TA, Mitsionis G, Soucacos PK, Soucacos PN (1997) Surgical treatment of malleolar fractures. A
review of 144 patients. Clin Orthop Relat Res 341:90–98
11. Lindsjö U (1981) Operative treatment of ankle fractures. Acta
Orthop Scand Suppl 189:1–131
12. Müller J, Plaass U, Willenegger H (1971) Late results after surgi-cally treated malleolar fractures. Helv Chir Acta 38(3):329–337 13. Lorez LG, Hintermann B (1999) Significance of concomitant
injuries in malleolar fractures. A prospective study. Unfallchirurg
102(12):949–954
14. Lindsjö U (1985) Operative treatment of ankle fracture-dislocations. A follow-up study of 306/321 consecutive cases. Clin Orthop Relat
Res 199:28–38
15. Danis R (1949) Théorie et pratique de l'ostéosynthèse. Masson, Paris
16. Weber B (1966) Die Verletzungen des oberen Sprunggelenkes. Aktuelle Probleme in der Chirurgie. Huber, Stuttgart
17. Kellgren JH, Lawrence JS (1957) Radiological assessment of
18. (2005) The atlas of standard radiographs of arthritis.
Rheumatolo-gy (Oxford) 44 Suppl 4:iv46–iv72
19. Kessler S, Guenther KP, Puhl W (1998) Scoring prevalence and severity in gonarthritis: the suitability of the Kellgren & Lawrence scale. Clin Rheumatol 17(3):205–209
20. LaValley MP, McAlindon TE, Chaisson CE, Levy D, Felson DT (2001) The validity of different definitions of radiographic wors-ening for longitudinal studies of knee osteoarthritis. J Clin
Epide-miol 54(1):30–39
21. Kitaoka HB, Alexander IJ, Adelaar RS, Nunley JA, Myerson MS, Sanders M (1994) Clinical rating systems for the ankle-hindfoot,
midfoot, hallux, and lesser toes. Foot Ankle Int 15(7):349–353
22. Fleischer GM, Warncke P (1989) Late results following ankle joint
osteosyntheses. Zentralbl Chir 114(6):381–387
23. Bergkvist D, Hekmat K, Svensson T, Dahlberg L (2009) Obesity in
orthopedic patients. Surg Obes Relat Dis 5(6):670–672
24. Valtola A, Honkanen R, Kröger H, Tuppurainen M, Saarikoski S, Alhava E (2002) Lifestyle and other factors predict ankle fractures in perimenopausal women: a population-based prospective cohort
study. Bone 30(1):238–242
25. Böstman OM (1994) Body mass index of patients with elbow and
ankle fractures requiring surgical treatment. J Trauma 37(1):62–65
26. Spaine LA, Bollen SR (1996) ‘The bigger they come …’: the
relationship between body mass index and severity of ankle frac-tures. Injury 27(10):687–689
27. Strauss EJ, Frank JB, Walsh M, Koval KJ, Egol KA (2007) Does obesity influence the outcome after the operative treatment of ankle fractures? J Bone Joint Surg Br 89(6):794–798
28. Böstman OM (1995) Body-weight related to loss of reduction of fractures of the distal tibia and ankle. J Bone Joint Surg Br 77
(1):101–103
29. Lauge-Hansen N (1950) Fractures of the ankle. II. Combined experimental-surgical and experimental-roentgenologic
investiga-tions. Arch Surg 60(5):957–985
30. Marsh JL, Slongo TF, Agel J, Broderick JS, Creevey W, DeCoster TA et al (2007) Fracture and dislocation classification compendium -2007: Orthopaedic Trauma Association classification, database and
outcomes committee. J Orthop Trauma 21(10 Suppl):S1–S133
31. Huch K, Kuettner KE, Dieppe P (1997) Osteoarthritis in ankle and