Matching between regional coronary
vasodilator capacity and corresponding
circumferential strain in individuals with normal
and increasing body weight
Gabriella M. Vincenti, MD,
aGiuseppe Ambrosio, MD, PhD,
bJean-Noe
¨l Hyacinthe, MD,
cAlessandra Quercioli, MD,
aYann Seimbille, MD,
cFranc
¸ois Mach, MD,
aOsman Ratib, MD,
cJean-Paul Valle
´e, MD,
cand Thomas H. Schindler, MD
aBackground. To define the relationship between regional coronary vasodilator capacity and myocardial circumferential strain at rest in normal weight, overweight, and obese indi-viduals with normal global left-ventricular function.
Methods and Results. Myocardial blood flow at rest and during pharmacologic vasodilation
was measured with 13N-ammonia PET/CT in mL/g/minute in normal weight control (CON,
n 5 12), overweight (OW, n 5 10), and obese individuals (OB, n 5 10). In addition, resting myocardial function was evaluated as circumferential strain (
”
c, %) by MRI. Global myo-cardial flow reserve (MFR) did not differ significantly between CON and OW (2.98 ± 0.96 vs 2.70 ± 0.66, P 5 .290), whereas it declined significantly in OB (1.98 ± 1.04, P 5 .030). Further, global
”
c (%) was comparable between CON, OW, and OB (20.24 ± 0.03, 20.23 ± 0.02, and 20.23 ± 0.04) but it was lowest in OB when normalized to the rate-pressure product (N
” c: 20.31 ± 0.06, 20.32 ± 0.05, and 20.26 ± 0.08). When MFR of the three major coronary ter-ritories was correlated with corresponding
”
c, a positive association was observed in CON (r 5 0.36, P 5 .030), in OW (r 5 0.54, P 5 .002), and also in OB when relating N
”
c to coro-nary vascular resistance during pharmacologic vasodilation (r 5 20.46, P 5 .010).
Conclusions. Higher coronary vasodilator capacity is related to corresponding regional circumferential strain at rest in non-obese individuals, while this is also observed for reduced MFR in obesity. (J Nucl Cardiol 2012;19:693–703.)
Key Words: Coronary circulationÆ myocardial blood flow Æ myocardial function Æ
magnetic resonance imagingÆ obesity Æ positron emission tomography
INTRODUCTION
Normal coronary circulatory function has been widely appreciated to ascertain important antiathero-sclerotic and antithrombotic effects mainly via flow-mediated and endothelium-dependent release of nitric
oxide.1 Cardiovascular risk factors such as arterial
hypertension, hypercholesterolemia, smoking, diabetes mellitus, and obesity may impair a proper functioning of
the coronary circulation function.1The identification of
an abnormal coronary circulatory function has been
From the Division of Cardiology, Nuclear Cardiology and Cardiac PET/CT, Department of Specialities in Medicine,a Divisions of Nuclear Medicine and Radiology, Department of Medical Imaging and Information Science,cUniversity Hospital of Geneva, Geneva, Switzerland; and Division of Cardiology, School of Medicine,b University of Perugia, Perugia, Italy.
Financial support: Research Grants 3200B0-122237 from the Swiss National Science Foundation (SNF), with contributions of the Clinical Research Center, University Hospital and Faculty of Med-icine, Geneva and the Louis-Jeantet Foundation, Swiss Heart Foundation, and Fellowship Grants from the European Society of Cardiology (ESC) and the Italian Society of Cardiology (Societa‘ Italiana di Cardiologia; SIC) (G.V.).
Received for publication Dec 14, 2011; final revision accepted Apr 13, 2012
Reprint requests: Thomas H. Schindler, MD, Division of Cardiology, Nuclear Cardiology and Cardiac PET/CT, Department of Speciali-ties in Medicine, University Hospital of Geneva, 6th Floor, Rue Gabrielle-Perret-Gentil 4, 1211 Geneva, Switzerland; thomas. [email protected].
1071-3581/$34.00
CopyrightÓ 2012 American Society of Nuclear Cardiology. doi:10.1007/s12350-012-9570-5
demonstrated to provide substantial diagnostic and prognostic information additional to that derived from
angiographic and coronary risk factor assessment.1-6The
exact pathophysiological mechanisms underlying abnor-mal coronary circulatory function remain to be further elucidated, but increases in reactive oxygen species associated with an inflammation of the arterial wall have been suggested as a common final pathway of a variability of cardiovascular risk factors to alter the
coronary vasodilator capacity.7-9In the normal setting,
coronary flow increases for maintaining an appropriate metabolic and oxygen supply of the left ventricle adapt according to its inotropic state at rest or during
phys-iological stress.10-13 This relationship between
left-ventricular function and myocardial flow is also referred
to as myocardial perfusion-contracting matching.14
Toward this direction, myocardial tagging techniques with MRI have provided new insight into normal and
abnormal patterns of regional cardiac contractility.15,16
Previous investigations16 have provided some first
evidence that a diminished myocardial flow reserve (MFR) may be paralleled by a reduced regional myo-cardial function in asymptomatic cardiovascular risk individuals as determined with contrast-enhanced MRI perfusion and tagging studies. As we and others have
demonstrated,17-19 increases in body weight are
com-monly paralleled by a progressive dysfunction of the coronary circulation, while it may also alter regional
LV function in obese individuals.20 The possible
relationship between coronary circulatory function and corresponding regional contractility in healthy, normal-weight, and those with increasing body normal-weight, however, remains to be elucidated.
With this in mind, we aimed to define a possible relationship between regional coronary vasodilator capacity and myocardial circumferential strain or wall motion at rest in normal-weight, overweight, and obese individuals with normal global left-ventricular function.
METHODS Study Population and Design
The study population included 32 asymptomatic individ-uals without traditional cardiovascular risk factors such as arterial hypertension, hypercholesterolemia, smoking, and
diabetes mellitus (Table1). Study participants underwent an
initial screening visit that included a physical examination, electrocardiogram (ECG), blood pressure measurements, and routine blood chemistry in a fasting state. Excluded were study candidates with a history of variant angina, a family history of premature CAD, or clinically manifest cardiovascular or any other disease. In addition, no study participant was on any cardiac or vasoactive medication. Physical examination revealed normal findings in all study participants and they had normal resting ECGs. All study participants then
under-went 13N-ammonia PET/CT (64-slice Biograph HiRez
TruePoint PET-CT scanner, Siemens, Erlangen, Germany) measurements of myocardial blood flow (MBF) at rest and
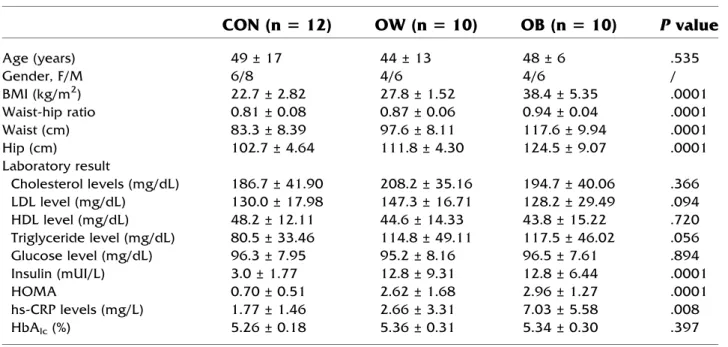
Table 1. Characteristics of study population (n = 32)
CON (n 5 12)
OW (n 5 10)
OB (n 5 10)
P value
Age (years) 49 ± 17 44 ± 13 48 ± 6 .535 Gender, F/M 6/8 4/6 4/6 / BMI (kg/m2) 22.7 ± 2.82 27.8 ± 1.52 38.4 ± 5.35 .0001 Waist-hip ratio 0.81 ± 0.08 0.87 ± 0.06 0.94 ± 0.04 .0001 Waist (cm) 83.3 ± 8.39 97.6 ± 8.11 117.6 ± 9.94 .0001 Hip (cm) 102.7 ± 4.64 111.8 ± 4.30 124.5 ± 9.07 .0001 Laboratory result Cholesterol levels (mg/dL) 186.7 ± 41.90 208.2 ± 35.16 194.7 ± 40.06 .366 LDL level (mg/dL) 130.0 ± 17.98 147.3 ± 16.71 128.2 ± 29.49 .094 HDL level (mg/dL) 48.2 ± 12.11 44.6 ± 14.33 43.8 ± 15.22 .720 Triglyceride level (mg/dL) 80.5 ± 33.46 114.8 ± 49.11 117.5 ± 46.02 .056 Glucose level (mg/dL) 96.3 ± 7.95 95.2 ± 8.16 96.5 ± 7.61 .894 Insulin (mUI/L) 3.0 ± 1.77 12.8 ± 9.31 12.8 ± 6.44 .0001 HOMA 0.70 ± 0.51 2.62 ± 1.68 2.96 ± 1.27 .0001 hs-CRP levels (mg/L) 1.77 ± 1.46 2.66 ± 3.31 7.03 ± 5.58 .008 HbAlc(%) 5.26 ± 0.18 5.36 ± 0.31 5.34 ± 0.30 .397Values are mean ± SD.
P values between groups by ANOVA.
CON, Controls; OW, overweight; OB, obesity; BMI, body mass index; hs-CRP, high sensitive C-reactive protein; HbAlc, hemoglobin
during pharmacologically induced hyperemia with dipyridam-ole in a fasting state to evaluate coronary circulatory function. A prerequisite for the study inclusion was a normal stress-rest
perfusion imaging on 13N-ammonia PET/CT, which widely
excluded the presence of flow-limiting epicardial CAD
lesions.18Following, study participants were grouped
accord-ing to their body mass index (BMI, kg/m2): control group
20 B BMI \ 25 (CON; n = 12), overweight group 25 B BMI \ 30 (OW; n = 10), obese group BMI C 30 (OB; n = 10).
Blood chemistry included plasma glucose, hemoglobin A1c, insulin, total cholesterol, HDL and LDL cholesterol, triglycerides levels, and high-sensitive C-reactive protein. In addition, Homeostasis Model Assessment (HOMA) was cal-culated as index of insulin resistance (HOMA = fasting plasma glucose [mmol/L] 9 fasting plasma insulin [pmol/L]/
162).21Within 20 days of the cardiac13N-ammonia PET/CT
study, cardiac magnetic resonance (CMR) tagging was per-formed using a 1.5T Espree system (Siemens Medical Solutions, Erlangen, Germany) to evaluate possible alterations
in global and regional myocardial motion patterns.22The study
was approved by the University Hospitals of Geneva Institu-tional Review Board (No: 07-183), and each participant signed the approved informed consent form.
Quantification of MBF with PET/CT
Following the topogram used to define the axial field-of-view and a low-dose CT scan (120 kV, 30 mA) for attenuation correction, PET emission data were acquired during shallow breathing following intravenous injection of
&500-550 MBq of 13N-ammonia. The CT-based attenuation
correction map was used to reconstruct the PET emission data. MBF quantification was performed first at rest and then during pharmacologic vasodilation with dipyridamole-induced hyper-emia applying intravenously standard dose of 140 lg/kg/
minute.23,24 The relative distribution of13N-ammonia uptake
of the left ventricle was assessed visually on short- and long-axis myocardial slices and semiquantitatively on the corre-sponding polar map from the last static 18-minute transaxial PET image. Time-activity curves from the first 12-dynamic frames (12 for 10 seconds each), in concert with a
two-compartment tracer kinetic model,25 were used to calculate
global and regional MBF in mL/g/minute of the left ventricle with the use of the PMOD software package (version 2.8
PMOD Technologies Ltd, Zurich, Switzerland).18 Regional
MBFs of the LAD, LCx, and RCA territory were averaged on a polar map and the resulting mean MBF was defined as global MBF of the left ventricle. Heart rate, blood pressure, and a 12-lead ECG were recorded continuously during each MBF measurement. From the average of heart rate and blood pressure during the first 2 minutes of each image acquisition, the rate-pressure product (RPP) was determined as an index of cardiac work. To account for interindividual variations in coronary driving pressure, an index of coronary vascular resistance (CVR) was determined as the ratio of mean arterial blood pressure to MBF (mm Hg/mL/minute/g).
Protocol for Tagged MRI
Image acquisition. Study participants underwent
MRI examination using a 1.5T Espree system (Siemens Medical Solutions, Erlangen, Germany). Individuals were scanned in the supine position, using a 6-element anterior body array coil combined with a 6-element posterior spine coil. Following the acquisition of localizers, 2-chamber, 4-chamber, and short axis high-resolution steady state free precession (SSFP) cine imaging
(pixel size = 1.3 9 1.3 9 7 mm3, temporal resolution &
25-40 ms), myocardial tagging was performed in a three short axis view with complementary spatial modulation of magnetization
technique.26 We used a prospectively ECG-gated, balanced
SSFP.22The field of view was 340 9 340 mm, matrix 192 with
32% phase resolution, slice thickness 7 mm, TE 1.2, and flip angle 20°. Tag distance was 7 mm and localized shimming to adjust the static magnetic field within each slice was performed prior to acquisition. The temporal resolution was 25-40 ms, depending on the heart rate and breath-hold capacity of the subjects. The two tag line directions were acquired in a single breath-hold in end-expirium.
Strain analysis. For tag analysis, we used extrema
temporal chaining.27 Strain analysis describes the change of
shape of material (i.e., myocardium) resulting from
deforma-tion, which are used to present regional myocardial function.26
In this study, maximal circumferential strain (
”
c, %),
reflect-ing intramural circumferential shortenreflect-ing and defined as”
c = length (time t) - length (time 0)/(time 0),26was
calcu-lated semi-automatically from the tracked points of the mid-wall in six cardiac sectors for three slices (3 short axis views). Length is given in millimeter and time in seconds. The sectors
were defined according to the AHA 17-segment model.28
Further, the sectors were defined by the software starting from the RV/LV border assigned by the user. For this study, we focused on the mid-wall systolic circumferential shortening, using timing information (onset and peak time) and the mid-wall systolic circumferential strain. When mentioned, ‘‘mid-wall motion,’’ it refers to max-min of the circumferential shortening time curve in the considered cardiac sector. The circumferential strain data were averaged in the three main coronary perfusion territories according subtended to the LAD, LCx, and RCA. The global systolic circumferential strain (g
”
c) was defined as
the circumferential strain averaged across all segments.16
Further, obesity is commonly associated with elevations in
arterial blood pressures and, thus, myocardial workload,18
leading to an increase in left ventricular preload, which may alter global and regional circumferential strain.
”
c, therefore, was normalized to the RPP at rest (N
”
c =
”
c divided by RPP rest multiplied by 10000) to compensate for possible interin-dividual variations in
”
c (%) due to hemodynamic differences.
Statistical Analysis
Data are presented as mean ± SD for quantitative and absolute frequencies for qualitative variables. The appropriate Wilcoxon rank test for independent or paired samples was used. Comparison between the different groups was performed by one-way analysis of variance, followed by Scheffe’s multiple
comparison tests. Pearson’s correlation coefficient (r), assuming a linear regression, was calculated to investigate possible associations between MBF and CVR, myocardial strain, and hemodynamic parameters. Statistical significance was assumed if a null hypothesis could be rejected at P = .05. All statistical analyses were performed with SPSS for Windows 18.0 (SPSS).
RESULTS Patient Characteristics
The clinical and metabolic profiles among the three
groups studied are given in Table1. The increase in
BMI and waist-hip ratio in the three study groups was accompanied by a significant increase in fasting insulin plasma levels, HOMA as index for insulin resistance, triglycerides, and hs-CRP plasma levels. Conversely, lipid profile, glucose plasma levels, and HbA1c did not differ significantly between groups.
Hemodynamics and Global MBF
At baseline, heart rate was comparable between
CON and OW, while it was higher in OB (Table2).
Further, SBP and DBP did not differ significantly between groups. As heart rate was higher in OB, also the resting RPP was significantly higher in OB than in CON and OW. As regards, the resting MBF was higher in OB but not significantly different among groups. During dipyridamole stimulation of hyperemic flows, heart rates increased significantly from rest, but they were
compa-rable among groups (Table2). In addition, SBP mildly
decreased during dipyridamole stimulation from rest in CON and OB, while it remained largely unchanged in OW. There were no significant differences in heart rate during pharmacologic vasodilation among the study groups. Conversely, SBP, DBP, and the RPP progres-sively increased from CON to OW and OB during
dipyridamole stimulation (Table 2).
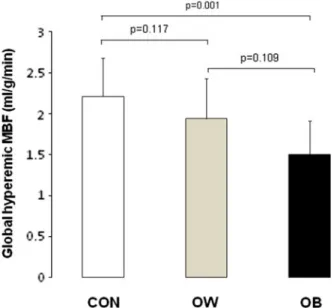
Compared with CON, global hyperemic MBFs and MFR tended to be lower in OW but they decreased
significantly in OB (Figure1; Table2). When the global
hyperemic MBFs were related to the mean arterial blood pressure to account for possible interindividual varia-tions in coronary driving pressure, the global CVR (mean arterial blood pressure/MBF) widely mirrored the MBF values during pharmacologic vasodilation for each
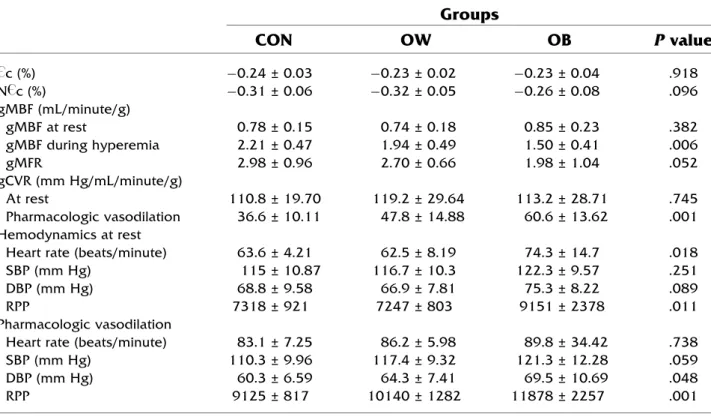
Table 2. Global circumferential strain derived from tagging MRI and global myocardial blood flow
(gMBF), coronary vascular resistance (gCVR), and hemodynamic findings during PET/CT exam
Groups
CON
OW
OB
P value
” c (%) -0.24 ± 0.03 -0.23 ± 0.02 -0.23 ± 0.04 .918 N ” c (%) -0.31 ± 0.06 -0.32 ± 0.05 -0.26 ± 0.08 .096 gMBF (mL/minute/g) gMBF at rest 0.78 ± 0.15 0.74 ± 0.18 0.85 ± 0.23 .382 gMBF during hyperemia 2.21 ± 0.47 1.94 ± 0.49 1.50 ± 0.41 .006 gMFR 2.98 ± 0.96 2.70 ± 0.66 1.98 ± 1.04 .052 gCVR (mm Hg/mL/minute/g) At rest 110.8 ± 19.70 119.2 ± 29.64 113.2 ± 28.71 .745 Pharmacologic vasodilation 36.6 ± 10.11 47.8 ± 14.88 60.6 ± 13.62 .001 Hemodynamics at restHeart rate (beats/minute) 63.6 ± 4.21 62.5 ± 8.19 74.3 ± 14.7 .018
SBP (mm Hg) 115 ± 10.87 116.7 ± 10.3 122.3 ± 9.57 .251
DBP (mm Hg) 68.8 ± 9.58 66.9 ± 7.81 75.3 ± 8.22 .089
RPP 7318 ± 921 7247 ± 803 9151 ± 2378 .011
Pharmacologic vasodilation
Heart rate (beats/minute) 83.1 ± 7.25 86.2 ± 5.98 89.8 ± 34.42 .738
SBP (mm Hg) 110.3 ± 9.96 117.4 ± 9.32 121.3 ± 12.28 .059
DBP (mm Hg) 60.3 ± 6.59 64.3 ± 7.41 69.5 ± 10.69 .048
RPP 9125 ± 817 10140 ± 1282 11878 ± 2257 .001
Values are mean ± SD.
P values between groups by ANOVA. CON, Controls; OW, overweight; OB, obesity;
”
c (%), maximal circumferential strain; N ”
c (%), normalized ”
c (%); MBF, myocardial blood flow; MFR, myocardial flow reserve; CVR, coronary vascular resistance; SBP, systolic blood pressure.
group studied (Table2). The group comparison of global hyperemic MBF, CVR, and MFR in CON was significantly different from OW and OB, respectively (P B .05 by ANOVA).
Regional MBFs and Circumferential Strain Regional MBFs at rest, during pharmacologically induced hyperemia and the corresponding MFR in the territory supplied by the LAD, LCx, and RCA did not
differ significantly within CON, OW, and OB
(Table3). The intergroup comparison did not reveal
significant differences among groups for regional resting flow, whereas regional hyperemic MBF and MFR were significantly lower in OB. In addition, regional CVR at rest and during dipyridamole stim-ulation widely mirrored those of regional MBF of
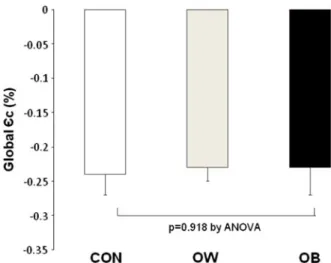
study group (Table3). As regards, the maximal
circumferential strain ( ” c,%), global ” c (g ” c,%), for all segments was -0.23 ± 0.03 and it did not differ
significantly between groups (Table2; Figure2). Also,
the normalized g ” c (gN
”
c) was comparable between CON and OW, while significantly lower in OB
(P = .006 and P = .012, respectively) (Table2).
Addressing regional ”
c and N ”
c within each group
(Table3), they were significantly greater in the LCx
than in the LAD and lower in the RCA territory (P \ .05). While regional
”
c for the LAD, LCX, and RCA territory did not differ between groups, the corresponding N
”
c values in OB were significantly lower to those in CON and in OW.
Figure 1. Global hyperemic MBF in CON, OW, and OB.
Table 3. Regional MBF, CVR, and circumferent ial strain
CON
OW
OB
LAD
LCx
RCA
LAD
LCx
RCA
LAD
LCx
RCA
MBF rest 0.78 ± 0.18 0.81 ± 0.19 0.75 ± 0.12 0.73 ± 0.16 0.75 ± 0.20 0.74 ± 0.22 0.86 ± 0.23 0.85 ± 0.27 0.86 ± 0.23 CVR rest 111 ± 221 106 ± 2 2 112 ± 1 8 119 ± 2 8 118 ± 3 0 121 ± 3 7 111 ± 2 9 117 ± 4 2 110 ± 2 4 MBF hyperemia 2.08 ± 0.54 2.30 ± 0.54 2.16 ± 0.56 1.82 ± 0.51 1.96 ± 0.55 1.83 ± 0.55 1.50 ± 0.40 1.50 ± 0.39 1.49 ± 0.47* CVR hyperemia 3 9 ± 11 36 ± 1 3 3 8 ± 14 49 ± 1 6 4 6 ± 14 49 ± 1 7 6 1 ± 15 61 ± 1 3 6 2 ± 15* MFR 2.83 ± 1.04 2.99 ± 1.08 2.94 ± 0.98 2.54 ± 0.72 2.72 ± 0.81 2.59 ± 0.85 1.96 ± 1.07 2.06 ± 1.24 1.89 ± 0.95* ” c (%) -0.23 ± 0.03 -0.26 ± 0.04 -0.21 ± 0.05 -0.22 ± 0.02 -0.26 ± 0.03 -0.21 ± 0.03 -0.22 ± 0.05 -0.27 ± 0.06 -0.21 ± 0.03 N ” c (%) -0.33 ± 0.08 -0.36 ± 0.06 -0.29 ± 0.08 -0.31 ± 0.06 -0.35 ± 0.05 -0.29 ± 0.06 -0.25 ± 0.08 -0.31 ± 0.09 -0.24 ± 0.06* MBF , Myoc ardial blood fl o w (mL/g/m inute) ; CVR , coron ary vascu lar resistance (mm Hg/m L/g /min ute); MFR , myoca rdi al fl o w reserve; DP , dipyr idamo le; ” c (%), max imal circumf erenti al strain ; N ” c(%), norma lized ” c. * P B .05 betwe en groups by ANOV A.Relation Between MBFs, Hemodynamics, and Circumferential Strain
For the whole study population, global resting MBF significantly correlated with the corresponding RPP (r = 0.57, P \ .001, SEE = 0.16). Conversely, there was no association between global hyperemic MBFs during pharmacologic vasodilation, MFR, and corre-sponding RPP, respectively (r = -0.23, P = .188, SEE = 0.54 and r = 0.25, P = .174, SEE = 0.97).
As regards global ”
c and N ”
c, they correlated inversely with resting RPP, respectively (r = -0.32, P = .057, SEE = 0.03 and r = -0.82, P \ .0001, SEE = 967). In
addition, when evaluating the relationship between global”
c and global MBF at rest, during hyperemia, and MFR, respectively, no association was observed (r = -0.26, P = .144, SEE = 0.185; r = 0.30, P = .096, SEE = 0.527; and r = 0.32, P = .071, SEE = 0.947). In con-trast to this, global N
”
c correlated significantly and inversely with global resting MBF (r = -0.52, P = .002, SEE = 0.164), while positively with global hyperemic MBF and MFR, respectively (r = 0.55, P = .001, SEE = 0.462 and r = 0.64, P \ .0001, SEE = 0.765).
Regarding regional ”
c, no relationship with regional MBF or with corresponding CVR at rest in CON, OW,
and OB was observed (Table 4). Conversely, regional
” c and corresponding hyperemic MBF, CVR, and MFR
correlated in CON and OW but not in OB (Figure 3).
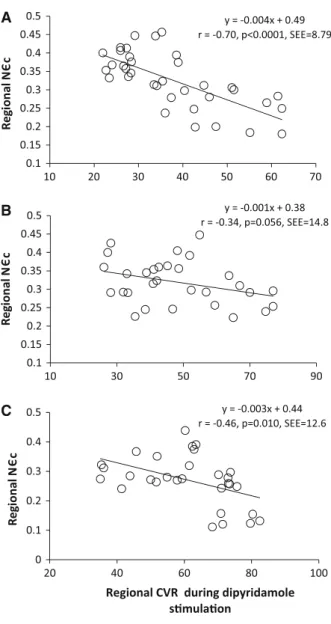
Further, we evaluated possible associations between normalized regional
” c (N
”
c) and coronary flow
param-eters (Table4). As it was observed, regional N
”
c did not correlate with corresponding MBF at rest in CON and OW, while there was a significant and inverse association in OB. Interestingly, when regional N
”
c was related to the CVR at rest, it correlated in OW and OB but not in CON. Further, regional N
”
c was significantly associated with hyperemic MBF and MFR in CON and OW, but again not in OB. However, when possible interindividual differences in intracoronary driving pressure were
Figure 2. Global maximal circumferential strain (
”
c, %) at rest in CON, OW, and OB.
Table 4. Correlations between regional maximal circumferential strain and flow parameters
CON
OW
OB
”
c (%)
N
”
c (%)
”
c (%)
N
”
c (%)
”
c (%)
N
”
c (%)
MBF rest r = 0.07 r = 0.16 r = 0.02 r = -0.29 r = -0.25 r = 20.51
P = .712 P = .340 P = .906 P = .120 P = .178 P = .004
SEE = 0.16 SEE = 0.16 SEE = 0.66 SEE = 0.18 SEE = 0.23 SEE 5 0.21
MBF hyperemia r = 0.42 r = 0.64 r = 0.47 r = 0.37 r = 0.09 r = 0.23
P = .011 P < .0001 P = .006 P = .046 P = .636 P = .220
SEE = 0.49 SEE = 0.40 SEE = 0.47 SEE = 0.51 SEE = 0.43 SEE = 0.41
MFR r = 0.36 r = 0.58 r = 0.54 r = 0.63 r = 0.03 r = 0.30
P = .030 P < .0001 P = .002 P < .0001 P = .880 P = .120
SEE = 0.95 SEE = 0.81 SEE = 0.66 SEE = 0.62 SEE = 1.07 SEE = 0.90
CVR rest r = 0.20 r = 0.02 r = 0.12 r = 0.37 r = 0.14 r = 0.37
P = .237 P = .892 P = .525 P = .046 P = .472 P = .043
SEE = 19.8 SEE = 20.2 SEE = 31.4 SEE = 29.4 SEE = 31.6 SEE 5 29.6
CVR hyperemia r = 20.42 r = 20.70 r = 20.54 r = 20.34 r = -0.16 r = 20.46
P = .011 P < .0001 P = .002 P = .056 P = .409 P = .010
SEE = 11.2 SEE = 8.79 SEE = 13.3 SEE = 14.8 SEE = 15.1 SEE 5 12.6
Significant correlations are indicated in bold.
MBF, Myocardial blood flow (mL/g/minute); MFR, myocardial flow reserve; CVR, coronary vascular resistance (mm Hg/mL/g/ minute);
”
c (%), maximal circumferential strain; N ”
c (%), normalized ”
accounted by the calculated regional CVR, there was a significant and inverse relationship between regional N
”
c and corresponding CVR during dipyridamole
stim-ulation in all the three groups (Figure4, Table4).
DISCUSSION
This study is unique in demonstrating a positive association between increases in regional hyperemic
MBFs or MFR as determined with 13N-ammonia PET
and corresponding regional resting circumferential strain as assessed with tagging MRI in healthy non-obese individuals. Regional increases of coronary vasodilator function, therefore, were paralleled by an enhanced local circumferential strain at rest. This relationship was also observed for obese individuals with reduced hyperemic MBFs but only when values of circumferential strain were normalized to the RPP and related to the CVR during dipyridamole stimulation. When looking at the obesity group with a marked impairment of hyperemic MBFs and MFR, regional coronary vasodilator function at first sight was not correlated with resting circumfer-ential strain. The reason for this observation appears to be related to confounding effects of higher heart rates, A
B
C
Figure 3. Correlation between regional hyperemic MBF in
the territory subtended to the LAD, LCx, and RCA and corresponding local
”
c at rest (%, positive values for display) in CON (A), OW (B), and OB (C).
A
B
C
Figure 4. Correlation between regional CVR during
dipyrid-amole stimulation in the territory subtended to the LAD, LCx, and RCA and corresponding local N
”
c at rest (%, positive values for display) in CON (A), OW (B), and OB (C).
SBPs, and resulting RPP, indicative of the myocardial workload, not only at rest but also at pharmacologic stress in OB when compared to CON and OW. In order to account for this confounding hemodynamic factor, which may lead to interindividual differences in coro-nary driving pressure and an increase in left ventricular preload or extra-vascular resistive forces, regional CVR and normalized circumferential strain (N
”
c) were also evaluated. And indeed, when regional resting N
” c was related to corresponding CVR during pharmacologic vasodilation, we observed a significant and inverse association. Thus, the higher regional resting N
” c was associated with a relatively lower regional CVR during pharmacologic vasodilation in OB. To our best knowl-edge, these findings are first to suggest a conditioning of the coronary vasodilator capacity by resting regional circumferential strain in healthy individuals with
increasing body weight, which deserves further
investigations.
Resting MBFs, RPP, and Circumferential Strain
As observed in the current and previous
investiga-tions,10,12 there is a close linear association between
resting MBF and the RPP as an index of cardiac work and thus myocardial oxygen demand. Increases in myocardial work, therefore, are closely paralleled by commensurate MBF increases to appropriately meet increases in oxygen demand. Interestingly, we could
also demonstrate an inverse association between global”
c and resting RPP. Increases in resting RPP, therefore, were associated with relatively lower global circumfer-ential strain, which can be related to the dependency of regional myocardial function on left ventricular preload
and afterload, and thus on hemodynamic conditions.16
Such observation could also explain why global ” c did not correlate with corresponding resting MBF, whereas a significant and inverse association was observed for global N
”
c. Taken together, however, these unique observations denote a close interrelation between the regulation of resting MBF, myocardial work load, and
circumferential strain.14
In agreement with recent investigation,18 resting
MBFs in OB was higher than in CON and in OW. This relative increase in resting global MBF in OB can be related to higher resting heart rates, SBPs, and
corre-sponding RPP and, in turn, myocardial oxygen
consumption.10The finding of an increase in myocardial
workload in OB paralleled by higher resting MBF also accords with previously reported activation of the sympathetic nervous system and
renin-angiotensin-aldosterone system.18,29Notably, an increase in arterial
blood pressure at rest may have led not only to an
elevation in resting myocardial workload and, thus, MBF but also to increase in left ventricular preload and extra-vascular resistive forces, which, in turn, may have affected the global circumferential strain. And indeed, when we compensated for differences in hemodynamic effects due to increases in resting RPP by calculating the N
”
c, the global and regional N ”
c was lower in OB, while comparable between CON and OW. Of further interest, when we related regional resting N
” c to corresponding regional CVR, we observed a positive and significant association in OW and in OB but not in CON. This observation may stress that in individuals with increasing body weight and an increase in left ventricular preload and extra-vascular resistive forces, left ventricular myocardium underlies an adaptive and relative increase regional N
”
c aiming to maintain the left ventricular ejection volume, which is also known to
reflect the Frank-Starling mechanism.30,31This, in fact,
could signify a conditioning of the resting coronary flow by an adaptive increase in regional circumferential wall motion in individuals with increasing body weight. Conversely, in the more recently reported multi-ethnic study of atherosclerosis (MESA) trial, conducted in 74
asymptomatic cardiovascular risk individuals,16and also
in the 12 CON of this study, resting regional MBF and corresponding circumferential strain did not closely accompany each other. Thus, it appears that with increases in left ventricular pre-load due to relative elevations in arterial blood pressures, as observed in individuals with increasing body weight, an adaptive increase in regional circumferential wall motion ensues associated with a commensurate change in resting MBF.
Coronary Vasodilator Capacity and Circumferential Strain
As regards, global hyperemic MBFs and MFR were observed to be non-significantly lower in OW when compared to CON, while declining significantly in OB.
This accords with previous reports,17,18,29 emphasizing
some adverse effects of increasing body weight on the coronary vasodilator capacity. In the aforementioned
MESA trial,16myocardial flow and myocardial
circum-ferential strain were assessed with cardiac MRI and evaluated in asymptomatic individuals but with various traditional cardiovascular risk factors such as arterial hypertension, hypercholesterolemia, smoking, and dia-betes mellitus. It was observed that the coronary vasodilator capacity correlated inversely with
myocar-dial circumferential strain.16Accordingly, in the MESA
trial diminished hyperemic flows were paralleled by reduced resting circumferential strain in cardiovascular
risk individuals.16 Therefore, not only the regional
circumferential strain was altered by classical cardio-vascular risk factors in asymptomatic and relatively old individuals with a mean age of 65 years. The underlying mechanisms remain uncertain but one possibility is that classical cardiovascular risk factors have led, at least in part, to increases of reactive oxygen species and micro-inflammation in the arterial wall with reductions in the bioavailability of endothelium-derived nitric oxide as a common final pathway underlying coronary vasodilator dysfunction and, possibly, also leading to regional
myocardial dysfunction.32,33 With this study, however,
we extend the observation of an association between regional coronary vasodilator capacity and correspond-ing restcorrespond-ing myocardial circumferential strain to healthy individuals with increasing body weight but without traditional cardiovascular risk factors. This may argue in favor of yet unknown physiological mechanisms or interactions between regional coronary vasodilator capacity and resting circumferential strain. Under phys-iologic circumstances, cardiac function determines myocardial oxygen consumption and consequently
cor-onary perfusion.6,14 On the other hand, there is also
experimental evidence that an increase in coronary perfusion is related to an elevation in oxygen consump-tion and contractile funcconsump-tion, the so called Gregg
phenomenon.34 This phenomenon is likely secondary
to enhanced diastolic distension due to filling of the coronary microcirculation, also named ‘‘garden house effect,’’ which may support our observations. Someone could also argue that, within the complexity of
myocar-dial perfusion-contraction matching,14,35 an increase in
regional circumferential strain at rest is also a reflection of increase in the demand for hyperemic MBFs or MFR, respectively, to maintain an appropriate metabolic and oxygen supply. The described relationship between regional coronary vasodilator capacity and correspond-ing restcorrespond-ing circumferential strain, however, may also put forth a conditioning of the coronary vasodilator capacity by resting regional myocardial circumferential strain. While such a novel concept may be intuitively correct, it awaits further confirmation by well-elaborated experi-mental and clinical investigations.
LIMITATIONS
There are some limitations worthy of consideration in interpreting these data. First, diffuse CAD and/or focal structural alterations of the arterial wall could have mildly
affected hyperemic MBFs.24,36As normal stress and rest
myocardial perfusion images with 13N-ammonia and
PET/CT was an inclusion criterion for study participants, effects of flow-limiting epicardial lesions can be widely
ruled out.1In addition, because study participants were
asymptomatic, the performance of non-invasive MDCT
coronary angiography37 to visualize coronary
morphol-ogy and structure did not seem to be justified. For this reason, some subclinical structural CAD with mild down-stream effects on coronary flows may have been missed in
this study population.24,36,38Second, it may be seen as a
limitation that, apart from the left ventricular circumfer-ential strain at rest, we did not measure peak longitudinal strain with tagging MRI due to time constraints, which might have been more sensitive in the identification of subtle abnormalities of regional LV contractile
func-tion.20,39 Although, measures of circumferential strain
with cardiac MRI are of high precision due to numerous
tags around the perimeter of the heart,26which yields a
high sensitivity in the identification of subtle regional
myocardial motion abnormalities,40 information on the
reproducibility of strain measurements is still lacking. Also, the assessment of regional circumferential strain with cardiac MRI during dobutamine stimulation would have been a better approach to depict a possible perfu-sion-contraction mismatch in OB individuals during
times demand-induced flow supply,41,42 which should
be evaluated in future studies. Finally, in view of the relatively low number of study participants, current findings may rather be seen as exploratory, while they are likely to stimulate further clinical investigations in this developing research field.
CONCLUSIONS
Higher coronary vasodilator capacity is related to corresponding regional circumferential strain at rest in non-obese individuals, while this is also observed for reduced hyperemic flows and MFR in obesity.
Conflict of interest
No potential conflict of interest exists.
References
1. Schindler TH, Schelbert HR, Quercioli A, Dilsizian V. Cardiac PET imaging for the detection and monitoring of coronary artery disease and microvascular health. JACC Cardiovasc Imaging 2010;3:623-40.
2. Lerman A, Zeiher AM. Endothelial function: Cardiac events. Circulation 2005;111:363-8.
3. Schindler TH, Nitzsche EU, Schelbert HR, Olschewski M, Sayre J, Mix M, et al. Positron emission tomography-measured abnormal responses of myocardial blood flow to sympathetic stimulation are associated with the risk of developing cardiovascular events. J Am Coll Cardiol 2005;45:1505-12.
4. Ziadi MC, Dekemp RA, Williams KA, Guo A, Chow BJ, Renaud JM, et al. Impaired myocardial flow reserve on rubidium-82 pos-itron emission tomography imaging predicts adverse outcomes in patients assessed for myocardial ischemia. J Am Coll Cardiol 2011;58:740-8.
5. Herzog BA, Husmann L, Valenta I, Gaemperli O, Siegrist PT, Tay FM, et al. Long-term prognostic value of 13N-ammonia myocar-dial perfusion positron emission tomography added value of coronary flow reserve. J Am Coll Cardiol 2009;54:150-6. 6. Schindler TH, Zhang XL, Mhiri L, Lerch R, Schelbert HR. Role of
PET in the evaluation and understanding of coronary physiology. J Nucl Cardiol 2007;14:589-603.
7. Munzel T, Gori T, Bruno RM, Taddei S. Is oxidative stress a therapeutic target in cardiovascular disease? Eur Heart J 2010;31:2741-8.
8. Schindler TH, Nitzsche EU, Olschewski M, Magosaki N, Mix M, Prior JO, et al. Chronic inflammation and impaired coronary vasoreactivity in patients with coronary risk factors. Circulation 2004;110:1069-75.
9. Vaccarino V, Khan D, Votaw J, Faber T, Veledar E, Jones DP, et al. Inflammation is related to coronary flow reserve detected by positron emission tomography in asymptomatic male twins. J Am Coll Cardiol 2010;57:1271-9.
10. Czernin J, Barnard RJ, Sun KT, Krivokapich J, Nitzsche E, Dorsey D, et al. Effect of short-term cardiovascular conditioning and low-fat diet on myocardial blood flow and flow reserve. Circulation 1995;92:197-204.
11. Krivokapich J, Czernin J, Schelbert HR. Dobutamine positron emission tomography: Absolute quantitation of rest and dobuta-mine myocardial blood flow and correlation with cardiac work and percent diameter stenosis in patients with and without coronary artery disease. J Am Coll Cardiol 1996;28:565-72.
12. Chareonthaitawee P, Kaufmann PA, Rimoldi O, Camici PG. Heterogeneity of resting and hyperemic myocardial blood flow in healthy humans. Cardiovasc Res 2001;50:151-61.
13. Schelbert HR. Anatomy and physiology of coronary blood flow. J Nucl Cardiol 2010;17:545-54.
14. Heusch G, Schulz R. Perfusion-contraction match and mismatch. Basic Res Cardiol 2001;96:1-10.
15. Garot J, Bluemke DA, Osman NF, Rochitte CE, McVeigh ER, Zerhouni EA, et al. Fast determination of regional myocardial strain fields from tagged cardiac images using harmonic phase MRI. Circulation 2000;101:981-8.
16. Rosen BD, Lima JA, Nasir K, Edvardsen T, Folsom AR, Lai S, et al. Lower myocardial perfusion reserve is associated with decreased regional left ventricular function in asymptomatic par-ticipants of the multi-ethnic study of atherosclerosis. Circulation 2006;114:289-97.
17. Schindler TH, Cardenas J, Prior JO, Facta AD, Kreissl MC, Zhang XL, et al. Relationship between increasing body weight, insulin resistance, inflammation, adipocytokine leptin, and coronary cir-culatory function. J Am Coll Cardiol 2006;47:1188-95. 18. Quercioli A, Pataky Z, Vincenti G, Makoundou V, Di Marzo V,
Montecucco F, et al. Elevated endocannabinoid plasma levels are associated with coronary circulatory dysfunction in obesity. Eur Heart J 2011;32:1369-78.
19. Al Suwaidi J, Higano ST, Holmes DR Jr, Lennon R, Lerman A. Obesity is independently associated with coronary endothelial dysfunction in patients with normal or mildly diseased coronary arteries. J Am Coll Cardiol 2001;37:1523-8.
20. Vinereanu D, Madler CF, Gherghinescu C, Ciobanu AO, Fraser AG. Cumulative impact of cardiovascular risk factors on regional left ventricular function and reserve: Progressive long-axis dys-function with compensatory radial changes. Echocardiography 2011;28:813-20.
21. Hermans MP, Levy JC, Morris RJ, Turner RC. Comparison of insulin sensitivity tests across a range of glucose tolerance from normal to diabetes. Diabetologia 1999;42:678-87.
22. Zwanenburg JJ, Kuijer JP, Marcus JT, Heethaar RM. Steady-state free precession with myocardial tagging: CSPAMM in a single breathhold. Magn Reson Med 2003;49:722-30.
23. Chan SY, Brunken RC, Czernin J, Porenta G, Kuhle W, Krivo-kapich J, et al. Comparison of maximal myocardial blood flow during adenosine infusion with that of intravenous dipyridamole in normal men. J Am Coll Cardiol 1992;20:979-85.
24. Valenta I, Quercioli A, Vincenti G, Nkoulou R, Dewarrat S, Rager O, et al. Structural epicardial disease and microvascular function are determinants of an abnormal longitudinal myocardial blood flow difference in cardiovascular risk individuals as determined with PET/CT. J Nucl Cardiol 2010;17:1023-33.
25. DeGrado TR, Hanson MW, Turkington TG, Delong DM, Bre-zinski DA, Vallee JP, et al. Estimation of myocardial blood flow for longitudinal studies with 13N-labeled ammonia and positron emission tomography. J Nucl Cardiol 1996;3:494-507.
26. Gotte MJ, Germans T, Russel IK, Zwanenburg JJ, Marcus JT, van Rossum AC, et al. Myocardial strain and torsion quantified by cardiovascular magnetic resonance tissue tagging: Studies in normal and impaired left ventricular function. J Am Coll Cardiol 2006;48:2002-11.
27. Jacob JP, Vachier C, Morel JM, Daire JL, Hyacinthe JN, Vallee JP. Extrema temporal chaining: A new method for computing the 2D displacement field of the heart from tagged MRI. LNCS 2006;4179:879-908.
28. Cerqueira MD, Weissman NJ, Dilsizian V, Jacobs AK, Kaul S, Laskey WK, et al. Standardized myocardial segmentation and nomenclature for tomographic imaging of the heart: A statement for healthcare professionals from the Cardiac Imaging Committee of the Council on Clinical Cardiology of the American Heart Association. Circulation 2002;105:539-42.
29. Motivala AA, Rose PA, Kim HM, Smith YR, Bartnik C, Brook RD, et al. Cardiovascular risk, obesity, and myocardial blood flow in postmenopausal women. J Nucl Cardiol 2008;15:510-7. 30. Sela G, Landesberg A. The external work-pressure time integral
relationships and the afterload dependence of Frank-Starling mechanism. J Mol Cell Cardiol 2009;47:544-51.
31. Chantler PD, Melenovsky V, Schulman SP, Gerstenblith G, Becker LC, Ferrucci L, et al. Use of the Frank-Starling mechanism during exercise is linked to exercise-induced changes in arterial load. Am J Physiol Heart Circ Physiol 2011;302:H349-58. 32. Cai H, Harrison DG. Endothelial dysfunction in cardiovascular
diseases: The role of oxidant stress. Circ Res 2000;87:840-4. 33. Matsubara T, Dhalla NS. Relationship between mechanical
dys-function and depression of sarcolemmal Ca(2?)-pump activity in hearts perfused with oxygen free radicals. Mol Cell Biochem 1996;160-161:179-85.
34. Iwamoto T, Bai XJ, Downey HF. Coronary perfusion related changes in myocardial contractile force and systolic ventricular stiffness. Cardiovasc Res 1994;28:1331-6.
35. Deussen A, Brand M, Pexa A, Weichsel J. Metabolic coronary flow regulation—current concepts. Basic Res Cardiol 2006;101: 453-64.
36. Gould KL. Assessing progression or regression of CAD: The role of perfusion imaging. J Nucl Cardiol 2005;12:625-38.
37. Schoenhagen P, Hachamovitch R, Achenbach S. Coronary CT angiography and comparative effectiveness research prognostic value of atherosclerotic disease burden in appropriately indicated clinical examinations. JACC Cardiovasc Imaging 2011;4:492-5. 38. Naya M, Murthy VL, Blankstein R, Sitek A, Hainer J, Foster C,
et al. Quantitative relationship between the extent and morphology of coronary atherosclerotic plaque and downstream myocardial perfusion. J Am Coll Cardiol 2011;58:1807-16.
39. Carluccio E, Biagioli P, Alunni G, Murrone A, Leonelli V, Pant-ano P, et al. Advantages of deformation indices over systolic velocities in assessment of longitudinal systolic function in patients with heart failure and normal ejection fraction. Eur J Heart Fail 2011;13:292-302.
40. Moore CC, McVeigh ER, Zerhouni EA. Quantitative tagged magnetic resonance imaging of the normal human left ventricle. Top Magn Reson Imaging 2000;11:359-71.
41. Kramer CM, Malkowski MJ, Mankad S, Theobald TM, Pakstis DL, Rogers WJ Jr. Magnetic resonance tagging and echocardio-graphic response to dobutamine and functional improvement after reperfused myocardial infarction. Am Heart J 2002;143:1046-51. 42. Korosoglou G, Lossnitzer D, Schellberg D, Lewien A, Wochele A, Schaeufele T, et al. Strain-encoded cardiac MRI as an adjunct for dobutamine stress testing: Incremental value to conventional wall motion analysis. Circ Cardiovasc Imaging 2009;2:132-40.