ORIGINAL ARTICLE
Remaining lifetime and absolute 10-year probabilities
of osteoporotic fracture in Swiss men and women
K. Lippuner&H. Johansson&J. A. Kanis&R. RizzoliReceived: 2 July 2008 / Accepted: 3 October 2008 / Published online: 31 October 2008 # International Osteoporosis Foundation and National Osteoporosis Foundation 2008 Abstract
Summary Remaining lifetime and absolute 10-year proba-bilities for osteoporotic fractures were determined by gender, age, and BMD values. Remaining lifetime proba-bility at age 50 years was 20.2% in men and 51.3% in women and increased with advancing age and decreasing BMD. The study validates the elements required to populate a Swiss-specific FRAX® model.
Introduction Switzerland belongs to high-risk countries for osteoporosis. Based on demographic projections, burden will still increase. We assessed remaining lifetime and absolute 10-year probabilities for osteoporotic fractures by gender, age and BMD in order to populate FRAX® algorithm for Switzerland.
Methods Osteoporotic fracture incidence was determined from national epidemiological data for hospitalised frac-tured patients from the Swiss Federal Office of Statistics in 2000 and results of a prospective Swiss cohort with almost 5,000 fractured patients in 2006. Validated BMD-associated fracture risk was used together with national
death incidence and risk tables to determine remaining lifetime and absolute 10-year fracture probabilities for hip and major osteoporotic (hip, spine, distal radius, proximal humerus) fractures.
Results Major osteoporotic fractures incidence was 773 and 2,078 per 100,000 men and women aged 50 and older. Corresponding remaining lifetime probabilities at age 50 were 20.2% and 51.3%. Hospitalisation for clinical spine, distal radius, and proximal humerus fractures reached 25%, 30% and 50%, respectively. Absolute 10-year probability of osteoporotic fracture increased with advancing age and decreasing BMD and was higher in women than in men. Conclusion This study validates the elements required to populate a Swiss-specific FRAX® model, a country at highest risk for osteoporotic fractures.
Keywords Absolute 10-year fracture probability . FRAX® . Hospitalisation rate . Incidence . Osteoporotic fractures . Remaining lifetime probability
Introduction
The World Health Organization (WHO) defined osteoporo-sis as “a systemic skeletal disease characterised by low bone mass and microarchitectural deterioration of bone tissue, with a consequent increase in bone fragility and susceptibility to fracture” [1]. The most frequent complica-tions of the disease are the“typical” osteoporotic fractures occurring at the hip, spine, distal forearm and proximal humerus. Furthermore, the WHO proposed an operational definition of osteoporosis as a bone mineral density (BMD) that lies 2.5 standard deviations or more below the average mean value of young healthy women (T score≤−2.5 SD) [1, 2]. Until recently and based on the latter definition,
DO00779; No of Pages K. Lippuner (*)
Osteoporosis Policlinic, Inselspital,
Bern University Hospital and University of Bern, 3010 Bern, Switzerland
e-mail: kurt.lippuner@insel.ch H. Johansson
:
J. A. KanisWHO Collaborating Centre for Metabolic Bone Diseases, University of Sheffield Medical School,
Sheffield, UK R. Rizzoli
Division of Bone Diseases, WHO Collaborating Centre for Osteoporosis Prevention, Department of Rehabilitation and Geriatrics, Geneva University Hospitals and Faculty of Medicine, Geneva, Switzerland
fracture risk was commonly expressed as the relative risk of sustaining an osteoporotic fracture compared to the gender-matched risk of the general population [3]. In the presence of osteoporosis, the relative risk of osteoporotic fracture at any age was shown to decrease with advancing age, albeit that the absolute risk was continuously increasing, which led to the conclusion that, for clinical use, absolute risks may be preferred to relative risks [3]. Since then, the determination of 10-year probability of fracture has increasingly gained acceptance [4–11]. Gender, age, and BMD belong to the strongest predictors of osteoporotic fracture risk, and their combination with other clinical risk factors has been shown to improve the specificity and sensitivity of fracture risk prediction at the individual patient level [12]. Recently, a fracture risk assessment tool (FRAX®) supported by the WHO [13] was developed based on the use of clinical risk factors with or without BMD for several countries, including the UK [4], US [14] and Japan [11].
One of the key requirements for the development of FRAX® is the availability of country specific fracture outcome and mortality data. Although the epidemiology of hospitalised osteoporotic and non-osteoporotic fractures in Switzerland in year 2000 was previously published [15], the absolute 10-year and the remaining lifetime fracture probabilities for an osteoporosis-related fracture are not known.
The aim of the present study was to determine the absolute 10-year and remaining lifetime fracture probabilities by gender, age and BMD categories for the Swiss population for future FRAX® modelling.
Methods
The incidence of hospitalisation for fractures and osteoporotic fractures by gender, age group, and fracture type in year 2000 have been previously published based on the administrative and medical and population structure statistics of the Swiss Federal Office of Statistics (SFOS) [15]. For the present analysis, the incidence by gender and 5-year age groups starting at age 50 were used for the following osteoporosis-related fracture sites: hip (ICD-10 codes S72.0 (fracture of the femoral neck), S72.1 (pertrochanteric fracture) and S72.2 (subtrochanteric fracture)); spine (S22.0 (fracture of the thoracic spine), S22.1 (multiple fractures of the thoracic spine), S32.0 (fracture of the lumbar spine), S32.7 (multiple fractures of the lumbar spine) and S32.8 (other fractures of the lumbar spine)); distal radius (S52.5 (fracture of the distal radius) and S52.6 (combined fracture of the distal radius/ ulna)); and proximal humerus (S42.2, fracture of the proximal humerus). These previously published data represented only hospitalised clinical fractures.
In order to determine the total number of fractures (hospitalised and non-hospitalised) at these osteoporosis-related sites, additional data from the Swiss OsteoCare survey were used [16]. Briefly, the OsteoCare nationwide survey aimed at assessing the quality level of osteoporosis management in patients aged 50 years or older presenting with a clinical fracture at the emergency ward of the participating hospitals in Switzerland. In total, 4,966 consecutive men (N=1,368, mean age 69.0 years) and women (N=3,598, mean age 73.9 years) with any clinical fracture were recruited in eight centres between 2004 and 2006 during a mean duration of observation of 12.2 months. For each patient, a predefined standardised questionnaire was used in all centres to characterise the current acute clinical fracture event. Of all hospitalised and non-hospitalised fractures reported, those categorised as hip (pertrochanteric and femoral neck), spine (lumbar or thoracic), distal forearm and proximal humerus fractures were used for the present analysis. Two hundred ninety-five and 881 hip fractures were reported in the survey for men and women, respectively. On the other hand, 2,506 and 8,074 hip fractures were reported as hospitalised in the medical database of the SFOS. Therefore, the ratio between the number of hip fractures in the OsteoCare cohort and the number of hospitalised fractures published earlier was 8.49 (2,506/295) in men and 9.16 (8,074/881) in women. Assuming that all hip fractures of the OsteoCare cohort were hospitalised, this ratio was applied as a gender-specific multiplier to the number of spine, distal radius and proximal humerus fractures by 5-year age groups in the OsteoCare cohort to determine the expected total (hospitalised and non-hospitalised) number of fractures and their corresponding incidence by gender and 5-year age group, i.e. the expected number of fractures which would have occurred at each predefined site if all fractures (hospitalised and non-hospitalised) had been registered in the previously published cohort. Furthermore, the ratio between the number of hospitalised spine, distal radius and proximal humerus fractures reported by the SFOS and the expected number of these fractures resulting from extrapolation of the OsteoCare cohort were used to quantify the fracture-site-specific hospitalisation rate by gender and 5-year age group.
Thereafter, the remaining lifetime and absolute 10-year probabilities for osteoporosis-related clinical fractures were calculated by gender and 5-year age groups by applying the death risk and incidence tables for Switzerland in 1999 published by the WHO [17]. Finally, BMD and fracture risk categories, expressed in 0.5 T-score steps at the femoral neck, taken from a previously published analysis of ten population-based cohorts [7], were applied to the absolute 10-year and residual lifetime probability tables. For the following tables, the T scores shown represent the BMD value at the
beginning of the measurement period, derived from the NHANES III data for Caucasian women aged 20–29 years for BMD at the femoral neck [18], including men and as widely recommended [19].
The calculation flow and the datasets successively used to determine the residual lifetime and 10-year probabilities of osteoporosis-related fractures in Switzerland are shown in Fig.1. For this analysis, it was assumed that (1) all hip fractures were hospitalized, which is consistent with the findings in the Swiss OsteoCare cohort [16]; (2) as all hip fractures were hospitalised, the same ratio could be used across age groups for extrapolating the cohort results to determine the total number of expected osteoporosis-related fractures as long as it remained gender specific; (3) the hospitalisation rate for fractures reported in OsteoCare [16] is the same as for the fractures reported by the SFOS [15]; (4) the BMD distribution is similar to that of US NHANES
III cohort [7,18]; and (5) the BMD gradient of risk is the same as reported in the population-based cohorts used for the FRAX® algorithm [7].
All calculations were made by gender, osteoporosis-related clinical fracture type and 5-year age groups.
Results
In Switzerland, in year 2000, the selected osteoporosis-related fracture sites (hip, spine, distal radius and proximal humerus) represented 63.1% (4,085/6,470) and 75.5% (13,616/18,037) of all hospitalised clinical osteoporotic fractures in men and women aged 50 years or older, respectively. The corresponding fractures in the OsteoCare cohort represented 63.4% (868/1,368) and 71.3% (2,567/3,598) of all registered fractures in men and women, respectively.
Medical database of the Swiss Federal Office of Statistics
Hospitalized fractures
Swiss OsteoCare cohort
Hospitalized and non-hospitalized fractures Number of fractures: Spine (S22.0, S22.1, S32.0, S32.7, S32.8) Distal radius (S52.5, S52.6) Proximal humerus (S42.2) Number of fractures: Hip (S72.0, S72.1, S72.2) Number of fractures: Spine (thoracic, lumbar) Distal radius Proximal humerus Number of fractures: Hip (neck, trochanter) Men: N=2506 Women: N=8074 Men: N=295 Women: N=881
Gender-specific extrapolation ratio Men: 8.49
Women: 9.16
Expected total number of fractures (hospitalized and non-hospitalized)
by 5 year age group and gender
Incidence of all osteoporosis-related fractures
by 5-year age groups and gender Hospitalization rates
Absolute 10-year and remaining lifetime probabilities of
osteoporosis-related fractures by gender, 5-year age group and 0.5 SD T-score
categories WHO death risk and incidence
tables for Switzerland
BMD associated fracture risk based on 10 population-based
cohorts* and NHANES III**
* Validated by the Swiss SEMOF cohort ** Validated by the reference cohort from Bern Fig. 1 Analysis flowchart. See
Calculated incidence of all (hospitalised
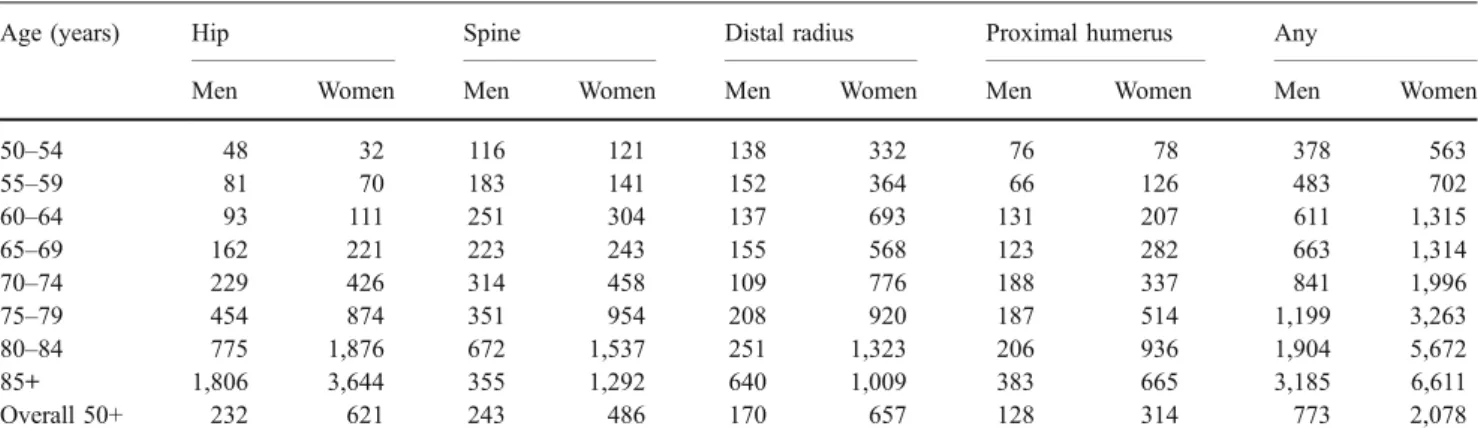
and non-hospitalised) osteoporosis-related fractures The total number of hospitalised and non-hospitalised osteoporosis-related clinical fractures occurring during 1 year in Switzerland was 8,347 in men and 27,005 in women corresponding to incidences of 773 and 2,078 per 100,000 persons aged 50 years and older, respectively. In total, hip fractures represented 30.0% (N=2,506) and 29.9% (N=8,074) of these fractures in men and women, respectively. Clinical spine, proximal humerus and distal radius fractures represented 31.4% (N=2,622), 16.6% (N= 1,384) and 22.0% (N=1,835) of these fractures in men and 23.4% (N=6,313), 15.1% (N=4,085) and 31.6% (8,533) in women, respectively. The detailed incidence rates corresponding to the year 2000 structure of the resident population in Switzerland by age group, gender and fracture site are shown in Table1.
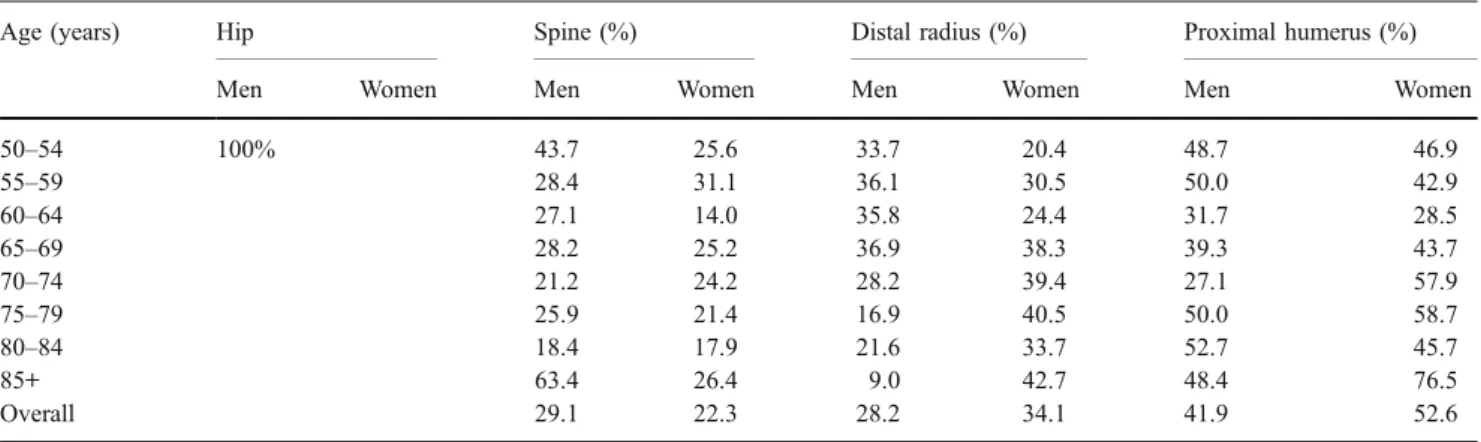
Hospitalisation rates
Except for hip fractures, where the hospitalisation rate was assumed to be 100%, fractures of the proximal humerus were hospitalised in almost 50% of men and more than 50% of women. Approximately one third of all distal radius fractures and one fourth of all clinical spine fractures were hospitalised in both men and women. The hospitalisation rates were generally higher in the younger (50–59 years) and older (85+) age segments as shown in Table2.
Remaining lifetime probability
Overall, the remaining lifetime probability for any osteo-porosis-related fracture in Switzerland was 20.2% and 51.3% for a 50-year old man and woman, respectively (Table 3). Remaining lifetime probability of any major
osteoporosis-related fracture increased with advancing age and with decreasing BMD T-score values at the femoral neck and was always higher in women than in men (Table4). However, lower T-score values increased remain-ing lifetime probability far more than increasremain-ing age. For example, in a 50 year-old woman, decreasing femoral neck T-score values from + 1.0 to −4.0 SD with the normative database of NHANES III were accompanied by an increase in remaining lifetime probability for hip fracture from 5.2% to 70.2% (+65% absolute increase). In comparison, an increase from age 50 to age 85+ years, at a given T score of −2.5 SD, was accompanied by an increase from 45.1% to 48.4% (+3.3% absolute increase) in remaining lifetime probability for hip fracture in women. Similar observations apply to men and to the remaining lifetime probability for any osteoporotic fracture.
Absolute 10-year probability of osteoporotic fracture At any age, the absolute 10-year probability for hip fracture or any osteoporotic fracture increased with advancing age and was higher in women than in men as shown in Table3. In men, the 10-year fracture probability for hip fracture and any osteoporotic fracture increased from 0.6% at age 50 to 7.4% at age 85+ and from 4.1% at age 50 to 12.7% at age 85+, respectively. In women, the corresponding increases were from 0.5% to 20.4% and from 6.1% to 33.0%, respectively (Table 3). The addition of the third parameter, femoral neck T-score, allowed for a refined risk categorisation and for the identification of individual absolute 10-year fracture probabilities up to 45.1% for hip fracture and 66.9% for any osteoporotic fracture in women, with corresponding risk levels up to 26.9% and 38.7% in men (Figs.2and3). As already observed for the remaining lifetime probability of fracture, the increase in 10-year fracture probability was steeper with decreasing BMD than with increasing age in both genders, albeit less pronounced. In men, 10-year lifetime risk
Table 1 Overall (hospitalised and non-hospitalised) incidence of osteoporosis-related fractures (per 100,000) by age groups
Age (years) Hip Spine Distal radius Proximal humerus Any
Men Women Men Women Men Women Men Women Men Women
50–54 48 32 116 121 138 332 76 78 378 563 55–59 81 70 183 141 152 364 66 126 483 702 60–64 93 111 251 304 137 693 131 207 611 1,315 65–69 162 221 223 243 155 568 123 282 663 1,314 70–74 229 426 314 458 109 776 188 337 841 1,996 75–79 454 874 351 954 208 920 187 514 1,199 3,263 80–84 775 1,876 672 1,537 251 1,323 206 936 1,904 5,672 85+ 1,806 3,644 355 1,292 640 1,009 383 665 3,185 6,611 Overall 50+ 232 621 243 486 170 657 128 314 773 2,078
progression with age flattened or decreased for the older age group as a result of increasing competition of other causes of death.
Discussion
The present analysis reports the incidence, the remaining lifetime probability and the 10-year absolute probability of suffering from one of the major osteoporotic fractures in men and women living in Switzerland.
The reported incidences of any (hospitalised or non-hospitalised) major osteoporotic fracture (hip, spine, distal radius and proximal humerus) are higher than previously thought [20,21]. With regard to hip fractures alone, Sweden and the USA (Caucasians) are typically considered as very high risk; UK and Italy are considered as high-risk countries [20]. As shown in Fig.4 and depending on the age group considered, the incidence of the major osteoporotic fractures in Switzerland was similar to that of the very high-risk countries or at least at the high end of the high-risk countries [21]. In the present study, the global incidence of the selected osteoporosis-related fractures was calculated by deriving the percentage of hospitalised fractures from a Swiss cohort of
4,966 consecutive patients, aged 50 years or older, who presented with a clinical fracture at the emergency ward, seeking medical care. The hospitalisation rates of the non-hip fractures were derived by assuming that hip fractures were always hospitalised, i.e. that they would allow for a correction of the cohort size by applying a gender-specific correction factor to the previously published data of hospitalised fractures. The calculated hospitalisation rates for the major osteoporotic fractures (Table2) are lower than the overall hospitalisation rate after fracture in the OsteoCare cohort, in which 80.2% of the patients were hospitalised [16]. However, this percentage most certainly reflects a selection bias due to the fact that the survey was limited to patients seeking medical care at a hospital emergency ward. Therefore, and for the first time, by combining fracture hospitalisation data and clinical fracture incidence data, the present analysis provides an estimate of the proportion of patients treated as out-patients after a clinical spine, distal radius and proximal humerus fracture and leads to fracture incidences comparable or higher than those reported for Sweden [22,23]. Furthermore, approximately one third of all osteoporotic fractures occurring in men and one fourth of those in women were not considered in the present analysis, which leads to an underestimation of fracture risk. On the
Table 3 Overall remaining lifetime probability (percent) for an related fracture at age 50 years and absolute 10-year osteoporosis-related fracture probability (percent) at ages shown
Fracture site Gender Remaining lifetime probability at age 50 (%) 10 year probability of fracture at age x (%)
50 55 60 65 70 75 80 85
Hip Men 7.0 0.6 0.8 1.2 1.7 2.6 4.0 5.7 7.4
Women 22.6 0.5 0.9 1.6 3.0 5.6 10.6 16.8 20.4
Any Men 20.2 4.1 5.1 5.7 6.3 7.7 9.8 12.0 12.7
Women 51.3 6.1 9.3 11.9 14.3 20.7 30.1 35.0 33.0
Based on Swiss fracture data from the SFOS [15], the Swiss OsteoCare cohort [16] and death risk and incidence tables for Switzerland published by the WHO [17]
Table 2 Hospitalisation rates of osteoporosis-related fractures
Age (years) Hip Spine (%) Distal radius (%) Proximal humerus (%)
Men Women Men Women Men Women Men Women
50–54 100% 43.7 25.6 33.7 20.4 48.7 46.9 55–59 28.4 31.1 36.1 30.5 50.0 42.9 60–64 27.1 14.0 35.8 24.4 31.7 28.5 65–69 28.2 25.2 36.9 38.3 39.3 43.7 70–74 21.2 24.2 28.2 39.4 27.1 57.9 75–79 25.9 21.4 16.9 40.5 50.0 58.7 80–84 18.4 17.9 21.6 33.7 52.7 45.7 85+ 63.4 26.4 9.0 42.7 48.4 76.5 Overall 29.1 22.3 28.2 34.1 41.9 52.6
Table 4 Remaining lifetime probability for an osteoporosis-related fracture (percent) by gender, age and femoral neckT score Femoral neck T score Probability of hip fracture from x to death (%)
50 55 60 65 70 75 80 85 Hip fracture Men −4.0 51.5 51.0 49.9 49.8 49.5 51.2 52.6 55.6 −3.5 41.7 41.3 40.5 40.4 40.2 41.7 43.1 45.8 −3.0 32.6 32.3 31.7 31.6 31.5 32.8 34.0 36.3 −2.5 24.7 24.4 23.9 23.9 23.9 24.9 25.9 27.7 −2.0 18.1 18.0 17.6 17.6 17.6 18.4 19.1 20.5 −1.5 13.0 12.9 12.6 12.6 12.7 13.2 13.8 14.8 −1.0 9.2 9.1 8.9 8.9 8.9 9.3 9.7 10.5 −0.5 6.4 6.3 6.2 6.2 6.2 6.5 6.8 7.3 0.0 4.4 4.4 4.3 4.3 4.3 4.5 4.7 5.0 0.5 3.0 3.0 2.9 2.9 2.9 3.1 3.2 3.4 1.0 2.0 2.0 2.0 2.0 2.0 2.1 2.2 2.3 Women −4.0 70.2 70.7 71.1 71.9 73.1 74.7 76.6 76.5 −3.5 62.8 63.2 63.7 64.5 65.6 67.2 68.9 68.6 −3.0 54.3 54.7 55.1 55.8 56.8 58.2 59.7 58.9 −2.5 45.1 45.4 45.7 46.4 47.2 48.4 49.5 48.4 −2.0 36.0 36.2 36.5 37.0 37.6 38.5 39.3 38.1 −1.5 27.6 27.8 28.0 28.4 28.9 29.5 30.0 28.9 −1.0 20.5 20.7 20.8 21.1 21.4 21.9 22.3 21.3 −0.5 14.9 15.0 15.1 15.3 15.5 15.9 16.1 15.3 0.0 10.6 10.7 10.7 10.9 11.1 11.3 11.4 10.8 0.5 7.4 7.5 7.5 7.6 7.8 7.9 8.0 7.6 1.0 5.2 5.2 5.2 5.3 5.4 5.5 5.6 5.3
Any osteoporotic fracture Men −4.0 59.1 58.0 56.1 54.9 53.9 54.8 55.7 57.8 −3.5 51.1 50.0 48.2 46.9 45.8 46.5 47.3 48.9 −3.0 43.7 42.5 40.8 39.3 38.3 38.6 39.2 40.2 −2.5 37.0 35.8 34.2 32.6 31.6 31.6 31.9 32.4 −2.0 31.3 30.1 28.6 27.0 25.9 25.6 25.7 25.7 −1.5 26.6 25.5 24.0 22.4 21.3 20.9 20.7 20.3 −1.0 22.9 21.8 20.4 18.8 17.7 17.1 16.8 16.1 −0.5 20.0 18.9 17.6 16.0 15.0 14.3 13.8 12.9 0.0 17.6 16.6 15.3 13.9 12.8 12.1 11.6 10.6 0.5 15.8 14.8 13.6 12.2 11.2 10.4 9.9 8.8 1.0 14.3 13.4 12.2 10.9 9.9 9.2 8.6 7.5 Women −4.0 79.3 79.1 79.0 78.5 78.9 79.7 80.6 78.8 −3.5 75.1 74.8 74.6 73.9 74.1 74.7 75.2 72.5 −3.0 70.4 70.0 69.7 68.7 68.7 68.9 68.8 65.0 −2.5 65.4 64.9 64.4 63.1 62.9 62.6 61.9 56.9 −2.0 60.3 59.6 59.0 57.5 56.9 56.3 54.9 48.9 −1.5 55.3 54.6 53.9 52.1 51.3 50.3 48.2 41.6 −1.0 50.8 50.0 49.1 47.2 46.2 44.9 42.4 35.3 −0.5 46.7 45.9 45.0 42.9 41.7 40.2 37.4 30.1 0.0 43.2 42.3 41.4 39.2 38.0 36.3 33.3 26.0 0.5 40.1 39.2 38.3 36.1 34.8 33.0 30.0 22.7 1.0 37.5 36.6 35.6 33.4 32.1 30.3 27.2 20.2
Based on Swiss fracture data from the SFOS [15], the Swiss OsteoCare cohort [16], death risk and incidence tables for Switzerland published by the WHO [17], BMD gradients of risk determined in ten international population-based cohorts [7] validated for Switzerland [12] and BMD normative data from US NHANES III [18]
other hand, the cohorts used did not allow for a differenti-ation between first and subsequent fractures. As a prior history of fragility fracture increases the risk for subsequent fractures [12,20,24], this might have led to an overestima-tion of the individual fracture risk based on the three characteristics of gender, age and BMD only.
Switzerland belongs to the countries with the highest life expectancy at birth worldwide (76.7 years for men and 82.5 years for women in 2001) [25] and a stronger increase in the number of nonagenarians and centenarians than in other countries was recently reported, mostly attributable to the decline in mortality after the age of 80 years, which had started already in the 1950s [26]. For this reason, Switzer-land ranks second worldwide after Japan with regard to the number of elderly in the resident population [26]. Further-more, the recent demographic scenarios projecting the
aging of the population in Switzerland between 2005 and 2050 [27] showed that this increasing trend will not level-off before year 2050, leading to almost a doubling of the population older than 65 years of age by that date (Fig.5). Based on current trends and on age distribution alone, Switzerland can therefore be expected to become the European country exposed earliest to the massive impact of the societal and economic consequences of an increasing number of osteoporotic fractures and may be considered as a paradigm for the unfortunate future of most other European countries.
Based on the present results, in Switzerland, one out of five 50-year-old men and one out of two 50-year-old women will suffer from at least one clinical fracture of the hip, the spine, the distal radius and/or the proximal humerus during their remaining lifetime. These figures are consistent
85 80 75 70 65 60 55 50 1 0 -1 -2 -3 -4 0 5 10 15 20 25 30 35 40 Age (years) FN T-s core (SD )
Absolute 10-year probability (%)
Men 85 80 75 70 65 60 55 50 1 0 -1 -2 -3 -4 0 10 20 30 40 50 60 70 Age (years) FN T-s core (SD )
Absolute 10-year probability
(%)
Women
10-year absolute probability of any osteoporotic fracture Fig. 3 Absolute 10-year
proba-bility for a major osteoporotic fracture (hip, clinical spine, dis-tal radius or proximal humerus; percent) by gender, age and femoral neck T score. Based on Swiss fracture data from the SFOS [15], the Swiss OsteoCare cohort [16], death risk and inci-dence tables for Switzerland published by the WHO [17], BMD gradients of risk deter-mined in ten international pop-ulation-based cohorts [7] validated for Switzerland [12] and BMD normative data from US NHANES III [18] 85 80 75 70 65 60 55 50 1.0 0.0 -1.0 -2.0 -3.0 -4.0 0 5 10 15 20 25 30 Age (years) FN T-s core (SD )
Absolute 10-year probability
(%) Men 85 80 75 70 65 60 55 50 1 0 -1 -2 -3 -4 0 5 10 15 20 25 30 35 40 45 50 Age (years) FN T-s core (SD )
Absolute 10-year probability
(%)
Women
10-year absolute probability of hip fracture Fig. 2 Absolute 10-year
proba-bility of hip fracture (percent) by gender, age and femoral neck T score. Based on Swiss fracture data from the SFOS [15], the Swiss OsteoCare cohort [16], death risk and incidence tables for Switzerland published by the WHO [17], BMD gradients of risk determined in ten interna-tional population-based cohorts [7] validated for Switzerland [12] and BMD normative data from US NHANES III [18]
with the estimated long-term risk for any of these osteoporotic fractures in Malmö, Sweden of 23.8% and 47.3% in 45-year-old men and women, respectively [23]. They are also consistent with earlier findings from the population-based Study of Osteoporotic Fractures in the USA, according to which a 50-year-old white woman had a 16% risk of suffering a hip fracture, a 15% risk of suffering a radius fracture and a 32% risk of sustaining a vertebral fracture during her remaining lifetime [28] and with recent results from the Australian Dubbo study, which showed a remaining lifetime probability for any low-trauma non-pathological fracture at age 60 of 25% in men and 44% in women, respectively, after adjustment for competing risk of death [29]. These remaining lifetime probabilities can also be compared to other diseases such as atherosclerotic cardiovascular disease (myocardial infarction, coronary insufficiency, angina, stroke and claudication) with a
lifetime risk at age 50 years of 51.7% for men and 39.2% for women [30]; clinical stroke, lifetime risk at age 65 years of 14.5% for men and 16.1% for women [31]; congestive heart failure, lifetime risk at age 40 years of 21.0% for men and 20.3% for women [32]; and cancer, lifetime risk at birth of being diagnosed with any cancer of 44.9% in men and 37.5% in women [33].
The concept of absolute fracture risk accommodates for the background prevalence of a disease, a clinically relevant dimension, which is lost when using relative risks. In other words, for two distinct diseases with identical relative risks, the absolute risk will be higher for the disease with the highest prevalence. Furthermore, absolute fracture risk reporting is preferred to the traditional T-score reporting by Canadian physicians, non-specialist physicians being particularly supportive of risk-based BMD reporting [34], and is being increasingly adopted in clinical guidelines [35–39] and for the development of new drugs [40]. It is therefore reasonable to assume that an absolute fracture risk, i.e. the probability of sustaining a fracture during a given timeframe, will not only be more appealing to physicians but also more accessible to patients than the abstract T-score value of a DXA measurement. Ten-year absolute fracture probability data by gender, age and femoral neck T-score categories are herewith available for Switzerland. A recently published analysis of nine prospective population-based epidemiological studies from the USA, Europe, Australia and Asia, comprising 46,340 men and women followed for approximately 190,000 person-years in which 4,168 osteoporotic fractures were reported, allowed the identification of the following additional clinical risk factors for fractures: BMI, prior fragility fracture, parental history of hip fracture, current tobacco smoking, ever long-term use of glucocorticoids, rheumatoid arthritis, other causes of secondary osteoporosis and alcohol consumption of three or more units daily [12]. These data, which are generally usable throughout the world combined with the present results and which are specific for 0.0 500.0 1'000.0 1'500.0 2'000.0 2'500.0 2010 2015 2020 2025 2030 2040 2050
All ≥ 65 years old 65 - 79 years old ≥ 80 years old Population in ’ 000 Year
Fig. 5 Demographic projection of the population living in Switzer-land until year 2050 according to the Swiss Federal Office of Statistics [27] 0 500 1000 1500 2000 2500 3000 3500 4000 4500 5000 50-54 55-59 60-64 65-69 70-74 75-79 80-84 85+ Switzerland Sweden US caucasian UK Italy Men
Age categories (years) Age categories (years)
0 1000 2000 3000 4000 5000 6000 7000 8000 50-54 55-59 60-64 65-69 70-74 75-79 80-84 85+ Switzerland Sweden US caucasian UK Italy Women
Incidenceof major osteoporotic fractures (per 100‘000)
Incidenceof major osteoporotic fractures (per 100‘000)
Fig. 4 Comparative incidence of major osteoporotic fractures (hip, spine, distal radius and proximal humerus) in number of fractures per 100,000 inhabitants
Switzerland and other high-risk countries, will allow for the development of a fracture risk assessment tool (FRAX®), as it has already been published for the UK, the US and Japan [4, 11,14] with the aim of identifying those patients in the low BMD range (T-score −1 to −2.5 SD) who have the highest risk of fracture and would potentially benefit from treatment. Even if BMD alone were shown to outperform the clinical risk factors for predicting fracture risk at all ages [12], a significant percentage of the osteoporotic fractures occur in patients who do not meet the WHO T-score threshold of −2.5 SD required by the authorities in many countries for reimbursement of drug therapy aiming at preventing the first or subsequent fracture [16,41]. The present data, and even more so, once interpolated with all identified clinical risk factors for FRAX®, will contribute to improving the predictive value of BMD measurements for fracture risk prediction [12].
One strength of the present analysis is its internal consistency with the use of Swiss national epidemiological data, whenever possible. Several assumptions (see“Methods”) were required to ensure the present validation process of FRAX® for Switzerland. It was assumed that BMD distribu-tion at the femoral neck in Switzerland will be similar to that in the US NHANES III cohort [7,18]. This assumption can be considered as robust. In a representative population of 400 Caucasian women and men, 20–80 years of age living in the area of Berne, the distribution of the BMD values at the femoral neck was compared to that of NHANES III (data not shown). This population had already served as the reference population in clinical trials published earlier [42]. Further-more, it was assumed that the BMD gradient of risk will be the same as reported in the population-based cohorts used for the FRAX® algorithm [7]. For the latter, the Swiss SEMOF cohort [43] was used as a validation cohort [12], which reinforces the validity of the assumption. However, in the present study, the interpolation with the BMD T-score categories relied on the published NHANES III data at the femoral neck only. Whether the same conclusions would apply by using BMD values measured by DXA at other sites, established by using other BMD measurement devices than DXA, such as ultrasound or peripheral QCT, and/or by using a normative database for femoral neck T scores other than NHANES III, cannot be answered by this study.
In conclusion, the present study validated the elements required for the development of a FRAX® model for use in Switzerland. It shows that Switzerland belongs to the high end of the spectrum of risk for osteoporotic fractures and that the burden of disease is comparable to that of cardiovascular diseases and cancer. The future determina-tion of the individual fracture risk based on a more encompassing clinical risk factor profile will aid in identifying those patients who will benefit most from fracture prevention measures.
Acknowledgement We are grateful to Dr Philippe Kress for his contribution to the writing of the manuscript.
Funding None
Conflicts of interest None.
References
1. Consensus Development Conference (1993) Diagnosis, prophylaxis, and treatment of osteoporosis. Am J Med 94:646–650
2. Kanis JA, Melton LJ 3rd, Christiansen C et al (1994) The diagnosis of osteoporosis. J Bone Miner Res 9:1137–1141 3. Kanis JA, Johnell O, Oden A et al (2000) Risk of hip fracture
according to the World Health Organization criteria for osteopenia and osteoporosis. Bone 27:585–590
4. Kanis JA, Johnell O, Oden A et al (2008) FRAX and the assessment of fracture probability in men and women from the UK. Osteoporos Int 19:385–397
5. Abrahamsen B, Vestergaard P, Rud B et al (2006) Ten-year absolute risk of osteoporotic fractures according to BMD T score at menopause: the Danish Osteoporosis Prevention Study. J Bone Miner Res 21:796–800
6. Kanis JA, Johnell O, Oden A et al (2005) Ten-year probabilities of clinical vertebral fractures according to phalangeal quantitative ultrasonography. Osteoporos Int 16:1065–1070
7. Johnell O, Kanis JA, Oden A et al (2005) Predictive value of BMD for hip and other fractures. J Bone Miner Res 20:1185–1194 8. Kanis JA, Johnell O, Oden A et al (2001) Ten year probabilities of osteoporotic fractures according to BMD and diagnostic thresholds. Osteoporos Int 12:989–995
9. Durosier C, Hans D, Krieg MA et al (2008) Defining risk thresholds for a 10-year probability of hip fracture model that combines clinical risk factors and quantitative ultrasound: results using the EPISEM cohort. J Clin Densitom 11:397–403 10. Hans D, Durosier C, Kanis JA et al (2008) Assessment of the
10-year probability of osteoporotic hip fracture combining clinical risk factors and heel bone ultrasound: the EPISEM prospective cohort of 12958 elderly women. J Bone Miner Res 23:1045–1051 11. Fujiwara S, Nakamura T, Orimo H et al (2008) Development and application of a Japanese model of the WHO fracture risk assessment tool (FRAX). Osteoporos Int 19:429–435
12. Kanis JA, Oden A, Johnell O et al (2007) The use of clinical risk factors enhances the performance of BMD in the prediction of hip and osteoporotic fractures in men and women. Osteoporos Int 18:1033–1046
13. Kanis J (2007) World health organization scientific group. assessment of osteoporosis at the primary health care level. Technical report. World Health Organization Collaborating Centre for Metabolic Bone Diseases, University of Sheffield, UK 14. Dawson-Hughes B, Tosteson AN, Melton LJ 3rd et al (2008)
Implications of absolute fracture risk assessment for osteoporosis practice guidelines in the USA. Osteoporos Int 19:449–458 15. Lippuner K, Golder M, Greiner R (2005) Epidemiology and direct
medical costs of osteoporotic fractures in men and women in Switzerland. Osteoporos Int 16(Suppl 2):S8–S17
16. Suhm N, Lamy O, Lippuner K (2008) Management of fragility fractures in Switzerland: results of a nationwide survey. Swiss Med Wkly Oct 14. [Epub ahead of print]
17. United Nations population division (2003). World population prospects: the 2002 revision and world urban prospects.
Popula-tion division of the Dept Economic and Social Affairs of the UN Secretariat.
18. Looker AC, Wahner HW, Dunn WL et al (1998) Updated data on proximal femur bone mineral levels of US adults. Osteoporos Int 8:468–489
19. Kanis JA, Black D, Cooper C et al (2002) A new approach to the development of assessment guidelines for osteoporosis. Osteoporos Int 13:527–536
20. Kanis JA, Burlet N, Cooper C et al (2008) European guidance for the diagnosis and management of osteoporosis in postmenopausal women. Osteoporos Int 19:399–428
21. Kanis JA, Johnell O, De Laet C et al (2002) International variations in hip fracture probabilities: implications for risk assessment. J Bone Miner Res 17:1237–1244
22. Kanis JA, Oden A, Johnell O et al (2001) The burden of osteoporotic fractures: a method for setting intervention thresh-olds. Osteoporos Int 12:417–427
23. Kanis JA, Johnell O, Oden A et al (2000) Long-term risk of osteoporotic fracture in Malmo. Osteoporos Int 11:669–674 24. Lauritzen JB, Schwarz P, McNair P et al (1993) Radial and
humeral fractures as predictors of subsequent hip, radial or humeral fractures in women, and their seasonal variation. Osteoporos Int 3:133–137
25. Mathers CD, Murray CJL, Lopez AD, et al. (2001) World Health Organization Global Programme on Evidence for Health Policy Discussion Paper No. 38 http://www.who.int/healthinfo/paper38. pdf. Last visited May 13, 2006.
26. Robine JM, Paccaud F (2005) Nonagenarians and centenarians in Switzerland, 1860–2001: a demographic analysis. J Epidemiol Community Health 59:31–37
27. Bundesamt für Statistik. Szenarien zur Bevölkerungsentwicklung der Schweiz 2005–2050. http://www.bfs.admin.ch/bfs/portal/de/index/ news/publikationen.Document.83713.pdf. Last visited May 14, 2008 28. Cummings SR, Black DM, Rubin SM (1989) Lifetime risks of hip, Colles’, or vertebral fracture and coronary heart disease among white postmenopausal women. Arch Intern Med 149:2445–2448 29. Nguyen ND, Ahlborg HG, Center JR et al (2007) Residual
lifetime risk of fractures in women and men. J Bone Miner Res 22:781–788
30. Lloyd-Jones DM, Leip EP, Larson MG et al (2006) Prediction of lifetime risk for cardiovascular disease by risk factor burden at 50 years of age. Circulation 113:791–798
31. Carandang R, Seshadri S, Beiser A et al (2006) Trends in incidence, lifetime risk, severity, and 30-day mortality of stroke over the past 50 years. JAMA 296:2939–2946
32. Lloyd-Jones DM, Larson MG, Leip EP et al (2002) Lifetime risk for developing congestive heart failure: the Framingham Heart Study. Circulation 106:3068–3072
33. SEER Cancer Statistics Review, 1975–2004 (NCI 2007). Cancer Facts and Figures 2007, American Cancer Society. http://seer. cancer.gov/csr/1975_2005/results_merged/topic_lifetime_risk.pdf. Last visited May 15, 2008.
34. Leslie WD (2008) Absolute fracture risk reporting in clinical practice: a physician-centered survey. Osteoporos Int 19:459–463 35. Siminoski K, Leslie WD, Frame H et al (2007) Recommendations for bone mineral density reporting in Canada: a shift to absolute fracture risk assessment. J Clin Densitom 10:120–123
36. Nakamura T (2007) Absolute risk for fracture and WHO guideline. Fracture risk assessments recommended by World Health Organization and Japanese guidelines for prevention and treatment of osteoporosis 2006. Clin Calcium 17:1022– 1028
37. Kurth AA, Pfeilschifter J (2007) Diagnosis and treatment of postmenopausal osteoporosis and osteoporosis in men. German Guidelines Update 2006. Orthopade 36:683–690 quiz 691 38. Czerwinski E, Badurski JE, Marcinowska-Suchowierska E et al
(2007) Current understanding of osteoporosis according to the position of the World Health Organization (WHO) and Interna-tional Osteoporosis Foundation. Ortop Traumatol Rehabil 9:337–356
39. Kanis J, McCloskey E, Johansson H et al (2008) National Osteoporosis Guideline Group. Case finding for the management of osteoporosis with FRAX™-Assessment and intervention thresholds for the UK. Osteoporos Int 19:1395–1408
40. Committee for Medicinal Products for Human Use (CHMP). Guideline on the evaluation of medicinal products in the treatment of primary osteoporosis. Ref CPMP/EWP/552/95Rev.2. London, CHMP. Nov 2006
41. Siris ES, Chen YT, Abbott TA et al (2004) Bone mineral density thresholds for pharmacological intervention to prevent fractures. Arch Intern Med 164:1108–1112
42. Ruetsche AG, Kneubuehl R, Birkhaeuser MH et al (2005) Cortical and trabecular bone mineral density in transsexuals after long-term cross-sex hormonal treatment: a cross-sectional study. Osteoporos Int 16:791–798
43. Krieg MA, Cornuz J, Ruffieux C et al (2006) Prediction of hip fracture risk by quantitative ultrasound in more than 7000 Swiss women > or = 70 years of age: comparison of three technolog-ically different bone ultrasound devices in the SEMOF study. J Bone Miner Res 21:1457–1463