*To whom correspondence should be addressed. KLUWER/ESCOM
© 1997 Kluwer Academic Publishers. Printed in The Netherlands.
J-Bio NMR 458
Side-chain conformation and dynamics in a solid peptide:
CP-MAS NMR study of valine rotamers and methyl-group relaxation
in fully
13C-labelled antamanide
Suzana K. Straus, Tobias Bremi and Richard R. Ernst*
Laboratorium für Physikalische Chemie, ETH Zentrum, CH-8092 Zürich, SwitzerlandReceived 4 March 1997 Accepted 10 April 1997
Keywords: Solid-state NMR; Peptide dynamics; Side-chain conformation; Methyl-group relaxation; Homonuclear decoupling; Stereospecific assignment
Summary
The effect of the crystal lattice on the side-chain conformation and side-chain dynamics in peptides is investigated by solid-state NMR, using the cyclic decapeptide antamanide as an example. The study takes advantage of the13C assignment of the backbone and side chains based on the resolution-enhanced
2D spin-diffusion spectra by heteronuclear and homonuclear decoupling. The spectra even allow for a stereospecific assignment of theγ-carbons of the valine residue. It is found that the valine side chain coexists in two static rotamer conformations which have not been observed by X-ray crystallography. In addition, remarkable effects of the crystal packing on the methyl-group rotation frequency are found from13C relaxation measurements.
Introduction
Today X-ray crystallography is the most powerful and most successful technique for the determination of the solid-state structure of biomolecules and of supramol-ecular assemblies. At first glance, it seems unnecessary to contemplate further the possible usage of alternative techniques. However, X-ray crystallography also has its limitations. Firstly, it is dependent on the availability of single crystals of sufficient quality. Especially for mem-brane proteins, single crystals prove to be difficult to obtain, and solution studies are, for solubility reasons, not yet feasible. Moreover, even with high-quality single crystals available, it is impossible to properly assess intra-molecular dynamics by X-ray crystallography. It is be-coming more and more clear that biomolecular interac-tions and activity are significantly influenced by molecu-lar flexibility and it is necessary to develop proper tools for the study of intramolecular dynamic phenomena.
These are the reasons for exploring the possibilities of NMR for the study of structural and dynamical features of biomolecules in the solid state. Biomolecular solid-state
NMR is already a very active field of science (Frey et al., 1985; Opella et al., 1987; Stewart et al., 1988; Griffiths et al., 1995; Lansbury et al., 1995; Lazo and Cross, 1995; Naito et al., 1995; Heller et al., 1996; Hirsh et al., 1996). Many studies use site-selectively isotope-labelled molecules to address specific structural or dynamical questions, thereby avoiding the need for a full assignment of all resonances (Griffiths et al., 1995; Lansbury et al., 1995; Heller et al., 1996; Hirsh et al., 1996). For more compre-hensive NMR investigations, a full assignment of the resonances is indispensable. Because of the limited resol-ution of proton resonances in the solid state, it is necess-ary to base the sequential assignment of peptides and proteins on the connectivity of carbon and nitrogen nuclei in fully13C- and15N-labelled samples. The resulting addi-tional spin–spin interactions among the heteronuclei fur-ther reduce the already limited spectral resolution in the solid state.
Fortunately, significant advances have recently been made in improving the spectral resolution of magic angle spinning (MAS) NMR spectra of fully13
C- and15
N-label-led biomolecules. First, heteronuclear proton decoupling
by the TPPM sequence (Bennett et al., 1995) removes Fig. 1. Pulse sequence to correlate the13C chemical shifts by
proton-driven spin diffusion, with homonuclear decoupling inω1. All pulses
except the shaped one are high-power (ωI/2π =71.4 kHz;ωS/2π =65.8
kHz). The low-power Gaussian pulse is described in the text. Hetero-nuclear proton decoupling is achieved using TPPM. The minimal phase cycle, resulting in artefact-free spectra with subtraction of all out-of-band resonances, isϕ1=x,y, receiver phase=x,−x. Quadrature
detection in t1is achieved by TPPI, incrementingϕ2.
very efficiently the heteronuclear broadening, and, second-ly, it is possible to suppress also the 13
C-13
C interactions by homonuclear decoupling (Straus et al., 1996). These innovations open up possibilities for a full resonance assignment.
The present investigation of a motional process in a prototype peptide takes advantage of the attainability of the full resonance assignment in the solid state and serves as an example for demonstrating the capabilities of mod-ern solid-state NMR. In addition, it puts into evidence the influence of the solid-state environment on the side-chain conformation and the side-side-chain mobility in pep-tides.
For this investigation, we have selected antamanide, a cyclic decapeptide (-Val1
-Pro2 -Pro3 -Ala4 -Phe5 -Phe6 -Pro7 -Pro8 -Phe9 -Phe10
-) that has been studied extensively before by solution NMR (Burgermeister et al., 1974; Müller, 1986; Kessler et al., 1987,1988,1989a,b; Mádi et al., 1990; Brüschweiler et al., 1991,1992; Blackledge et al., 1993; Schmidt et al., 1993; Bremi et al., 1994; Ernst et al., 1996; Schmidt, 1997) and by X-ray crystallography (Karle et al., 1979). The question to be addressed concerns the environmental effects on the side-chain conformation of Val1
and on the methyl-group rotation. For availability reasons, the assignment had to be based on a 13C only labelled sample. It includes the stereospecific assignment of the Val1
methyl groups.
Experimental
13C-labelled (99%) antamanide was synthesized by Prof. S. Aimoto, Institute of Protein Research, Osaka Univer-sity, Japan, based on labelled amino acids supplied by Prof. M. Kainosho, Department of Chemistry, Tokyo Metropolitan University, Japan. To obtain a well-defined regularly crystallized sample,13C antamanide was recrys-tallized from a mixture of methanol/water (7:3). The resulting needle-like crystals (50 mg) were ground into a
uniform powder prior to being inserted into the MAS rotor. It was found that the care in crystallization strong-ly influenced the attainable spectral resolution. Crystal defects, caused by improper crystallization, can lead to an undesired chemical shift inhomogeneity.
The NMR experiments for the 13
C assignment were performed on a Bruker DMX-400 NMR spectrometer equipped with a 4 mm Bruker triple-resonance MAS probe head. The spinning rate was controlled within±2 Hz by a Bruker MAS control unit.
Two-dimensional proton-driven spin-diffusion experi-ments were used for the intraresidue and sequential as-signment and for the detection of long-range contacts. Standard Hartmann–Hahn cross-polarization proved to be efficient at a spinning rate of 15 kHz. During evolution and detection periods, heteronuclear TPPM decoupling (Bennett et al., 1995) was applied with a field strength of 71.4 kHz to efficiently remove the broadening by pro-ton–carbon couplings. In key experiments, requiring opti-mum resolution, homonuclear13C decoupling by a pair of selective and non-selectiveπ pulses (Straus et al., 1996) during the evolution period was used, as indicated in Fig. 1. This scheme allows complete homonuclear decoupling of a selected region in theω1dimension of a 2D13
C spec-trum. The Gaussian pulse shape was generated with the program xShape, which is part of the Bruker XWIN-NMR package, using 256 points with a truncation value of 3%. The Gaussian pulse length was set to 800 µs for all experiments. Its amplitude was calibrated based on its inversion properties in the test experiment cross-polariz-ation-π/2(hard)-π(selective)-π/2(hard), with simultaneous 1
H TPPM decoupling. The protonπ/2 pulse length was 3.5µs (ωI/2π =71.4 kHz) and the carbonπ/2 pulse length was 3.8µs (ωS/2π =65.8 kHz). The length and phase of the pulses for TPPM were optimized for maximum resol-ution. For a spinning speed of 15 kHz, it was found that the optimal pulse length is 6µs and the optimal phases are ±13°. The 2D experiments with homonuclear J de-coupling were performed with a reduced sweep width of 10 kHz inω1and t1,max=22 ms. All spectra were recorded at room temperature.
The13C T
1 relaxation experiments used recrystallized natural abundance antamanide to avoid undesired contri-butions from dipolar13
C-13
C relaxation. The experiments were performed on a Bruker MSL-400 NMR spectrome-ter. A 4 mm Doty MAS probe head was used for the measurements. The spinning rate was set to 6 kHz. The proton π/2 pulse was 3.1µs (ωI/2π =80.6 kHz) and the carbon π/2 pulse was 3.1 µs (ωS/2π =80.6 kHz). After cross-polarization, the carbon magnetization was flipped along the−z axis and then allowed to relax under CW proton decoupling. After this relaxation delay, a carbon π/2 pulse followed, and the 13C spectrum was acquired under proton CW decoupling. A total of 1024 scans were taken and, prior to Fourier transformation, the FIDs
were apodized with a cosine-squared window. Six mixing
a
b
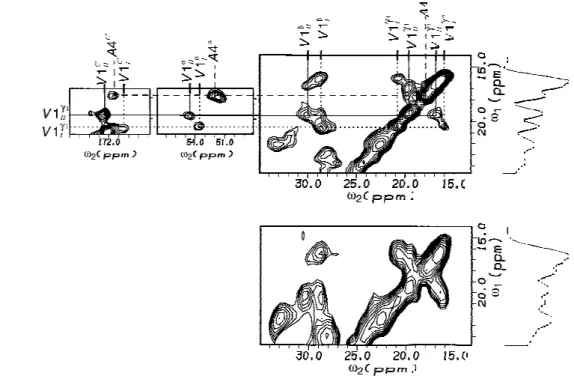
Fig. 2. Two-dimensional13C spectra of fully13C-labelled antamanide, recorded at 100 MHz carbon frequency and room temperature, displaying
the connectivities for the two valine rotamers and for alanine: (a) with homonuclear decoupling inω1; (b) without homonuclear decoupling. The
spectra were acquired with a mixing time of 32 ms and a spinning speed of 15 kHz. The 1D spectra on the right side of the 2D planes are the projections ontoω1. Both spectra, referenced with respect to TMS, are plotted at the same amplitude level, with the contour levels increasing by a factor of 1.2. In (a), 96 transients were added, resulting in a total experiment time of 20 h. In (b), 32 transients were added, resulting in a total experiment time of 14 h.
times were taken (20 µs, 10 ms, 100 ms, 500 ms, 5 s, 10 s). The line widths and peak positions of the longest mixing time were fitted using Lorentzian line shapes and these values were then used for fitting all the spectra adjusting the intensities only.
13
C Resonance assignment
For the assignment of fully isotope-labelled peptides or proteins in the solid state, dipolar correlation spectra (Meier, 1994) or possibly J-correlated spectra (Rama-moorthy et al., 1993; Baldus and Meier, 1996) can be used. For intraresidue assignment, the connectivity be-tween the carbon atoms within one amino acid residue can be established using short mixing times, where pre-dominantly nearest-neighbour transfers occur. Spectra recorded at longer mixing times provide interresidue information, allowing for a sequential assignment.
The resonance assignment is based on fully13C-labelled antamanide. The strategy followed here is analogous to that described by Balaban et al. (1995), with the differ-ence that only13C labelling is used and that the resolution in theω1dimension is enhanced by homonuclear decoup-ling (Straus et al., 1996). Proton-driven spin diffusion is used to correlate the13
C spins.
The large quadrupolar moment of the 14N spins is
known to lead to a13C line splitting of 35–44 Hz at 9.4 T, because of the residual dipolar interaction which is not averaged by MAS (Olivieri et al., 1987). This increases the line width of all the 13
C spins directly bound to14 N. For assigning antamanide this does not pose significant problems, but for bigger proteins15
N labelling and 15 N J decoupling is mandatory.
For the intraresidue assignment, spin-diffusion spectra with short mixing times (e.g. 12 ms) were used. In a sec-ond set of experiments, a slightly longer mixing time of 32 ms was selected, where already multiple-step nearest-neighbour transfers occur which are, however, restricted to intraresidue connectivities. Interresidue cross peaks have still very low intensities under these conditions. This al-lows one to trace out the intraresidue connectivities for the different amino acid residue types in analogy to the J-cor-relation procedures in the liquid phase (Wüthrich, 1986). Figure 2a illustrates the intraresidue assignment for the two valine rotamer conformations ValI
1
and Val1
II(see the section ‘Valine rotamer conformations’). The chemical shift frequencies of the methyl groups Val1
CIγ1 and Val1 CIIγ1
alongω1are connected by cross peaks to all the other carbon resonances of Val1alongω2: C
I γ2 , CI β , CI α , C'I, and similarly for the second conformer. The two families of cross peaks can uniquely be identified in this homonu-clearω1-decoupled spectrum. On the other hand, without ω1 decoupling, as displayed in Fig. 2b, the identification
is no longer possible due to severe overlap of the relevant
a
b
Fig. 3. Two-dimensional13C spectra of fully13C-labelled antamanide,
with long mixing times for interresidue cross peaks (see text): (a) no homonuclear decoupling (τm =150 ms); (b) with homonuclear
decoupling inω1(τm=100 ms). The other parameters are the same as indicated in the caption of Fig. 2. Boxes indicate some of the cross peaks used to establish the sequential connectivities. Some of the cross peaks apparent in (a) are missing in (b). It was found that the observability of certain cross peaks strongly depends on the mixing timeτm, which is different in (a) and (b).
cross peaks. The effect ofω1 decoupling can also be ap-preciated from the projections onto theω1axis, illustrated in Fig. 2. Connectivities for the other amino acids were also identified in a similar manner. Errors in the chemical shift values obtained were estimated by comparing the shifts in spectra recorded at different mixing times. The standard deviations amount to 0.2 ppm for well-separated peaks and can increase up to 0.6 ppm for strong overlap. The sequential assignment of the residues was based on 13C-coupled and 13C-ω1-decoupled proton-driven spin-diffusion spectra with mixing times of 100 and 150 ms. An example of a13
C-coupled spectrum is given in Fig. 3a,
while in Fig. 3b a blow-up of a 13C-ω1-decoupled spec-trum is shown. It is apparent that there is little symmetry with respect to the diagonal. This is attributed to differ-ences in the cross-polarization rates and rotating frame relaxation times (Tuzi et al., 1992) for the different13C’s. This has been verified by varying the cross-polarization time. This deficiency, due to differences in the cross-po-larization efficiency, could be alleviated by using improved cross-polarization procedures, such as AMCP (Hediger et al., 1995), where the transfer rate becomes more uniform. For assigning the four prolines, the known presence of two cis Xyz-Pro (Pro3 and Pro8) and two trans Xyz-Pro peptide bonds (Pro2
and Pro7
) was used (Karle et al., 1979). It is known that the conformation characteristically influences the proline chemical shift differences δCβ− δCγ
with a range of 8–12 ppm for a cis peptide bond and 2–6 ppm for a trans peptide bond (Sarkar et al., 1984).
Based on the intraresidue assignment described above and the knowledge on the proline chemical shifts, residue connectivities were searched for. A set of inter-residue cross peaks sufficient for completing the full se-quential assignment is marked by boxes in Figs. 3a and b. For instance, one can identify a cross peak between Cα of Ala4
and Cα of Phe5
, thus allowing one to distinguish this particular phenylalanine from the other three. Start-ing from Val1
Cα, one can identify a contact to Phe10 Cβ. One can also see a cross peak between a Pheαand a trans-bonded Proδ resonance. Since this is only possible for Phe6
and Pro7
, given the primary structure of antamanide, Phe6
and Pro7
can be assigned. By exclusion the other trans proline must be Pro2and the remaining phenylala-nine connectivity pattern must be Phe9
. The assignment of Pro2
is additionally confirmed by a cross peak to Val1 and that of Phe9
by a cross peak to Phe10
in the decoupled spectrum in Fig. 3b. One can also identify a contact be-tween Phe9
and a proline Cα, which again due to the primary structure must be Pro8
. This allows one to dis-tinguish Pro3from Pro8.
The resulting solid-state assignment is summarized in Table 1. It is consistent with the liquid-state assignment of antamanide in chloroform (Bremi, 1993). The differ-ence between the solid- and liquid-state chemical shifts, given in parentheses in Table 1, can be either due to en-vironmental shifts or, more likely, are caused by the shift of conformational equilibrium due to the crystal packing.
Comparison of NMR data with X-ray structure
To compare the backbone structure determined by X-ray crystallography and that observed by solid-state NMR, the X-ray structure of antamanide was inspected for pos-sible short distances between remote residues within the peptide backbone. The most relevant contacts for deter-mining the conformation of the backbone are those across the peptide ring. In Fig. 4a, the shortest CαCα
cross-annu-lar distances based on the X-ray crystal structure are
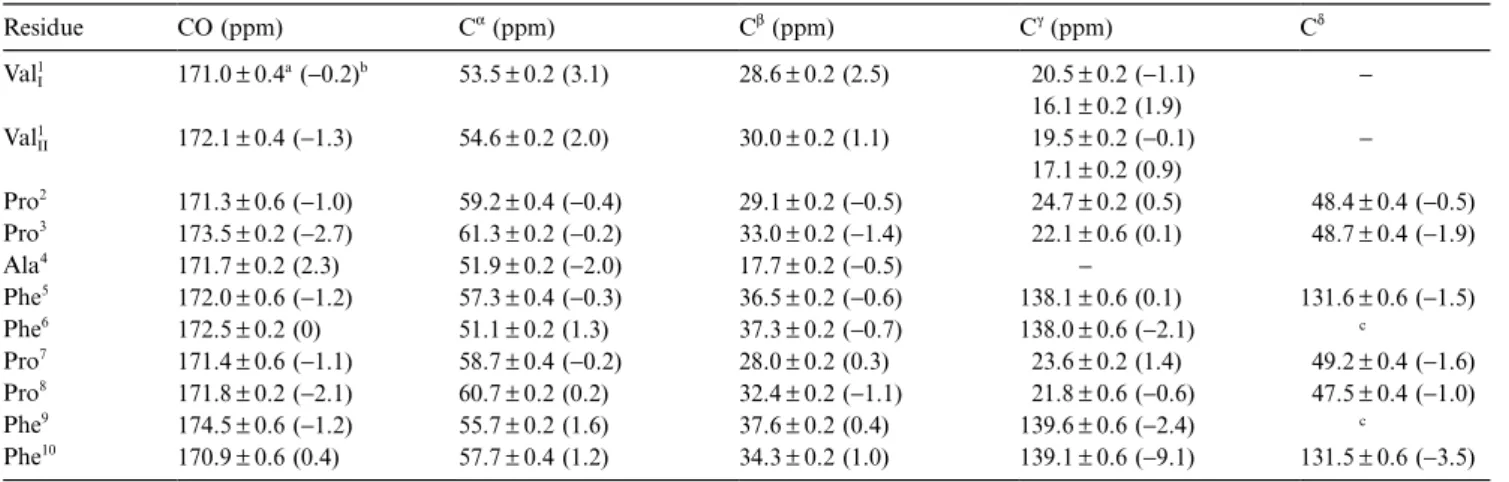
TABLE 1
ASSIGNMENT OF13C RESONANCES IN ANTAMANIDE AT ROOM TEMPERATURE
Residue CO (ppm) Cα(ppm) Cβ(ppm) Cγ(ppm) Cδ ValI 1 171.0±0.4a(−0.2)b 53.5±0.2 (3.1) 28.6±0.2 (2.5) 020.5±0.2 (−1.1) 016.1±0.2 (1.9) − Val1 II 172.1±0.4 (−1.3) 54.6±0.2 (2.0) 30.0±0.2 (1.1) 019.5±0.2 (−0.1) 017.1±0.2 (0.9) − Pro2 171.3±0.6 (−1.0) 59.2±0.4 (−0.4) 29.1±0.2 (−0.5) 024.7±0.2 (0.5) 048.4±0.4 (−0.5) Pro3 173.5±0.2 (−2.7) 61.3±0.2 (−0.2) 33.0±0.2 (−1.4) 022.1±0.6 (0.1) 048.7±0.4 (−1.9) Ala4 171.7±0.2 (2.3) 51.9±0.2 (−2.0) 17.7±0.2 (−0.5) − Phe5 172.0±0.6 (−1.2) 57.3±0.4 (−0.3) 36.5±0.2 (−0.6) 138.1±0.6 (0.1) 131.6±0.6 (−1.5) Phe6 172.5±0.2 (0) 51.1±0.2 (1.3) 37.3±0.2 (−0.7) 138.0±0.6 (−2.1) c Pro7 171.4±0.6 (−1.1) 58.7±0.4 (−0.2) 28.0±0.2 (0.3) 023.6±0.2 (1.4) 049.2±0.4 (−1.6) Pro8 171.8±0.2 (−2.1) 60.7±0.2 (0.2) 32.4±0.2 (−1.1) 021.8±0.6 (−0.6) 047.5±0.4 (−1.0) Phe9 174.5±0.6 (−1.2) 55.7±0.2 (1.6) 37.6±0.2 (0.4) 139.6±0.6 (−2.4) c Phe10 170.9±0.6 (0.4) 57.7±0.4 (1.2) 34.3±0.2 (1.0) 139.1±0.6 (−9.1) 131.5±0.6 (−3.5)
Referenced to external adamantane (δCH2=38.56 ppm andδCH=29.50 ppm with respect to TMS (Earl and VanderHart, 1979)). aSee text.
bValues in parentheses indicate the shift difference between the liquid state and the current assignment (δ (l)− δ(s)). c Not assigned.
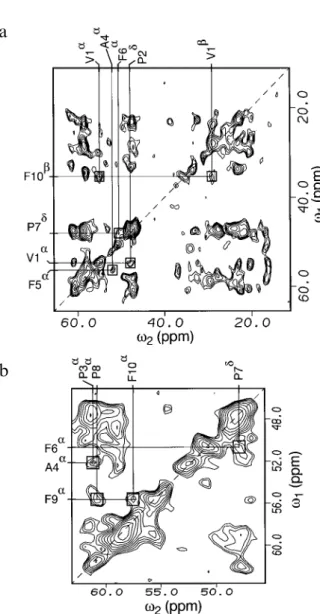
a
b
Fig. 4. Comparison of the NMR data with the X-ray structure. (a) Expected trans-annular CαCαcontacts based on the X-ray structure. Arrows drawn with solid lines represent contacts found in the NMR spectrum in (b). Those with broken lines indicate contacts whose cross peaks are likely to be hidden in the spin-diffusion spectrum. Three categories of distances are distinguished by the width of the arrows. In the range 5.5–7.0 Å, only those trans-annular contacts with clearly resolvable chemical shifts are indicated. (b) Two-dimensional proton-driven spin-diffusion spectrum with homonuclear decoupling inω1and a mixing time of 250 ms. The other experimental parameters are the same as indicated in the caption of
Fig. 2. The cross peaks due to trans-annular spin diffusion are indicated by boxes.
indicated. Three classes of distances are encoded by the type of arrow used. A proton-driven spin-diffusion experi-ment allows only a qualitative estimate of the internuclear distance as the cross-relaxation rate constant depends also on the respective zero-quantum line shape function (Suter and Ernst, 1985). For more accurate distance determina-tions, it is advisable to use rf-driven pulse schemes where the 13
C-13
C dipolar interactions are reintroduced in a controlled manner under MAS (Griffiths and Griffin, 1993; Meier, 1994).
As is apparent from Fig. 4b, long-range contacts ex-pected from the X-ray structure appear in a spin-diffusion spectrum for an extended mixing time of 250 ms. For such a long mixing time, the spectrum becomes rather dense, resulting in overlapped cross peaks. For instance, the Cα-Cαcross peak of Phe5
and Phe10
situated near the diagonal cannot be resolved despite its expected large intensity based on Fig. 4a. This also renders a distinction between the cross peaks Val1
/Phe5
and Val1 /Phe10
imposs-ible. Other long-range contacts, such as those between Pro2/Ala4, Phe6/Phe9, and Val1/Ala4, are however visible.
The connections marked by solid arrows in Fig. 4a are
a
b
Fig. 5. Stereospecific assignment of the valine resonances. (a) Pictorial representation of the two valine rotamers with the two neighbouring residues Phe10and Pro2. The drawings are based on the X-ray structure. For conformer II, only the rotation angleχ
1of Val1was changed. The contacts
used for the stereospecific assignment are indicated with arrows. (b) Proton-driven spin-diffusion spectrum with a mixing time of 100 ms. The boxes indicate the cross peaks marked by arrows in (a). The other experimental parameters are the same as indicated in the caption for Fig. 2b.
indicated with boxes in the spectrum in Fig. 4b. Based on these contacts and others observed for different mixing times, it is concluded that the NMR data are not in con-tradiction with the structure determined by X-ray crystal-lography.
Valine rotamer conformations
As discussed in the section ‘13
C resonance assignment’, two sets of peaks can be identified for Val1
: one pair with Cγchemical shift values of 16.1 and 20.5 ppm, and an-other pair with chemical shift values of 17.1 and 19.5 ppm. Several possibilities have to be considered for this doubling of peaks. One possibility is the presence of two crystal forms. Then one would expect a doubling of more peaks than just those of valine, in analogy to the situation in many crystalline amino acids, such as arginine hydro-chloride (Straus et al., 1996). For antamanide, only the peaks of the valine residue are doubled (Table 1), render-ing this hypothesis rather improbable.
A more likely explanation is the presence of two of the three possible χ1rotamers of Val1
, illustrated in Fig. 5a. For the first one with a torsion angle ofχ1= −60°, which is found in the X-ray structure (Karle et al., 1979), the Val1
Cγ1
is relatively close to Phe10
Cα (distance: 4.7 Å) and Phe10
Cβ(distance: 5.5 Å) and the Val1 Cγ2
is close to Pro2 Cα (distance: 4.9 Å) and Phe10Cα (distance: 5.2 Å). The distance to Pro2
Cγ, on the other hand, is relatively large (distance >6.2 Å). For the second rotamer, with a torsion angle of χ1=180°, Val1 Cγ1
is close to Pro2 Cα (distance: 4.3 Å) and Pro2
Cγ(distance: 4.1 Å). For Val1 Cγ2, on the other hand, close contacts are found with Phe10
Cα(distance: 4.7 Å) and Phe10
Cβ(distance: 5.5 Å). The third rotamer, with a torsion angle of χ1= +60°, entails two very strong contacts between Val1
Cγ1 and Pro2
Cα (distance: 4.9 Å) and Phe10
Cα (distance: 5.2 Å).
Val1 Cγ2
for this third rotamer is close to Pro2
Cα (dis-tance: 4.3 Å) and Pro2 Cγ (distance: 4.1 Å). A proton-driven spin-diffusion spectrum (Fig. 5b), with a mixing time of 100 ms, suggests that the first and the second rotamers are present. For the Val1 Cγ pair at 16.1 and 20.5 ppm, we find cross peaks to Pro2
Cα, Phe10 Cα and Phe10
Cβ, but none to Pro2
Cγ. This indicates that this pair of resonances corresponds to the rotamer withχ1= −60° found in the crystal structure and that the stereospecific assignment of the13
C resonances is as follows: CIγ2, 16.1 ppm; CIγ1
, 20.5 ppm. For the other Val1
Cγpair of reson-ances at 17.1 and 19.5 ppm, cross peaks are found be-tween the resonance at 17.1 ppm and both Phe10Cαand Phe10
Cβ, and between the resonance at 19.5 ppm and Pro2
Cα and Pro2
Cγ, indicating that this is rotamer II with χ1=180°. This also allows a stereospecific assign-ment of the resonances: CII
γ2
, 17.1 ppm; CII
γ1
, 19.5 ppm. The presence of cross peaks from Val1
Cγand Val1 Cγ'to Phe10
Cβexcludes rotamer III with χ1=60°. The confor-mational heterogeneity also induces slight chemical shift differences of the other valine resonances (see Table 1). It is therefore concluded that the two different sets of reson-ances indeed arise from twoχ1rotamers. Exchange meas-urements performed on an unlabelled sample indicate that if there is exchange between the two rotamers in the solid state at all, the exchange-time constant must be signifi-cantly larger than 5 s.
It is revealing to compare the above findings with the corresponding rotamer analysis in liquid state. Based on three-bond J-coupling information, Schmidt (1997) could characterize the dynamic conformational equilibrium of the valine side chain of antamanide dissolved in chloro-form by the presence of the three rotamers I (χ1= −60°), II (χ1=180°) and III (χ1=60°), with respective popula-tions of 47%, 34%and 19%. In solution there is only one set of narrow resonances for the valine side chain, due to an interconversion which is significantly faster than the
difference between the chemical shifts of the conformers. Assuming that the chemical shift difference observed at 100 MHz in the solid state (~1 ppm=100 Hz) is also valid in solution, the time constant of these interconver-sions has to be shorter than 2 ms. The two dominantly populated rotamers in liquid state are I and II, which is in agreement with the findings presented here. Also the stereospecific assignment in the solid state is consistent with that in CDCl3solution which is based on the3J(Hα, Cγi) coupling constants (Schmidt, 1997), assigning Cγ1to the resonance at 19.4 ppm and Cγ2
to the resonance at 17.9 ppm. The possibility to investigate individual rota-mers and to determine their chemical shifts therefore allows an estimation of an upper bound of the intercon-version time constant in the liquid state.
The rotamer-dependent chemical shifts observed also for the other resonances of the valine residue imply that these 13
C resonances in the liquid phase would also be affected by a conformational exchange process of the side chain and not only by the dynamics of the backbone. An occasional broadening of13
Cαresonances does not necess-arily indicate an exchange process involving the back-bone, but can also be due to side-chain dynamics. It may even influence15
N resonances.
Methyl-group rotation in solid antamanide
As pointed out by Batchelder et al. (1983), methyl-group rotation can be used as a sensitive probe for molecular packing effects because the rotational correlation times vary in a broad range, from a few picoseconds to several nanoseconds, due to interactions with the surroundings. Methyl-group relaxation in the solid state has been the issue of many investigations in the past (Andrew et al., 1976; Akasaka et al., 1983; Spiess, 1985; Beshah et al., 1987; Beshah and Griffin, 1989; Schleicher et al., 1990). Deuterium relaxation measurements on methyl-group rotation in amino acids proved to be especially informa-tive, indicating a three-site jump process (Beshah et al., 1987). While at low temperatures tunnelling effects play a significant role, at room temperature the motional pro-cess can be described classically by a three-site jump process with a single correlation time (Press, 1981; Linder, 1982). Also in the liquid state, methyl-group13
C relaxation in biopolymers has recently attracted attention (Nicholson et al., 1992; Palmer et al., 1993; Wand et al., 1996). There, the rotational jump process is partially masked by the overall tumbling, and the time constants in the range between 5 and 100 ps are rather ill-determined.
Theχ1conformational static disorder found for Val1 is due to steric interactions of the methyl groups with the environment. It is to be expected that these interactions also lead to effects on the methyl rotation. This motivated the study of methyl13
C T1 relaxation times presented in this section. The relaxation measurements are described
in the Experimental section. The unequal relaxation of the different methyl groups is apparent from Fig. 6, which shows spectra for four different relaxation recovery times. The resulting T1values are listed in Table 2.
The T1 data were analysed using a three-site jump model for the intramolecular methyl-group motion. The general expression for the interpretation of longitudinal dipolar relaxation of a 13
C nucleus rigidly attached to N protons in the solid state is given by (Abragam, 1961)
{
}
1 1 20 4 2 3 6 1 1 0 2 2 2 2 3 2 0 1 2 T N h r J J J C H CH C H C C H = × − + + + − µ π π γ γ ω ω ω ω ω ( ) ( ) ( ) ( )where γC,γH and ωC,ωH are the gyromagnetic ratios and the Larmor frequencies of the carbon and the proton, respectively, and rCH is the internuclear distance. Other relaxation mechanisms, like chemical-shielding-anisotropy and spin-rotation relaxation, can be neglected for methyl groups (Spiess et al., 1973; Spiess, 1978). The auto-spec-tral density functions Jk(ω), k= −2,−1, 0, 1, 2, are given as the Fourier transforms of the auto-correlation functions:
Jk( )ω = ⌠C t ek( ) i tω dt ( ) ⌡ −∞ ∞ − 2 with Ck(t)=4π
〈
Y2k(Ωlab (t))Y*2k(Ωlab (0))〉
(3)and the normalized second-rank spherical harmonics Y2k(Ωlab
), whereΩlab
indicates the pair of polar angles of the considered C–H vector in the laboratory frame (Zare, 1988).
To express an intramolecular axial motion in the pres-ence of magic angle spinning in the laboratory frame, the following two transformations are necessary:
(1) transformation from the coordinate system C of the crystal (chosen such that the z axis is along the axis of motion) to the spinner-fixed frame S with the Euler angles ΦCS=(αCS,βCS,γCS); and
(2) transformation from the spinner-fixed frame S to the laboratory frame L withΦSL=(αSL,βSL,γSL).
For a sample spinning frequency νMAS much higher than the non-spinning relaxation rate constants, it is permitted to average over all values of the spinner phase αSLusing the relation〈e−ilαSLeil'αSL〉 = δl,l'. Choosing the
lab-oratory frame such that γSLis zero and using the trans-formation properties of spherical harmonics (Zare, 1988), one gets the average correlation functions
C t d d d e C t Y Y k lk SL l ml CS m l CS m m i m m mm m C m C CS eq ( ) [ ( )] ( ) ( ) ( ) ( ) ( ) ( ) ( ) ( ) ' ( ) , ' ( ') ' ' * = × =− =− − −
∑
∑
4 4 2 2 2 2 2 2 2 2 2 2 π β β β α Ω Ωwith
Fig. 6. T1relaxation of the methyl region of antamanide at 300 K and a magnetic field of 9.4 T. Four spectra are shown at the indicated delay after the initialπpulse. The inset shows the inversion-recovery behaviour of the same region at 240 K.
TABLE 2
13C METHYL-GROUP RELAXATION DATA OF ANTAMANIDE IN THE SOLID STATE AT 300 K AND 400 MHz PROTON
RES-ONANCE FREQUENCYa Parameter Val1C I γ1(20.5 ppm) Val1C II γ1(19.5 ppm) Ala4Cβ(17.7 ppm) Val1C II γ2(17.1 ppm) Val1C I γ2(16.1 ppm) T1(s) b 0.57±0.08 0.29±0.02 0.56±0.02 0.21±0.02 2.59±0.36 τjump(ps)c 31.2±4.3 61.3±5.9 31.6±2.1 89.0±17.1 6.70±1.2 aThe valine rotamers are labelled according to the conventions used in the text (I:χ
1= −60°; II:χ1=180°). bStandard deviations were estimated using error propagation.
c τ
jumpis defined as (τjump)
−1=3k, where k is the jump rate constant between the sites.
Cmm'(t)=
〈
e−imαCM(0)+im'αCM(t)〉
(5)βSL is the angle between the spinner axis and the static magnetic field,αeq
CSdescribes one of the three equilibrium positions about the axis of rotation of the methyl group, and βCS is the angle between the crystal-fixed frame zC axis and the zSaxis of the coordinate system of the spin-ner. The crystal-fixed frame is chosen such that the zC axis points along the rotation axis of the methyl group, namely the CαCβaxis in the case of alanine and the CβCγi for valine. The polar anglesΩC
give the orientation of the dipolar interaction in the crystal system.
Even ifβSLis at the magic angle, Eq. 4 still contains an orientational dependence (αeqCS,βCS)
unless Cmm'(t) = δm,m'Cmm'(t). The latter condition is fulfilled for certain motional models. The orientational dependence leads to an observed signal consisting of a superposition of spec-tral lines having different relaxation properties.
For a symmetric three-site jump model with equal populations, Cm,m'(t) can be evaluated by standard methods (Brüschweiler and Case, 1994), leading to
Cmm'(t)= δm,0δm',0+(δm,m'+δm,−m'/2+δm/2,−m'−3δm,0δm',0)e
−t/τ (6) whereτ−1=3k with the jump rate constant k. Clearly, the matrix Cmm'(t) is not diagonal and the resulting relaxation behaviour is non-exponential. However, restricting the relaxation measurement to the linear initial regime, the relevant correlation functions can be evaluated by averag-ing over all values ofβCS, leading to (Torchia and Szabo, 1982) C tk e Y Y m i m i m t m C m C CS CS ( ) = ( ) ( ) ( ) * ( ) ( ) =− − +
∑
4 7 2 2 0 2 2 π α α Ω ΩFor the evaluation of 1/T1 according to Eq. 1, ideal tetrahedral geometry and a CH bond length of 1.09 Å were assumed (Ernst and Ernst, 1994). Since the data were taken at one magnetic field only, two solutions exist for the correlation time of the jump process and a further measurement is necessary to check whether the motion is in the fast or in the slow motion regime. The relaxation proceeds faster at 240 K (see the inset in Fig. 6) than at room temperature. Moreover, the relaxation behaviour of the methyl groups is more uniform at the lower ture. This leads to the conclusion that at room tempera-ture the motion is in the fast motional regime, and that at 240 K the relaxation is, for all the methyl groups, close to the T1minimum, where the motional dependence of T1 becomes small. The determined correlation times of the jump processes of the five methyl groups are listed in Table 2.
The jump correlation times are in the range of 5–100 ps, indicating little hindrance of the methyl-group rota-tion. The correlation time of the alanine methyl group in antamanide of 31.6 ps, compared with that observed in polycrystallineD-alanine of 1.6 ns (Andrew et al., 1976;
Akasaka et al., 1983), is in agreement with the well-known loose packing of peptide crystals containing several water molecules. Additionally, the valine relaxation data agree with the low-temperature deuterium study on
N-acetyl-DL-valine (Beshah and Griffin, 1989), where it is found that the two methyl groups have T1 values that differ by an order of magnitude (extrapolating to room tempera-ture, jump correlation times of approximately 200 and 40 ps are determined for the two methyl groups). In
confor-mation II of valine in antamanide, the two methyl groups Fig. 7. Pictorial representation of the proposed model rationalizing the relaxation data of the two valine rotamers in antamanide in the solid state. The methyl groups are indicated as circles, and their rotational correlation times are also given. The hindering potential is indicated by hatched areas (see text).
Val1 CII γ1 and Val1 CII γ2
rotate with similar jump time stants of 61.3 and 89.0 ps, respectively; the other con-former shows a more individual behaviour with 31.2 ps for Val1
CIγ1
and 6.7 ps for Val1 CIγ2
. It is interesting to note that although Val1C
I
γ1
and Val1C II
γ2
occupy the same position in space (see Fig. 5a), their motional behaviour is different by a factor of 2.9. The small jump rate con-stant of Val1
CIγ2
, contrasting with the values of all the other methyl groups, indicates that this resonance must be in a unique surrounding. An inspection of the crystal structure shows that, indeed, Val1
CIγ2
sticks into the in-terior of the antamanide ring while the other three methyl groups stick towards the outside.
A possible model which rationalizes the experimental data is given in Fig. 7. The fact that rotamer III is not found can be explained by a strong steric hindrance in a large angular range (in the shaded area near C'; Fig. 7) allowing only the proton to be close to that region. The three regions of lower steric hindrance are asymmetric and not exactly differing by 120° in their χ1 angles. In rotamer I the methyl group Cγ2 is situated in a relatively wide potential energy minimum with little hindrance (see the above paragraph), leading toτjump=6 ps, being fixed there by the more restrained methyl group Cγ1
withτjump= 31 ps. The restraints for rotamer II are more pronounced, leading to longer values of τjump of 61 and 89 ps. It is impossible at this point to further specify the nature of the restraining interactions. It is well conceivable that, among others, also the interactions with the water mol-ecules could be relevant.
Conclusions
In this paper we have shown that, with the resolution presently achievable by using optimized heteronuclear decoupling and homonuclear J decoupling, it is possible to derive detailed structural and dynamical information
from solid-state MAS spectra of fully 13C-labelled bio-molecules. Assignment of the 13
C resonances is possible without taking recourse to liquid-state information. Based on spin-diffusion experiments, it is also possible to stereo-specifically assign side-chain resonances. While for the system studied here 2D spectra proved to be adequate, for larger peptides and proteins the assignment of 13
C resonances will have to be based on 3D spectra with homonuclear decoupling in both indirect time dimensions (Straus et al., 1996). For fully13
C/15
N-labelled systems, a set of triple-resonance experiments will be advantageous, correlating 13C and 15N nuclei along the backbone and side chains, as proposed, for example, by Tycko (1996).
Two rotamers of the valine side chain of antamanide coexisting in the solid state have been identified. They are found to agree with the predominant rotamers in the liquid state that were identified based on J-coupling infor-mation. Thus, the dynamical conformational equilibrium present in the liquid state is converted into conforma-tional static disorder in the solid. Based on the chemical shift difference in the solid state, an upper bound for the rotational correlation time of 2 ms for theχ1 rotation in the liquid phase at room temperature can be obtained. Furthermore, the methyl-group rotation for these two rotamers was found to depend in a characteristic manner on the rotamer orientation due to specific interactions with the surroundings.
Acknowledgements
We would like to thank Prof. S. Aimoto of the Insti-tute of Protein Research, Osaka University, and Prof. M. Kainosho of the Department of Chemistry, Tokyo Metro-politan University, for supplying fully13
C-labelled anta-manide. Stimulating discussions with PD Dr. R. Meyer, Christoph Scheurer and Dr. Bernhard Brutscher are grate-fully acknowledged. S.K.S. would like to thank NSERC for their financial support. This work has been supported by the Swiss National Science Foundation.
References
Abragam, A. (1961) Principles of Nuclear Magnetism, Oxford Univer-sity Press, Oxford, U.K.
Akasaka, K., Ganapathy, S., McDowell, C.A. and Naito, A. (1983) J. Chem. Phys., 78, 3567–3572.
Andrew, E.R., Hinshaw, W.S., Hutchins, M.G., Sjöblom, R.O.I. and Canepa, P.C. (1976) Mol. Phys., 32, 795–806.
Balaban, T.S., Boender, G.J., Holzwarth, A.R., Schaffner, K. and De Groot, H.J.M. (1995) Biochemistry, 34, 15259–15266.
Baldus, M. and Meier, B.H. (1996) J. Magn. Reson., A121, 65–69. Batchelder, L.S., Niu, C.H. and Torchia, D.A. (1983) J. Am. Chem.
Soc., 105, 2228–2231.
Bennett, A.E., Rienstra, C.M., Auger, M., Lakshmi, K.V. and Griffin, R.G. (1995) J. Chem. Phys., 103, 6951–6958.
Beshah, K., Olejniczak, E.T. and Griffin, R.G. (1987) J. Chem. Phys., 86, 4730–4736.
Beshah, K. and Griffin, R.G. (1989) J. Magn. Reson., 84, 268– 274.
Blackledge, M.J., Brüschweiler, R., Griesinger, C., Schmidt, J.M., Xu, P. and Ernst, R.R. (1993) Biochemistry, 32, 10960–10974. Bremi, T. (1993) Diplomarbeit, ETH Zürich, Zürich, Switzerland. Bremi, T., Ernst, M. and Ernst, R.R. (1994) J. Phys. Chem., 98, 9322–
9334.
Brüschweiler, R., Blackledge, M. and Ernst, R.R. (1991) J. Biomol. NMR, 1, 3–11.
Brüschweiler, R., Roux, B., Blackledge, M.J., Griesinger, C., Karplus, M. and Ernst, R.R. (1992) J. Am. Chem. Soc., 114, 2289–2302. Brüschweiler, R. and Case, D. (1994) Prog. NMR Spectrosc., 26, 27–
58.
Burgermeister, W., Wieland, T. and Winkler, R. (1974) Eur. J. Bio-chem., 44, 311–316.
Earl, W.L. and VanderHart, D.L. (1979) J. Magn. Reson., 48, 35–54.
Ernst, M. and Ernst, R.R. (1994) J. Magn. Reson., A110, 202–213. Ernst, R.R., Blackledge, M.J., Bremi, T., Brüschweiler, R., Ernst, M.,
Griesinger, C., Mádi, Z.L., Peng, J.W., Schmidt, J.M. and Xu, P. (1996) In NMR as a Structural Tool for Macromolecules: Current Status and Future Directions (Eds., Rao, N. and Kemple, M.D.), Plenum Press, New York, NY, U.S.A., pp. 15–30.
Frey, M.H., Opella, S.J., Rockwell, A.J. and Gierasch, L.M. (1985) J. Am. Chem. Soc., 107, 1946–1951.
Griffiths, J.M. and Griffin, R.G. (1993) Anal. Chim. Acta, 283, 1081– 1101.
Griffiths, J.M., Ashburn, T.T., Auger, M., Costa, P.R., Griffin, R.G. and Lansbury Jr., P.T. (1995) J. Am. Chem. Soc., 117, 3539–3546. Hediger, S., Meier, B.H. and Ernst, R.R. (1995) J. Chem. Phys., 102,
4000–4011.
Heller, J., Kolbert, A.C., Larsen, R., Ernst, M., Bekker, T., Baldwin, M., Prusiner, S.B., Pines, A. and Wemmer, D.E. (1996) Protein Sci., 5, 1655–1661.
Hirsh, D.J., Hammer, J., Maloy, W.L., Blazyk, J. and Schaefer, J. (1996) Biochemistry, 35, 12733–12741.
Karle, I.L., Wieland, T., Schermer, D. and Ottenheym, H.C.J. (1979) Proc. Natl. Acad. Sci. USA, 76, 1532–1536.
Kessler, H., Griesinger, C., Lautz, J., Müller, A., van Gunsteren, W.F. and Berendsen, H.C.J. (1988) J. Am. Chem. Soc., 110, 3394– 3396.
Kessler, H., Bats, J.W., Lautz, J. and Müller, A. (1989a) Liebigs Ann. Chem., 1989, 913–928.
Kessler, H., Müller, A. and Pook, K.-H. (1989b) Liebigs Ann. Chem., 1989, 903–912.
Kessler, H., Griesinger, C. and Wagner, K. (1987) J. Am. Chem. Soc., 109, 6927–6933.
Lansbury Jr., P.T., Costa, P.R., Griffiths, J.M., Simon, E.J., Auger, M., Halverson, K.J., Kociska, D.A., Hendsch, Z.S., Ashburn, T.T., Spencer, R.G.S., Tidor, B. and Griffin, R.G. (1995) Nat. Struct. Biol., 2, 990–998.
Lazo, N.D. and Cross, T.A. (1995) J. Magn. Reson., B107, 43–50. Linder, M. (1982) Ph.D. Dissertation (no. 7028), ETH Zürich, Zürich,
Switzerland.
Mádi, Z.L., Griesinger, C. and Ernst, R.R. (1990) J. Am. Chem. Soc., 112, 2908–2914.
Meier, B.H. (1994) Adv. Magn. Reson. Opt. Reson., 18, 1–116. Müller, A. (1986) Ph.D. Dissertation, University of Frankfurt,
Frank-furt, Germany.
Naito, A., Nishimura, K., Tuzi, S. and Saito, H. (1995) Pept. Chem., 1994, 77–80.
Nicholson, L.K., Kay, L.E., Baldisseri, D.M., Arango, J., Young, P.E., Bax, A. and Torchia, D.A. (1992) Biochemistry, 31, 5253– 5263.
Olivieri, A.C., Frydman, L. and Diaz, L.E. (1987) J. Magn. Reson., 75, 50–62.
Opella, S.J., Stewart, P.L. and Valentine, K.G. (1987) Q. Rev. Bio-phys., 19, 7–49.
Palmer III, A.G., Hochstrasser, R.A., Millar, D.P., Rance, M. and Wright, P.E. (1993) J. Am. Chem. Soc., 115, 6333–6345.
Press, W. (1981) Single Particle Rotations in Molecular Crystals, Springer, Berlin, Germany.
Ramamoorthy, A., Fujiwara, T. and Nagayama, K. (1993) J. Magn. Reson., A104, 366–368.
Sarkar, S.K., Torchia, D.A., Kopple, K.D. and VanderHart, D.L. (1984) J. Am. Chem. Soc., 106, 3328–3331.
Schleicher, A., Müller, K. and Kothe, G. (1990) J. Chem. Phys., 92, 6432–6440.
Schmidt, J.M., Brüschweiler, R., Ernst, R.R., Dunbrack Jr., R.L., Joseph, D. and Karplus, M. (1993) J. Am. Chem. Soc., 115, 8747– 8756.
Schmidt, J.M. (1997) J. Magn. Reson., 124, 298–309. Schmidt, J.M. (1997) Supramol. Struct. Funct., to appear.
Spiess, H.W., Schweitzer, D. and Haeberlen, U. (1973) J. Magn. Reson., 9, 444–460.
Spiess, H.W. (1978) NMR Basic Principles Prog., 15, 55–214. Spiess, H.W. (1985) Adv. Polym. Sci., 66, 23–58.
Stewart, P.L., Tycko, R. and Opella, S.J. (1988) J. Chem. Soc., Faraday Trans., 84, 3803–3819.
Straus, S.K., Bremi, T. and Ernst, R.R. (1996) Chem. Phys. Lett., 262, 709–715.
Suter, D. and Ernst, R.R. (1985) Phys. Rev., B32, 5608–5627. Torchia, D.A. and Szabo, A. (1982) J. Magn. Reson., 49, 107–121. Tuzi, S., Shinzawa-Itoh, K., Erata, T., Naito, A., Yoshikawa, S. and
Saito, H. (1992) Eur. J. Biochem., 208, 713–720. Tycko, R. (1996) J. Biomol. NMR, 8, 239–251.
Wand, A.J., Urbauer, J.L., McEvoy, R.P. and Bieber, R.J. (1996) Biochemistry, 35, 6116–6125.
Wüthrich, K. (1986) NMR of Proteins and Nucleic Acids, Wiley, New York, NY, U.S.A.
Zare, R. (1988) Angular Momentum, Wiley/Interscience, New York, NY, U.S.A.