Applied
Magnetic Resonance
© Springer-Verlag 2000 Printed in Austria
Effect of Oxidation of Cobalt-Based Nanowires
on NMR Spin-Lattice Relaxation
H. De Riedmatten, V. Scarani, and J.-P. Ansermet Institut de Physique Expérimentale, Ecole Polytechnique Fédérale de Lausanne,
Lausanne, Switzerland
Received July 19, 1999; revised August 2, 2000
Abstract. Nuclear spin-lattice relaxation measurements were performed on Co-based magnetic nanowires, in zero field and in 1 T applied field. A measurement method is developped that allows a confident interpretation of the experimental data. An enhanced relaxation due to a thermally activated phenom-enon associated to oxidation is reported for the first time in the nuclear magnetic resonance of ferro-magnetic systems.
1 Introduction
In the last decade, the need for characterizing the properties of magnetic nano-structures implied a revival of interest in the nuclear magnetic resonance (NMR) of ferromagnetic systems [1, 2]. The spin-lattice relaxation (SLR) time T, might appear as a good parameter for monitoring spin waves. However, this intuitive statement turns out to be far from obvious: the role of electronic spin waves on T, has often been invoked but never directly demonstrated. For nuclei in do-mains, the controversy dates back to Weger [3] and Moriya [4] and has not been settled according to more recent work (see, e.g., [5, 6]). Moreover, the very mea-surement of SLR has peculiar features, like the dependence of relaxation on the applied radio-frequency (rf) field [7], that raise serious problems about method and interpretation. At the beginning of NMR studies of ferromagnetic samples, some authors tried to describe the SLR mechanism for nuclei in domain walls (DW) [3, 8, 9]. Recently, Dho and Lee [10] resumed this controversy. Except Weger's work [3] (whose data and interpretation have been seriously questioned [4, 6]), all these studies concern 57Fe NMR. In spite of the relative simplicity of the NMR of this isotope, a comprehensive picture of the relaxation mecha-nisms is still lacking.
It is obvious that 59Co (with its spin 7/2 and its many possible crystallographic structures) is not the suitable isotope to explore the fundamental mechanisms
governing the NMR of ferromagnets; in particular, the zero-field value of T, of 59Co has been considered as ill-defined [11]. In our case, the choice of this nucleus is linked to the study of spin-dependent transport. We describe a suit-able calibration protocol allowing a consistent interpretation of T, even in the zero-field situation; and we show that by measuring T, between 20 K and room temperature we can monitor the oxidation process of cobalt.
2 Samples
Samples under study are cobalt-based magnetic nanowires grown by electrodepo-sition in a polycarbonate membrane [12]. Each sample consists of about 1010 wires. One of the advantages of such templates is the possibility of detecting a room temperature signal. In this work we have studied arrays of Co wires and multilayered Co/Cu wires, both grown with a bath containing a Cu salt. The face-centered cubic (fcc) structure is dominating even in the case of homogeneous wires because of the presence of the Cu impurities codeposited with Co (15% in volume, in the form of clusters of few tenths of atoms) [13]. The length of the wires is 6 gm, the mean diameter is 80 nm; the skin depth being typically longer (about 1 tm), we detect an NMR signal from the whole sample. The picture arising from the experimental data leads to the conclusion that we ob-serve nuclei in domains [14, 15]. In multilayers, the Co and Cu layers had the same thickness. Data are reported for layer thicknesses of 6, 21, 30 and 48 nm (an error of ±0.5 nm was determined on the statistics of growth times).
In our samples, the hyperfine field responsible for the Zeeman splitting of the nuclear spin levels cannot be considered as perpendicular to the applied rf field B,. In the literature, some discussion is given about the orientation of the global electronic magnetization with respect to the wires axis [16]. However, the absence of texture evidenced by X-ray measurements in our wires shows that this local magnetization has no preferred direction [13].
3 Measurement of T,
The spectral line of bulk 59Co in ferromagnetic samples has a width of about 20 MHz. When temperature is decreased from 300 to 20 K, peaks shift to higher frequencies by an amount of about 4 MHz. We worked with a nonresonant probehead in order to have the same applied rf field over the whole frequency range. By measuring the voltage across the coil, we estimated B, - 0.5 G.
For the SLR measurements, we used a pulse sequence composed, as usual, of a saturating sequence that destroys nuclear magnetization, followed after a time t by a spin-echo sequence r-wait-r to detect the signal. The SLR curve is ob-tained by plotting the integral of the echo signal as a function of t. The single-exponential fit was always found in satisfactory agreement with the data. Since the hyperfine field has no preferred direction with respect to B„ a special satu-ration sequence was used. It consisted of four long pulses, whose length is similar
to the measured Tz (20-30 ts). During these pulses, the nuclear magnetization nutates, and coherence is lost in the plane normal to the effective field. By ap-plying these pulses in different directions, we obtain a satisfactory destruction of the nuclear signal.
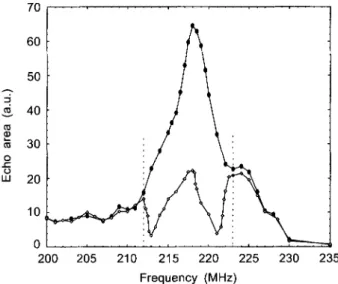
Some unwanted mechanisms must be ruled out in order to interprete the sig-nal recovery curve as a SLR. Cross-relaxation cannot be excluded a priori. The inhomogeneous broadening of the spectral line is enormous. This suggests that cross polarization is weak; but indirect coupling in ferromagnets is long-range. The influence of cross polarization has been ruled out by saturating the nuclear magnetization on a wide frequency range while detecting the spin-echo signal on a much narrower range. In our case, the length of the pulses and the spec-trometer parameters impose a detection range of about 2 MHz. We used for the saturation sequence a second frequency generator with frequency modulation, and we obtained a saturation range of about 8 MHz (Fig. 1). When the frequency range of saturation was reduced to about 1 MHz, the observed recovery rate was almost twice as high, a probable signature of cross-relaxation. Another spurious effect could be the selective irradiation of some quadrupolar transitions. This was excluded with a saturation range of 8 MHz, since quadrupolar splitting is known to be about 200 kHz for Co in the hexagonal close-packed (hcp) phase [17, 18].
Therefore, all SLR data in this work were obtained by saturating the magne-tization on a range of 8 MHz. We still had to tackle the problem of SLR mea-surements specific of ferromagnetic samples: the dependence of the measured SLR rate on the intensity of B,. We show that this dependence comes from a distri-bution of the enhancement factor q, a factor that is proportional to the projec-tion of the hyperfine field on the direcprojec-tion of B, and depends on the details of
70 60 50 40 m a) m 30 0 U LU 20 10 0 1^ 200 205 210 215 220 225 230 235 Frequency (MHz)
Fig. 1. Pointwise reconstruction of the spectral line of homogeneous Co + 15% Cu nanowires at 80 K, recorded 200 ns (0) and 20 ms (•) after the saturation sequence.
domain-wall dynamics [5, 19, 20]. Given B, and a pulse length of the echo se-quence r, a nuclear spin feeling an enhancement factor q rotates by
B(BI, z, i) = (I + l/2)yB1rq , (1)
where the factor I + 1/2 appears since we are dealing with a quadrupolar nucleus [15]. The observed signal comes mainly from those nuclei for which 9(B1, r, 77) =
2m/3, since we are using a r-wait-r echo sequence. The echo integral is actu-ally found to scale with B, z, as expected. And also the value 1/T, obtained by varying both the intensity of the rf field B, and the pulse length z has been found to scale with B, r, on several samples at various temperatures. This demonstrates that the B,-dependence of 1/T, is actually a dependence on i7, as announced. We define X70 = (2'/3)[47(B, z)max] - ', where (B, a)max is the value of B, z that gives the maximum value of the echo integral. i was found to range between 60 and
200 in all our samples and for all temperatures.
We are now able to describe our protocol for SLR measurements and to stress the underlying physical hypothesis. First, at any temperature we draw the spec-tral line and select a peak. On this peak we perform the pulse calibration, and we select the pulse length giving the maximum signal that defines rho at any tem-perature. We make the fundamental (and reasonable) hypothesis that the spins giving the maximum signal are the same at all temperatures. We did not perform systematic SLR measurements on other values of the enhancement factor. (The study of the i7-dependence of SLR was performed on the fcc peak of homoge-neous wires at 80 K. The dependence is approximately linear for it/6yB,z <
500 3'z . The extrapolated SLR rate in the ij — 0 limit is not zero. For higher values a limiting upper value of 1/T, is reached. This means that 3 17o is the maxi-mum enhancement factor in the studied sample: for low values of B, z, actually no nuclear spin rotates by B = 2it/3, and we detect the signal of the nuclei that have the maximum enhancement factor, but that have not yet undergone a 2it/3
rotation.)
4 Experimental Data
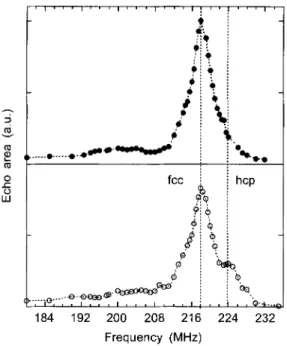
When the sample grows old, a structural modification is observed: an hcp peak tends to develop, even for samples that presented no hcp feature when measured just after their fabrication (Fig. 2). This effect and oxidation are of course co-existing; however, we cannot conclude that oxidation is the cause of the struc-tural modification: since hcp is the thermodynamically stable phase for Co, it is possible that some spontaneous annealing on a nanoscale takes place.
The reported SLR measurements were always performed on the same peak, bulk fcc, since this peak was well-defined in all samples. No significant difference in T, was seen by measuring other peaks (hcp and first Cu neighbor) when present.
Figure 3 shows the temperature dependence of the SLR relaxation rate 1/T, for homogeneous wires, measured in zero field under different oxidation condi-tions. The first measurement was performed four weeks after the fabrication of
co 11) 0 0 u-I ei hI ' Ik S ___________________________ -
•
5... fcc hcp 184 192 200 208 216 224 232 Frequency (MHz)Fig. 2. Spectral lines for homogeneous Co + 15% Cu nanowires at 80 K, before (•) and after (0) oxidation in air. The emergence of an hcp peak is more probably the result of an annealing than a
consequence of oxidation. 8000 6000 4000 I-2000 S 0 0 \\ \ / -100 200 300 Temperature (K)
Fig. 3. 1/T1 as a function of temperature in zero-field for homogeneous Co + 15% Cu nanowires,
un-der increasing oxidation degrees (• nonoxidized; 0 1 month in air; • 48 h in oxygen at 100°C; 11 200 more hours in oxygen at 100°C). The lines are a guide for the eye.
the sample. We observe a linear temperature dependence, with a slope 1IT1T =
8.1±0.4 1/sK. The comparison with the literature is not easy because reported values range on two orders of magnitude [21]; our value is similar to the value of 13 1/sK found by Weger [3] and Jaccarino et al. [22]; and we could have doubled the value by selecting the nuclei having the highest enhancement instead of X70. The absence of peculiar features due to oxidation is not astonishing since the wires are embedded in a polycarbonate membrane, and one must wait for oxygen to diffuse. The sample was then measured one month later, and a new feature, a peak, was observed in the T1(T) behavior. To confirm that this modi
-fication is due to oxidation, we accelerated the oxidation process by letting the sample for 48 h and then for further 200 h in an oxygen atmosphere at 100°C. The peak was indeed found at higher temperatures. It was necessary to measure up to room temperature to have a correct interpretation of the T1(T) behavior; a
measurement limited to 100 K would have led to an erroneous interpretation. An applied field of 1 T reduces but does not suppress the peak. In this sample, the enhancement factor for the selected spins i7o shows the same temperature be-havior as the SLR rate; however, this feature is not universal for all samples. The peak in the SLR rate had already been observed in previous measurements on other samples, performed without pulse calibration: the calibration does not "generate" the peak, it simply allows a confident interpretation of the data.
The same behavior for the temperature dependence of 1/T1 was found for Co/Cu multilayered nanowires oxidized in air. In zero external field, the slope of the lin-ear term was approximately twice as steep in multilayers as in homogeneous wires; in a 1 T field, this difference is suppressed [14]. Once the linear term is subtracted from 1/T,(T), we are left with the peaks, which in multilayers are centered at higher temperatures compared to homogeneous wires oxidated in air.
5 Conclusion
A consistent measurement method of T, in zero-field 59Co NMR of nanosized ferromagnetic samples has been developed, that allows a confident measurement of this parameter. A new relaxation mechanism has been seen: its features are typical of a thermally activated phenomenon [14]; to our knowledge, such a mechanism has never been reported for SLR in ferromagnetic systems.
References
1. Panissod P. in: Frontiers in Magnetism of Reduced Dimension Systems (Baryakhtar V.G., Wigen P.E., Lesnik N.A., eds.). Dodrecht: Kluwer Academic Press 1998.
2. de Gronckel H.A.M., de Jonge W.J.M. in: Magnetic Multilayers (Bennett L.H., Watson R.E., eds.). Singapore: World Scientific 1994.
3. Weger M.: Phys. Rev. 128, 1505-1511 (1962) 4. Moriya T.: J. Phys. Soc. Jpn. 19, 681-687 (1964) 5. Turrell B.G.: Hyperfine Interact. 7, 429-448 (1980)
7. Weisman I.D., Swartzendruber L.J., Bennett L.H. in: Nuclear Resonance in Metals. Measurement of Physical Properties, Part 2: Magnetic Properties and Mössbauer Effect (Passaglia E., ed.). New York: Wiley Interscience 1973.
B. Winter J.M.: Phys. Rev. 124, 452-459 (1961) 9. Stearns M.B.: Phys. Rev. 187, 648-656 (1969) 10. Dho J., Lee S.: Phys. Rev. B 56, 7835-7838 (1997)
11. Kaplan N., Jaccarino V., Lewis R.T.: J. Appl. Phys. 39, 500-503 (1968)
12. Blondel A., Meier J.P., Doudin B., Ansermet J.-P.: Appl. Phys. Lett. 65, 3019-3021 (1994) 13. Scarani V., Doudin B., Ansermet J.-P.: J. Magn. Magn. Mat. 205, 241-248 (1999) 14. ScaraniV., de Riedmatten H., Ansermet J.-P.: Appl. Phys. Lett. 76, 903-905 (2000)
15. Scarani V.: Ph. D. Thesis, Ecole Polytechnique Fédérale de Lausanne, Lausanne, Switzerland 2000. 16. Ferré R., Ounadjela K., George J.M., Piraux L., Dubois S.: Phys. Rev. B 56, 14066-14075 (1997) 17. Riedi P.C., Scurlock R.G.: Phys. Lett. A 24, 42-43 (1967)
18. Fekete D., Boasson H., Grayevski A., Zevin V., Kaplan N.: Phys. Rev. B 17, 347-354 (1978) 19. Turov E.A., Petrov M.P.: Nuclear Magnetic Resonance in Ferro- and Antiferromagnets: New York:
Halsted 1972.
20. Steams M.B.: Phys. Rev. 162, 496-509 (1967)
21. Stearns M.B. in: Landolt-Börnstein, Numerical Data and Functional Relationships in Science and Technology, New Series III/19a, p. 68. New York: Springer 1987.
22. Jaccarino V., Kaplan N., Walstedt R.E., Wernick J.H.: Phys. Lett. 23, 514-515 (1966)
Authors address: Jean-Philippe Ansermet, Institut de Physique Expérimentale, Ecole Polytechnique Fédérale de Lausanne, CH-1015 Lausanne, Switzerland