Combining the categorical and the dimensional perspective in a diagnostic map of psychotic disorders
8
0
0
Texte intégral
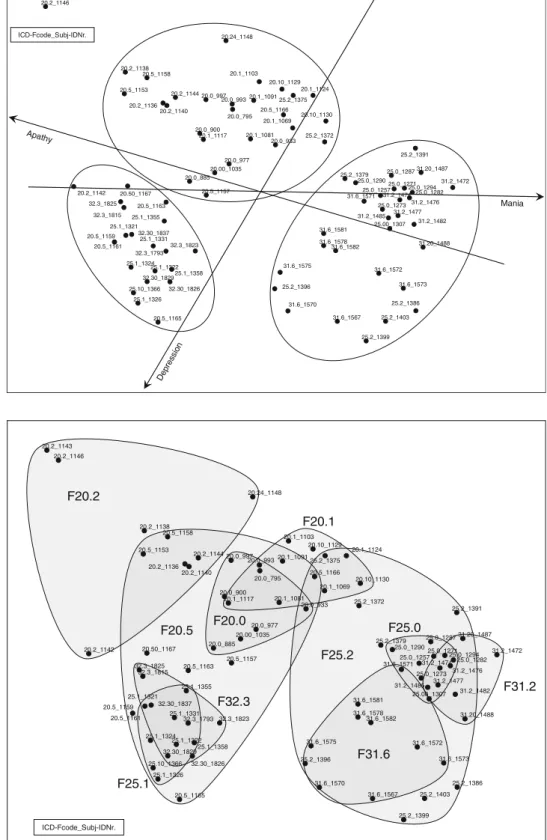
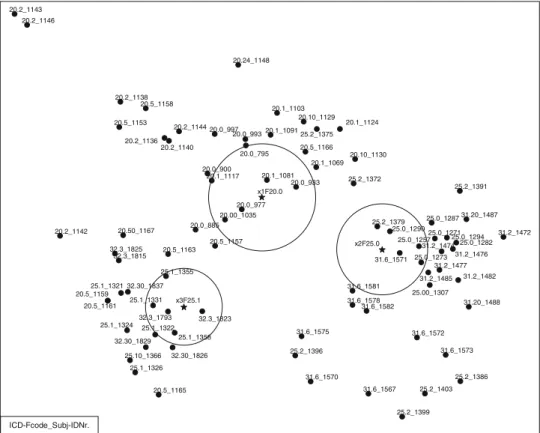
Figure
Documents relatifs