HAL Id: inserm-00188486
https://www.hal.inserm.fr/inserm-00188486
Submitted on 19 Nov 2007
HAL is a multi-disciplinary open access
archive for the deposit and dissemination of
sci-entific research documents, whether they are
pub-lished or not. The documents may come from
teaching and research institutions in France or
abroad, or from public or private research centers.
L’archive ouverte pluridisciplinaire HAL, est
destinée au dépôt et à la diffusion de documents
scientifiques de niveau recherche, publiés ou non,
émanant des établissements d’enseignement et de
recherche français ou étrangers, des laboratoires
publics ou privés.
Clustering follow-up time-series recorded by cardiac
implantable devices.
Marie Guéguin, Emmanuel Roux, Alfredo Hernández, Fabienne Porée,
Philippe Mabo, Laurence Graindorge, Guy Carrault
To cite this version:
Marie Guéguin, Emmanuel Roux, Alfredo Hernández, Fabienne Porée, Philippe Mabo, et al..
Cluster-ing follow-up time-series recorded by cardiac implantable devices.. Conference proceedCluster-ings : .. Annual
International Conference of the IEEE Engineering in Medicine and Biology Society. IEEE Engineering
in Medicine and Biology Society. Annual Conference, Institute of Electrical and Electronics Engineers
(IEEE), 2007, 1, pp.3848-3851. �10.1109/IEMBS.2007.4353172�. �inserm-00188486�
Clustering follow-up time-series recorded by cardiac implantable devices
M. Gu´eguin, E. Roux, A.I. Hern´andez, F. Por´ee, P. Mabo, L. Graindorge, G. Carrault
Abstract— Follow-up of patients treated by cardiac
resyn-chronization therapy (CRT) is of great interest to prevent health deterioration in the postoperative period. In this purpose, data recorded in implantable devices (ID) can be informative. They are large, multivariate, evolutive with time, and then difficult to interpret. This study proposes a methodology, based on Multiple Correspondence Analysis (MCA) and fuzzy coding, to i) reduce the dimensionality of these data, ii) characterize the factorial axes by the variables recorded in the ID, iii) identify evolutions of patients in the factorial plane which are related to health deterioration. The results show that the first three axes of the MCA contain more than 90% of the total variance and are linked to the functional state of the patients. A simple clustering of the patients is performed and defines an area of the factorial plane, correlated with a degradation of patients’ clinical state.
I. INTRODUCTION
Cardiac resynchronization therapy (CRT) is currently re-ported as the most efficient treatment for patients with refractory heart failure (RHF) associated with intraventricular dyssynchrony [1]. However, 20-30% of these patients do not respond to this novel therapy and 10% of them even undergo a worsening of their symptoms.
In this field, the challenge is thus to identify these non-responders and to prevent severe degradation of implanted patients with an individual follow-up. The new implantable devices (ID) developed for CRT can record and store an increasing amount of data on the functional state of the patient (e.g. heart rate) and even on the activity of the patient. These data are large, multivariate, time-dependent and heterogeneous, which make their interpretation difficult for experts, like physicians or engineers.
Our objective is to propose a methodology to exploit this amount of multivariate data towards a follow-up of the clinical state of implanted patients. In a previous study [2], we used a Principal Component Analysis (PCA) to reduce the dimensionality of the time-series and facilitate their interpretation. This study showed the interest of the multidimensional data analysis of the data recorded in the ID memory to objectively assess the patients’ functional state.
In this paper, a Multiple Correspondence Analysis (MCA) associated with a spatio-temporal fuzzy coding of the time-series, which allows a better handling of the temporal di-mension of the data, is proposed. Our aim in this paper is to
M. Gu´eguin, A.I. Hern´andez, F. Por´ee, P. Mabo, G. Carrault are with INSERM U642, Rennes, F-35000, France; Universit´e de Rennes 1, LTSI, Rennes, F-35000, France.marie.gueguin@univ-rennes1.fr
E. Roux is with IRD UR154, LMTG, Universit´e de Toulouse III, Toulouse, France.
P. Mabo is also with the Department of Cardiology, CHU Pontchaillou, Rennes, France.
L. Graindorge is with Sorin Group, Le Plessis-Robinson, France.
use MCA to i) analyze the link between the factorial axes and the variables recorded in the ID memory, ii) perform a clustering of the patients according to their evolution in the factorial plane and iii) compare the obtained clusters with the clinical state of the patients.
II. MATERIALS AND METHODS
A. Clinical protocol and data
Patients participating in the present study suffer from RHF and have an indication for CRT. Data stored in the ID memory are retrieved at the end of the third, the sixth and the twelfth postoperative months and cover a three-month length period. These data result from two sensors: a transthoracic impedance sensor and an accelerometer which reflect the ventilation and the physical activity of the patient [3], respectively. The activity level of the patients is classified into two states: exercise and rest. These states are defined by the joint information given by the two sensors and by means of two thresholds. For each state, 24-hour cumulative values of all variables are computed and recorded in the ID memory over 30-day follow-up periods. The 13 physiological variables are listed in Table I.
TABLE I
LIST OF PHYSIOLOGICAL VARIABLES
Description Names Units
Total duration within
the activity level DurationE1 s Cumulative values of acceleration AccelerationE m · s−2(g) Cumulative values of impedance ImpedanceE millivolts (mV ) ImpedanceR Cumulative number of ventilation cycles N bBreathsE N bV C N bBreathsR Cumulative number
of cardiac cycles N bCardCycE N bCC “Mean”2activity
intensity ActIntensity g · s−1
ImpedanceEover
AccelerationE ImpOverAcc mV · g −1
“Mean” heart rate HeartRateE Beats per minute (bpm) “Mean” impedance
minute ventilation ImpM inuteV entE mV · min−1 “Mean” ventilation
frequency V entilationF reqE N bV C · min−1
ImpedanceEover
ImpedanceR ImpedanceRate none 1Subscripts E and R are for Exercise and Rest, respectively.
2The duration of each Exercise and Rest period that occurs within 24 hours is unknown. Only the cumulative duration is known. Consequently, this “mean” is not the average of the variable values over 24 hours, excepted if all the periods are of the same duration.
HAL author manuscript inserm-00188486, version 1
HAL author manuscript
B. Method
The entire methodology is illustrated in Figure 1 and is described in details in this section.
Fuzzy space-time coding Multidimensional
time-series SMCA Clustering DTW
Clusters
Fig. 1. Schema of the proposed methodology.
1) Fuzzy coding of time-series: MCA is intended to
qualitative data and exploits disjunctive tables Z =
(zij)(i,j)∈[1,L]×[1,C]where zijis the membership value of the object i to the modality j. In this study, MCA is applied to quantitative data (i.e. multivariate time-series). Consequently, it requires the transformation of raw data into the appropriate format. In this purpose, we propose to use the fuzzy space-time windowing, defined by Loslever and Bouilland for characterizing and coding biomechanical temporal data [4].
Usually, zij ∈ {0, 1} (i.e. the object i belongs or does
not belong to the modality j), but MCA can also exploit
a fuzzy version of Z where zij ∈ [0, 1] with the condition
P
j∈Jvzij = 1, Jv being the set of modalities of the v
th attribute (variable).
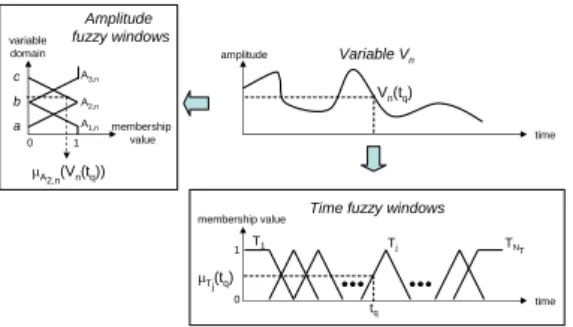
As depicted in Figure 2, fuzzy space-time windowing consists in considering the time domain of each variable
through a fuzzy window set T = {T1,· · · , Tj,· · · , TNT}
such that µTj(tq) (i.e. the membership value of the q
th
time sample tq) falls between [0,1] and meets the condition
P
jµTj(tq) = 1. In the same way, the range of amplitudes
(spatial domain) of each variable is considered through NA
spatial fuzzy windows with the same properties.
Let Vn(tq) be the value taken by the nth variable at
time unit tq. Let µTj(tq) (respectively µAi,n(Vn(tq))) be the
membership value of the jth time window Tj for the qth
time unit (respectively of the ith space window Ai,n for
the Vn(tq) value). The membership value of the space-time
window Wi,jn for a given time-series (signal) T S and the
variable Vn, is defined as in [4]: µWn i,j = 1 PQ q=1µTj(tq) · Q X q=1 µTj(tq) · µAi,n(Vn(tq)) (1)
with Q being the number of time units in T S, and µWn
i,j, the
weighted average of the space membership values with the time membership values as weights. Note that for a given
variable Vn and a given temporal window j, µWn
i,j verifies:
P
iµWn
i,j = 1. This property is required to maintain the
statistical context and to allow µWn
i,j to be interpreted as the
frequency of the appearance of the signal in the space-time
window Wn
i,j.
The membership values of the space-time windows can then be organized in a table Z with statistical individuals in rows and variables in columns and can be directly analyzed with MCA.
2) Multiple Correspondence Analysis (MCA): Within the
data analysis and the data mining fields, Principal Compo-nent Analysis (PCA) and Multiple Correspondence Analysis
time amplitude Vn(tq) Variable Vn time tq 0 1 µTj(tq) membership value T1 Tj TNT Time fuzzy windows
0 1 membership value A1,n A2,n A3,n variable domain a b c µA2,n(Vn(tq)) Amplitude fuzzy windows
Fig. 2. Temporal and spatial fuzzy coding of a continuous signal.
(MCA) are two popular methods for exploring multidimen-sional data. They both exploit a two dimenmultidimen-sional table cross-ing the objects of interest (also called statistical individuals or observations, represented by the rows of the table) and the variables (or attributes) characterizing these objects (the columns of the table). PCA exploits real value data and only exhibits linear relationships between variables. MCA has been developed for qualitative data and especially for survey results analysis. However, its application has been extended to symbolized real value data. The latter method presents the great advantage of jointly analyzing quantitative and qualitative data and to capture non linear relationships between attributes. In this study, we choose to apply MCA. In MCA, supplementary variables and individuals can be displayed jointly with the variables and individuals of analysis. They do not participate to the computation of the MCA but their projection on the factorial plane: i) facilitates the interpretation of the MCA factorial axes by relating them to meaningful variables (e.g. age, sex, etc.) and ii) enables the characterization of supplementary individuals according to their locations with respect to individuals of analysis. Consequently, MCA enables to represent data acquired from other patients’ ID on the factorial plane in order to study the evolution of these patients’ state with respect to the patients of analysis.
MCA does not explicitly exploit time. However, the tem-poral dimension can be introduced in different ways. A basic solution is to represent each time sample (or time window) of a time-series by one statistical individual (a row of the table of analysis) and to perform MCA [4]. A time-series is consequently represented by as many rows as there are time samples or time windows. This method is very simple and the interpretation of the results is rather easy. Statistical individuals are represented by trajectories onto the factorial plane and their temporal evolution can then be exploited.
To smooth the trajectories in the factorial plane and facil-itate the classification, we apply a weighted and smoothed temporal average on the table analyzed by MCA. The final
table of analysis is S = P · Z, where P = (pij)(i,j)∈[1,L]2
is a proximity matrix defining the weighted and smoothed
temporal average and is such as PLj=1pij = 1. This
method is named Smoothed Multiple Correspondence Anal-ysis (SMCA).
3) Unsupervised clustering with Dynamic Time Warping (DTW) as a dissimilarity measure: One of our objectives
is to cluster the patients according to their evolution in the factorial plane defined by SMCA. As there is no a priori knowledge on the classes, the clustering is unsupervised and will only exploit the most informative factorial axes. Among the unsupervised clustering techniques, Agglomerative Hier-archical Clustering (AHC) seems appropriate. It requires a
dissimilarity matrix between the objects (i.e. the trajectories)
and a criterion called aggregation link. At each step, the two closest clusters, in the sense of the chosen aggregation link, are merged. The algorithm stops when the initial objects are all merged into a final cluster. As an aggregation link, we choose the so-called complete link, which, at each step in the analysis, considers the distance between one cluster and another cluster to be equal to the longest distance from any member of one cluster to any member of the other cluster.
The main difficulty is the definition of a similarity measure that corresponds to our data, i.e. time-series forming trajec-tories on factorial planes. As these trajectrajec-tories are subject to eventual non linear spatio-temporal deformations and are possibly at different lengths, Dynamic Time Warping (DTW) is proposed as a dissimilarity measure. DTW has been widely used as a measure of dissimilarity in time-series clustering, indexing and retrieving [6] or in handwriting recognition [7]. Comparing to the Longest Common Subsequence (LCSS), also studied as a similarity measure for heterogeneous mul-tivariate time-series [5], DTW presents the advantage to be non-parametric and seems thus more appropriate for unsupervised clustering.
In this study, time-series are represented in the factorial plane by trajectories. Both their location and their
evolu-tion, i.e. both their coordinates and their derivatives, in the
factorial plane are informative to cluster similar trajectories. Instead of directly using the DTW of the trajectories’ coor-dinates, we use the DTW between their derivatives to which is added the Euclidian distance between the means of their coordinates in the factorial plane.
Consequently, given two trajectories T raj1 and T raj2,
and their derivatives dT raj1 and dT raj2, we define the
distance between the two trajectories T raj1 and T raj2
as DM(T raj1, T raj2) = DT W(dT raj1, dT raj2) +
euclid(mean(T raj1), mean(T raj2)), where euclid(a, b) is
the Euclidian distance between a and b.
Each element (k, l) of the distance matrix used for the
AHC corresponds to the distance DM between the kth and
the lth trajectories.
III. RESULTS
A statistical individual corresponds to one temporal fuzzy window for a given patient and a trajectory is characterized by the data retrieved at the end of each three-month length period for each patient. In this way, a given patient is repre-sented by several statistical individuals and by one to three trajectories. In this study, for the fuzzy space-time coding,
we consider a fuzzy window set T = {T1,· · · , Tj,· · · , TNT}
where each Tj is 7-day long. The protocol provided 88
records for 48 patients. SMCA is thus applied to 1108 statistical individuals related to these 48 patients, i.e. to an
array of 1108 rows and 39 columns (13 variables with NA =
3 spatial fuzzy windows). The 3 spatial fuzzy windows are
denoted with the suffixes “−H” for the higher level, “−M ”
for the medium level and “−L” for the lower level.
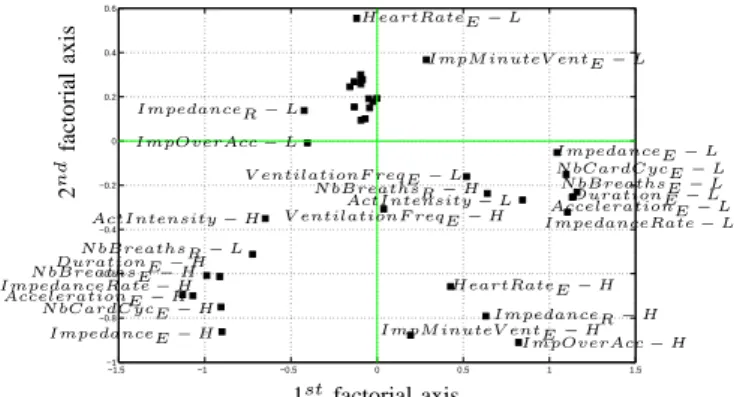
The first three factorial axes obtained by the SMCA represent 65.79, 14.79 and 12.34% of the total variance of the data, i.e. near 93% in total. The first axis is mainly defined
by the lower (−L) and higher (−H) levels of ImpedanceE,
DurationE, N bCardCycE, N bBreathsE, AccelerationE
and ImpedanceRate, which represent the time spent in exercise and the intensity of the efforts. Consequently, in Figure 4, the more the individuals are located to the right of the plane, the lower is the time spent in exercise and the less important are the efforts they make. The second axis is
mainly defined by the medium (−M ) and extreme (−H,−L)
levels of ImpM inuteV entE, ImpOverAcc, ImpedanceR
and HeartRateE, which define the ventilation activity in
terms of amplitude, frequency and flow rate, especially in rest. This axis can be interpreted as an “axis of cardiovascular efficiency”. In Figure 4, the more the individuals are located to the lower part of the plane, the less important is their ventilation in rest (i.e. their cardiovascular system is more “efficient”), and this independently of the daily activity duration and intensity (i.e. of the position along the first axis). Using the proposed methodology described in paragraph II-B and in Figure 1, a dendrogram of the trajectories is obtained. We identified three clusters by cutting this den-drogram at the corresponding threshold. Figure 4 presents patients in each cluster on the first factorial plane. Cluster 2 is located on the left part of the factorial plane and, considering the positions of the variables presented in Figure 3, this cluster is correlated with a high activity and a low ventilation in rest. Cluster 3 is located in the right-bottom part of the factorial plane and corresponds to a low activity. Cluster 1 is larger and is more correlated with medium physical activity and ventilation.
Considering the clinical state of the patients, it appears that the patients belonging to cluster 3 (on the right-bottom of the factorial plane in Figure 3) underwent a degradation of their physical condition, and one even died during the twelve-month postoperative period. On the other hand, none of the patient belonging to cluster 2 (on the left of the factorial plane in Figure 3) experienced worsening of symptoms during the twelve-month postoperative period. These clusters seem then correlated with the clinical state of the patients, as indicated by the SMCA.
IV. DISCUSSION AND CONCLUSIONS The objective of this study was to propose a methodology to analyze the amount of data provided by ID towards a follow-up of the clinical state of implanted patients. It shows the validity of the Smoothed Multiple Correspondence Analysis (SMCA) associated with a fuzzy coding of the time-series for a correct exploitation of the temporal dimension, which is of first interest in a follow-up frame. The first
−1.5 −1 −0.5 0 0.5 1 1.5 −1 −0.8 −0.6 −0.4 −0.2 0 0.2 0.4 0.6 DurationE − L DurationE − H AccelerationE − L AccelerationE − H ImpedanceE − L ImpedanceE − H ImpedanceR − L ImpedanceR − H N bBreathsE − L N bBreathsE − H N bBreathsR − L N bBreathsR − H N bCardCycE − L N bCardCycE − H ActIntensity − L ActIntensity − H ImpOverAcc − L ImpOverAcc − H HeartRateE − L HeartRateE − H ImpM inuteV entE − L
ImpM inuteV entE − H V entilationF reqE − L
V entilationF reqE − H ImpedanceRate − L
ImpedanceRate − H 1st factorial axis 2 n d fa ct o ri al ax is
Fig. 3. Analysis variables are represented in the first plane of the MCA. For each variable, only the first (Low, −L) and the third (High, −H) levels are labelled, unlabelled squares correspond to the second levels (Medium, −M ).
factorial plane defined by SMCA represents more than 90% of the total variance of the data and seems correlated with clinical state of the patients. A simple unsupervised clustering of the trajectories into three clusters allows the distinction of two extreme areas in the factorial plane, the left of the plane being associated with a favorable evolution and the right with a health deterioration. Clinical evaluations of patients in each one of these clusters are consistent with this observation. These preliminary results are interesting as they show the feasibility of the proposed methodology. A supervised clustering would be necessary to improve the processing of the trajectories located on the middle of the factorial plane, which correspond to different clinical states. From this observation, it would then be possible to define an “alarm area” in the factorial plane, which will warn the physician when a patient’s trajectory enters this area (i.e. when a degradation in the patient’s clinical state occurs). Subsequent patients’ data can be processed with the proposed methodology and their trajectories can be projected (as supplementary individuals) onto the factorial plane defined by the reference population. Using the telemetric function of the ID, individual follow-up in a telemedecine or/and home monitoring constitutes one of the major applications of the proposed methodology.
REFERENCES
[1] C. Sticherling, B. Schaer et al., Cardiac resynchronisation therapy in chronic heart failure, Swiss Med. Wkly., vol. 136, 2006, pp. 611-617. [2] E. Roux, A.I. Hern´andez et al., ”Multivariate Analysis of Follow-up Physiological Data Recorded by Cardiac Implantable Devices”,
Computers in Cardiology, vol. 33, 2006, pp. 765-768.
[3] R. Simon, Q. Ni et al., Comparison of impedance minute ventilation and direct measured minute ventilation in a rate adaptive pacemaker,
PACE, vol. 26(11), 2003, pp. 2127-2133.
[4] P. Loslever, S. Bouilland, Marriage of fuzzy sets and multiple cor-respondence analysis: Examples with subjective interval data and biomedical signals, Fuzzy Sets and Systems, vol. 107, 1999, pp. 255-275.
[5] F. Duchˆene, C. Garbay, V. Rialle, ”Similarity Measure for Heteroge-neous Multivariate Time-series”, in 12th European Signal Processing
Conference (EUSIPCO), 2004.
[6] T.W. Liao, Clustering of time series data - a survey, Pattern
Recogni-tion, vol. 38, 2005, pp. 1857-1874.
[7] R.M.J. Niels, L.G. Vuurpijl, ”Using Dynamic Time Warping for Intu-itive Handwriting Recognition”, in 12th Conference of the Internatonal
Graphonomics Society (IGS2005), 2005, pp. 217-221.
−1.5 −1 −0.5 0 0.5 1 1.5 −1.2 −1 −0.8 −0.6 −0.4 −0.2 0 0.2 0.4 0.6
1stfactorial axis (65.79% of the variance)
2 n d fact o ri al ax is (1 4 .7 9 % o f th e v ari an ce) (a) Cluster 1 −1.5 −1 −0.5 0 0.5 1 1.5 −1.2 −1 −0.8 −0.6 −0.4 −0.2 0 0.2 0.4 0.6
1stfactorial axis (65.79% of the variance)
2 n d fact o ri al ax is (1 4 .7 9 % o f th e v ari an ce) (b) Cluster 2 −1.5 −1 −0.5 0 0.5 1 1.5 −1.2 −1 −0.8 −0.6 −0.4 −0.2 0 0.2 0.4 0.6
1stfactorial axis (65.79% of the variance)
2 n d fact o ri al ax is (1 4 .7 9 % o f th e v ari an ce) (c) Cluster 3
Fig. 4. Three clusters are determined by the proposed methodology. For each cluster, analysis individuals (in gray) and individuals of the given cluster (in black) represented in the first plane of the SMCA. A patient is represented by one to three trajectories that link the statistical individuals related to each of his three-month length periods. The first point in time for each trajectory is marked up by a circle.