HAL Id: hal-00461130
https://hal.archives-ouvertes.fr/hal-00461130v2
Submitted on 14 Sep 2010HAL is a multi-disciplinary open access archive for the deposit and dissemination of sci-entific research documents, whether they are pub-lished or not. The documents may come from teaching and research institutions in France or abroad, or from public or private research centers.
L’archive ouverte pluridisciplinaire HAL, est destinée au dépôt et à la diffusion de documents scientifiques de niveau recherche, publiés ou non, émanant des établissements d’enseignement et de recherche français ou étrangers, des laboratoires publics ou privés.
Breakdown of cell-collagen networks through collagen
remodeling
Andreea Iordan, Alain Duperray, Anaïs Gérard, Alexei Grichine, Claude
Verdier
To cite this version:
Andreea Iordan, Alain Duperray, Anaïs Gérard, Alexei Grichine, Claude Verdier. Breakdown of cell-collagen networks through cell-collagen remodeling. Biorheology, IOS Press, 2010, 47 (5-6), pp.277-295. �10.3233/BIR-2010-0575�. �hal-00461130v2�
Cell-collagen networks breakdown by collagen
remodelling
Andreea Iordan a,#, Alain Duperray b,c, Anaïs Gérard b,c, Alexeï Grichine b,c, Claude Verdier a,*
a. Laboratoire de Spectrométrie Physique, CNRS-Université Grenoble I (UMR 5588) 140 avenue de la physique, BP 87, 38402 Saint-Martin d’Hères cedex, France
b. INSERM, U823, Grenoble, France
c. Université Joseph Fourier-Grenoble I, Faculté de Médecine
Institut d’oncologie/développement Albert Bonniot et Institut Français du Sang, UMR-S823, Grenoble, France
Abstract
Collagen model tissues are analyzed, which consist of cells embedded in a collagen matrix at different concentrations (of cells and collagen). Rheological properties are measured and complementary confocal microscopy analyses are carried out. An important feature is observed, corresponding to the breakdown of the collagen network (i.e. decrease in network elasticity) for high collagen concentrations, due to the presence of cells. Thanks to confocal microscopy, we show that cells elongate within the gel and can remodel it, this being a concentration-dependent feature. A careful analysis of the remodelling process shows that cells can attract collagen in their close neighborhood, this being an irreversible process, and that migrating cells create collagen-depleted regions behind them.
Key words: tissue; collagen; rheology; confocal; reflectance; remodelling
#
On leave from Horia Hulubei National Institute for Physics and Nuclear Engineering (IFIN-HH), 407 Atomistilor, Magurele - Bucharest, 077125, Romania
*
Corresponding author. Tel: +33 4 76 63 59 80; fax: +33 4 76 63 54 95. E-mail address: verdier@ujf-grenoble.fr (C. Verdier).
1. Introduction
The rheology of biological systems is of major importance for bioengineering and materials
research; it has been a source of interest for many years [21], for it concerns a wide variety of
human tissues, such as muscles, arteries, connective tissues, but also new biomaterials like scaffolds to be used for restoration medicine, wound healing, and various therapies. The rheological properties of such tissues cover a wide range, going from simple elastic materials,
to fluid-like ones, but in the majority of tissues, linear and nonlinear viscoelastic effects [45]
as well as viscoplastic effects (gel-like) seem to be ubiquitous [49]. The essence of these
properties rely on the fact that cells live in a fluid material filled with fibers (i.e. collagen, and other matrix proteins), which give rise to both viscous and elastic properties. It is the complex
interplay between cell deformation, fiber reorganization, and fluid flow [37] which leads to
the understanding of such viscoelastic properties and to possible modelling [41,54,55].
In order to understand the complexity of such materials, model systems are commonly studied including basic solutions with components of the extra cellular matrix (ECM) which are collagen, laminin, elastin, fibronectin, etc. or other biopolymer gels present within cells, such
as actin [4,56], tubulin, fibrin [26] which are basic cell elements. The rheological properties of
such systems depend on mechanical and chemical properties of the polymer network, on the ability of components to assemble and persist, and can therefore exhibit either uncrosslinked polymer features or rheological properties as in crosslinked gels, in particular different
crosslinks (e.g. α-actinin, myosin II) holding the network together are shown to lead to a rich
variety of such properties.
Commonly used techniques for studying biological gels range from microrheology devices
(Optical tweezers [11], magnetocytometry [32], AFM [7], etc.) to conventional rheometry,
relaxation tests [18,35] or cycle tests [51] are commonly used, dynamic tests – in a range of
angular frequencies ω - are the most versatile. Frequency-dependent viscoelastic properties
(G’ and G”) have been obtained previously for F-actin solutions [43] and scaling laws for the
elastic modulus G’ vs. concentration were found for various filamentous biopolymer networks
[25], using oscillatory shearing. For example, several researchers studied the rheology of
Type I collagen [29,30,48] or modified collagen [19] and found similarities with other
semi-flexible polymer networks. This motivated attempts to account for such rheology using
models based on polymer networks theories [31,44,45,55]; indeed the arrangement of long
protein filaments into networks of different geometries can be applied to such materials. Going towards a more sophisticated model tissue implies to embed cells into the protein
network and requires particular techniques (control of temperature, percentage CO2, pH, etc.).
Under such proper conditions, it is found that unlike classical fillers (or particles) in composite materials, cells play an active role by interacting with the extra cellular matrix (or
fibrillar network), leading to growth/shrinking, reorganization or proteolytic activity [10]. For
example, chicken embryo fibroblasts were found to give rise to an additional contribution to
the stress in fibroblast-populated collagen matrices [50]. Therefore, the stiffness of the
extracellular matrix can profoundly influence cell and tissue behaviors, and conversely. Another example is the microrheometric (magnetic bead-twisting) assay used to measure
changes of a cell-collagen network [33]. The authors found that cells elongate within the
matrix and change the local micromechanical properties of type I collagen gel, in a cytokine-dependent manner. In this respect, the ECM is a rich signalling medium, where both biochemical and mechanical properties can rule physiological and pathological processes
[46]. Therefore the ECM mechanical properties can be tuned for proper functions, thus
strongly influencing the behavior of cells [14,15]. As a particular example, cellular
To characterize a cellular network, one needs to measure the rheological properties, and relate these mechanical behaviors with respect to microstructure changes, using relevant techniques.
The most classical ones used are SEM (Scanning electron microscopy) [1] or conventional
biology tools such as histology [22,23] which require special preparations, meaning possible
artefacts. Therefore such techniques are nowadays replaced by confocal microscopy
(including laser reflectance for visualizing collagen fibers in the matrix) [6,16,20,24] leading
to amazing observations of the scaffolds microstructure [34]. These observations have
recently been coupled with micromechanical tools to analyze the stress effects on collagen
microstructure [47].
Previous studies concern different cell types [17,27,53], but most of them usually focus on
fibroblasts - which are major repair cells - embedded within 3D scaffolds containing matrix
proteins [3,5,10,16,35,36,51]. Such model networks have been used to understand the
migration/deformation of fibroblasts and the remodelling/compacting effect they can have on
the ECM [12,16,17]. Collagen gels were used extensively with fibroblasts for studying the
cell-matrix mechanical interactions. However, no results about the overall viscoelastic properties of such model networks using both conventional rheology and confocal microscopy have been carried out on systems with various concentrations.
Therefore, in this study, we propose to develop a 3D model network that mimics a normal tissue (e.g. connective tissue) and study its viscoelastic properties using both dynamic rheometry and confocal reflectance microscopy. To undertake such investigations, we used a collagen network at various concentrations, filled with different amounts of CHO cells (Chinese Hamster Ovary cells). It was then possible to investigate the behavior of cells in different micro-environments. Materials and methods are described in §2, whereas the model networks viscoelastic properties are investigated in §3. At the same time, we used complementary confocal scanning microscopy (combined reflectance and fluorescence) to
investigate cell shape and cell-matrix interactions. The remodelling process was studied, by measuring collagen densities in the close neighborhood of cells. In §4, we propose to combine these results and show how interactions between cells and the collagen matrix can compete and give rise to complex behaviors because of this remodelling process. Finally, conclusions are presented in §5.
2. Materials and methods
2.1 Cells, collagen, and gels
We used a CHO cell line (Chinese Hamster Ovary) - an established line of fibroblasts -
previously investigated by the authors, as a suspension at high concentrations [24]. CHO cells
were grown in culture medium (DMEM containing 10% Fetal Calf Serum) using standard
T75 flasks under proper conditions (37°C, 5% CO2) in a cell incubator, until they reached
70% confluence. Cells were then detached with trypsin, and suspensions at different concentrations were prepared using CHO cells and culture medium. Cell concentration was determined using a Neubauer’s cell chamber, then the required concentration was adjusted. Collagen (type I) was prepared from a rat tail collagen solution (BD Biosciences) and was mixed with culture medium. Then neutralization was carried out using NaOH (0.1M) to reach a pH of 7.4 while maintaining the temperature at 4°C. After adding cells, the system was transferred onto the rheometer at 37°C. Collagen polymerization usually takes 30 mn. Overall, the time between preparation of the gel and the beginning of the rheology experiment (including setting of the control parameters) was one hour.
Two kinds of tissues/networks were prepared in order to investigate collagen networks alone as well as cell-populated collagen matrices :
b) Collagen gels including cells at different cell concentration. Three different cell
concentrations were used: 0.7 107 cells/mL, 1.17 107 cells/mL and 1.8 107 cells/mL. These
concentrations correspond to cell volume concentrations of 4.7%, 7.8%, 12% respectively, and were adjusted so that collagen concentrations remained the same as in a).
2.2 Rheology
Rheometrical measurements of the networks were conducted with a Bohlin Rheometer (Malvern, Gemini 150, controlled stress). The temperature was kept at 37° C (peltier system, +/- 0.1°C) which allows for collagen polymerization as stated above, and throughout the experiments. A closed chamber saturated with water was placed around the sample in order to avoid evaporation. Dynamic oscillations were performed, i.e. the sinusoidal strain
γ = γ0sin(ωt) was measured corresponding to the applied shear stress τ=τ0 sin(ωt+φ), where
ω is the angular frequency, and t is time. γ0 and τ0 are respectively the amplitude of the
deformation and the amplitude of the stress. Therefore, dynamic moduli (G’,G”) can be
obtained at different frequencies f (where ω=2πf) in the range [0.01-2Hz] by selecting the
in-phase elastic deformation (G’) and its out of in-phase viscous counterpart (G”):
G’=τ0 cosφ/γ0 and G”=τ0 sinφ/γ0. The viscoelastic properties (G’, G”) of our materials were
measured using parallel plate geometry (20mm diameter) and a gap ranging between 500µm-800µm, since samples are of limited volumes. This is similar to the geometry previously used with CHO cell suspensions [24]. Experiments were started after gel polymerization and rheometer setup (see §2.1), which means that one hour had elapsed. The gels have a linear
domain at moderate deformationsγ0, therefore collagen samples were tested under low strains
(γ0 =0.01) within the linear domain, in agreement with previous work [3], and similarly for
0.1 1 10 100 1000 0.01 0.1 1 G' (0.42 mg/mL) G" (0.42 mg/mL) G' (0.95 mg/mL) G" (0.95 mg/mL) G' (1.38 mg/mL) G" (1.38 mg/mL) G'(1.8) G" (1.8 mg/mL)
G', G" (Pa)
f(Hz)
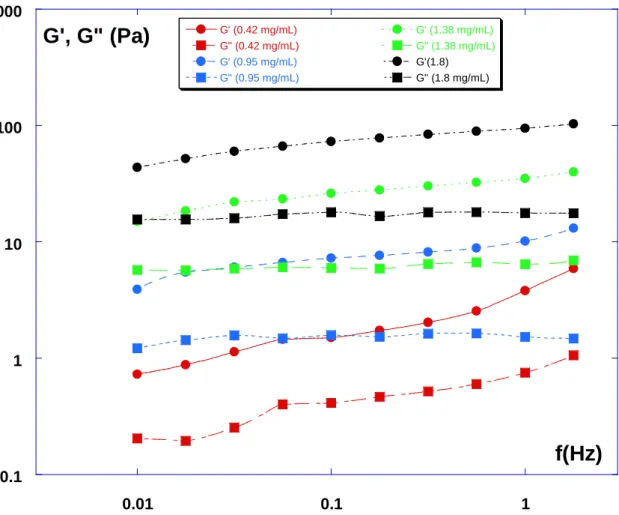
Fig. 1: Rheometrical data (G’,G”) for the four collagen gels considered (0.42-0.95-1.38-1.8
mg/mL).
Gels typically exhibit a flat plateau for G’(f) – or slowly increasing G’(f) - and a smaller G”(f)
modulus (see Fig. 1), with G”(f) also slowly increasing. This is the signature of a viscoelastic
behavior. In what follows, we chose to show only the dependence of G’ vs. frequency f, for this is the most significant modulus, and also in order to have a limited number of curves in each graph for clarity. In most cases, the G” modulus just followed a very similar trend as compared to G’, and was lower by half a decade (factor of 3 roughly).
2.3 Confocal Microscopy
To characterize structural changes in our model tissues, confocal microscopy was used in addition to rheometry. The idea was to analyze cell shapes as well as their behavior within the
collagen network, and compare with the rheological data. The collagen matrix organization could also be analyzed. Birefringence is indeed an intrinsic optical property of many natural
ordered biopolymers, including collagen fibers [6,28]. The collagen-induced depolarisation of
the linearly polarized incident light allows the imaging of nascent 3D fibers in amorphous medium with high signal-to-noise ratio in confocal reflection mode. Confocal reflection microscopy and fluorescence were proposed earlier as powerful coupled tools to study 3D cell
migration [20], and were used here to examine the organization of cells within the matrix.
When combined with confocal microscopy, reflection images taken at sequential focal planes along the z axis can be reconstructed in 3D for visualization and for image analysis. For an easy visualization of cells inside collagen gels, we have developed a stable CHO transfected cell line expressing GFP. Therefore reflected light from the collagen matrix was collected simultaneously with fluorescence from cells in a time-lapse mode to monitor the dynamic process of cell behavior through the 3D collagen matrix. In order to do so, collagen gels with and without cells were polymerized in a Lab-Tek chamber with coverglass and imaged using a confocal microscope (inverted Zeiss Axiovert 135M, LSM 510 model). The method was performed to visualize matrix fibers and cells using a 40X objective lens (Zeiss, C-Apochromat, water immersion). During the experiments, samples were placed in a
temperature and CO2 controlled on-stage incubator (37°C, 5% CO2). Two lasers were coupled
to the microscope: an Argon laser at 488 nm was used to visualize the GFP-labeled cells and a HeNe laser at 633 nm to visualize collagen structures.
2.4 Image processing
In order to get more precise data on cell morphology, an image processing method was used. Cells from confocal images (z-stack) were first extracted and subdivided into many
software (kindly provided by Yves Usson, TIMC-IMAG, Grenoble). The analysis and 3D visualisation software were written in standard C language using the GL library (Silicon Graphics library) and the FORMS user interface library (courtesy of Marck Overmars,
Department of Computer Science, Utrecht University, The Netherlands) [39,40,52]. The
software gives the 3D-shape of the cell, its volume including the nucleus, as well as other relevant parameters (surface, major and minor axes, etc.). From this data, the cell elongation was calculated by fitting an ellipsoid around the cell and choosing the elongation (e=M/m) to
be the ratio between major and minor axes (M and m respectively, see for example Fig.
8a-8b).
Finally, determination of the collagen densities in Fig. 10-11-12 were made thanks to
the software VolocityTM (PerkinElmer Inc). Various boxes (parallelepipedic ones, cubes, or
isoparametric volumes) were chosen at specific locations, and the ratio between collagen volume and box volume gave the collagen density (considered as arbitrary units).
3. Results
3.1. Rheology
The collagen solutions were tested first. The frequency dependence of G’ and G” at 1% deformation was measured for frequencies f ranging from 0.01 to 2 Hz at 37°C. The elastic modulus was always larger than the loss modulus. Both moduli increase very slowly with f
and are almost parallel (see Fig. 1), a result quite similar to a previous one [19,29] obtained
for collagen gels (2mg/mL) in oscillatory shear at a constant strain of 1%. The order of
magnitude of the plateau modulus G0 (i.e. the value for which G’ is constant or has an
inflexion point, here the value at 0.1 Hz was used) at a collagen concentration of 1.8mg/mL is
of the order of 75 Pa, in good agreement with previously reported values [19,33,48,55]. The
moduli with collagen concentration. This can be seen in Fig. 1 and alsoas part of the data in
Fig. 2 where the evolution of the elastic modulus G’ is presented vs. frequency at four
different concentrations (and three cell concentrations).
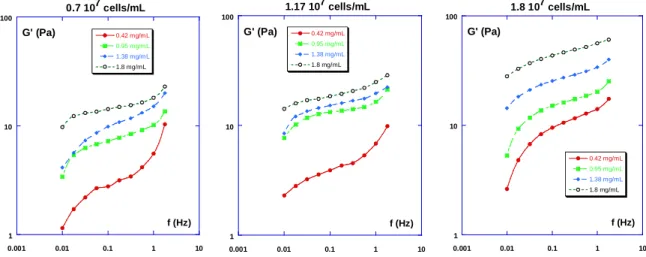
0.1 1 10 100 0.001 0.01 0.1 1 10 0 cells/mL 0.7 107cells/mL 1.17 107cells/mL 1.8 107cells/mL G' (Pa) f (Hz) Collagen = 0.42 mg/mL 0.1 1 10 100 0.001 0.01 0.1 1 10 0 cells/mL 0.7 107cells/mL 1.17 107cells/mL 1.8 107cells/mL f (Hz) G' (Pa) Collagen = 0.95 mg/mL 0.1 1 10 100 0.001 0.01 0.1 1 10 0 cells/mL 0.7 107cells/mL 1.17 107cells/mL 1.8 107cells/mL Collagen = 1.38 mg/mL f (Hz) G' (Pa) 0.1 1 10 100 0.001 0.01 0.1 1 10 0 cells/mL 0.7 107cells/mL 1.17 107cells/mL 1.8 107cells/mL Collagen = 1.8 mg/mL G' (Pa) f (Hz)
Fig. 2: Elastic modulus G’(f) as a function of frequency f at four fixed collagen
concentrations (0.42-0.95-1.38-1.8 mg/mL) using different cell concentrations: 0-0.7x10⁷
The cells-filled collagen networks were characterized next. Measurements of storage and loss modulus G’(f) and G”(f) were respectively carried out in the frequency range 0.01 Hz < f < 2
Hz at three cell concentrations (0.7 107, 1.17 107, 1.8 107 cells/mL) for each collagen network.
The results are also shown in Fig. 2. We observe that for both situations, with cells and in the
absence of cells, the viscoelastic moduli always increase with collagen concentration, when matrices with the same cell concentration are tested.
An interesting feature is found when solutions with different cell concentrations are analyzed,
as can be seen in Fig. 2.
- At small collagen concentration (c ≤ 0.95 mg/mL), the collagen elastic modulus G’ is lower
than the cell-collagen networks modulus. As more cells are included (from 0.7 107 cells/mL to
1.8 107 cells/mL), the elasticity of the network increases further.
- On the other hand, at higher collagen concentrations (c ≥ 1.38 mg/mL), the collagen elastic
modulus G’ is reduced when cells are included into the network. This is shown by the
dramatic decrease of the elastic modulus G’ when 0.7 107 cells/mL are included within the
matrix. When more cells are added (i.e. 1.38 107 cells/mL and 1.8 107 cells/mL), the network
elasticity increases again and can reach its initial level (c=1.38 mg/mL) or higher (c=1.8 mg/mL). This feature therefore seems to be a concentration-dependent phenomenon and will be discussed in the next part.
In Fig. 3, we present the evolution of the elastic modulus G’ at fixed cell densities, when
varying the collagen concentration. G’ increases with frequency f as usual, and always increases with collagen density.
Since the frequency dependence (slow increase of G’) is in agreement with previous works,
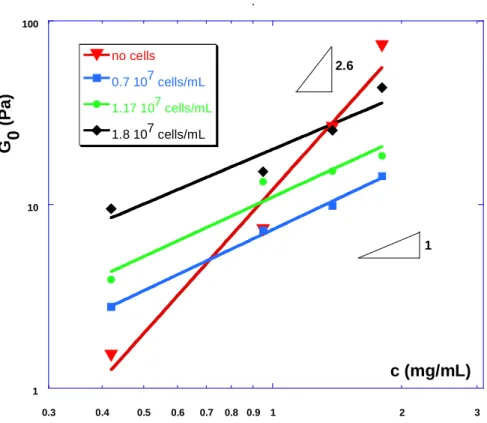
we clarify this analysis further by representing G’ (more precisely its value G0 at f=0.1 Hz) as
a function of concentration, in the 16 different cases studied. This is shown in Fig. 4 using a
exponent of the power law model. Experimental data from other works have indeed shown the
concentration dependence of the plateau shear modulus to vary like c2.2 in the case of actin
gels, c2.1 for fibrin networks [25], and c3 for collagen networks [47]. Our data gives a
dependence G’≈ c2.6, in excellent agreement with previously reported data.
1 10 100 0.001 0.01 0.1 1 10 0.42 mg/mL 0.95 mg/mL 1.38 mg/mL 1.8 mg/mL G' (Pa) 0.7 107 cells/mL f (Hz) 1 10 100 0.001 0.01 0.1 1 10 0.42 mg/mL 0.95 mg/mL 1.38 mg/mL 1.8 mg/mL 1.17 107 cells/mL G' (Pa) f (Hz) 1 10 100 0.001 0.01 0.1 1 10 0.42 mg/mL 0.95 mg/mL 1.38 mg/mL 1.8 mg/mL 1.8 107 cells/mL G' (Pa) f (Hz)
Fig. 3: Elastic modulus G’(f) as a function of frequency f at four fixed cell concentrations
(0-0.7x10⁷-1.17x10⁷-1.8x10⁷ cells/mL) using different collagen concentrations :
0.42-0.95-1.38-1.8 mg/mL (same as Fig. 2 but shown in a different way).
The presence of cells embedded into the matrix shows a different dependence vs. collagen
concentration (Fig. 4), leading to a smaller slope of order 1 (more precisely the slopes of the
fits are respectively 1.11,1.08 and 0.99 for cell concentrations respectively 0.7-1.17-1.8 107
cells/mL) at the three cell concentrations studied. Again the dramatic effect of cells embedded in the network is outlined by the crossover of the collagen curve with the cell-filled network data at c > 1.38 mg/mL.
To understand this cell effect, it seemed important to study the microstructure of the matrices, including the way cells organize within the gels, in particular through interactions with the filaments. This was possible thanks to complementary confocal microscopy data which is presented next.
1 10 100 0.3 0.4 0.5 0.6 0.7 0.8 0.9 1 2 3 slopes0.1Hz no cells 0.7 107 cells/mL 1.17 107 cells/mL 1.8 107 cells/mL G 0 ( P a ) c (mg/mL) 1 2.6
Fig. 4: Concentration dependence of the shear elastic modulus G0 (0.1 Hz) vs collagen
concentration (log-log scale) with and without cells. The fits indicate power law with respective exponents 2.6 for collagen gels alone and 1.11-1.08-0.99 for cell concentrations
0.7x10⁷-1.17x10⁷-1.8x10⁷ cells/mL.
3.2 Confocal Microscopy
3.2.1 Cells within the collagen matrix
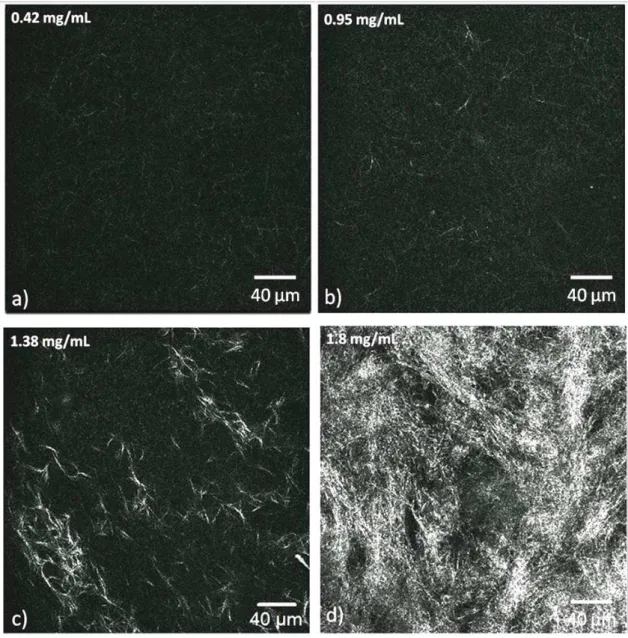
To understand first how the matrices behave, collagen gels with the same concentrations as above (0.42-0.95-1.38-1.8 mg/mL) were prepared and analyzed using confocal reflectance microscopy. The images were taken 120 µm deep into the sample and revealed the presence of the collagen fibers. A simple visual inspection suggested that the matrices present an increase in fiber density (or decrease in mesh size) with increasing collagen concentration, as
expected [28]. Fig. 5 display this clear effect and the analysis of global pixel intensity versus
concentration revealed a monotonous increase (data not shown), confirming the validity of our data.
Fig. 5: Confocal reflectance images at four collagen concentrations demonstrate the architectural differences between matrices prepared from type I collagen. Bar = 40 µm for all
images. (a) 0.42 mg/mL (b) 0.95 mg/mL (c) 1.38 mg/mL (d) 1.8 mg/mL.
The mechanical impact of the cells on their microenvironment (i.e. collagen fibers) was
investigated next. Cells (1.8 107 cells/mL, i.e. 12% volume concentration) were embedded
within gels (see Materials and Methods) with collagen concentrations ranging from 0.42
Fig. 6: Confocal reflectance and fluorescence microscopy for collagen gels with cells; (magnification 40x, 1µm z-slice, xy: 358 x 358µm, Zoom 0.7). (a) 0.42 mg/mL (b) 0.95
mg/mL (c) 1.38 mg/mL (d) 1.8 mg/mL.
- It seems obvious that the elongation of the cells (around 3 and 3.5) in Fig. 6a at low
concentration is important. Cells adhere easily and show long protrusions. Such cells seem to deform the collagen fibers in their close neighborhood and probably also pull collagen towards them, i.e. they remodel it.
- On the other hand, cells seem to be less elongated (aspect ratio or elongation slightly higher
than 1) in the next two Fig. 6b-6c. Stiffer matrices seem to lead to round cells because they
might be affected by a lack of space. Still cells are able to make short protrusions.
Fig. 7: Confocal reflectance and fluorescence microscopy for collagen gels with cells; (magnification 40x, 1µm z-slice, xy: 76.8 x 76.8 µm, Zoom X3). (a) 0.42 mg/mL (b) 0.95
mg/mL (c) 1.38 mg/mL (d) 1.8 mg/mL.
- Finally, at large collagen concentration (Fig. 6d) cells seem to be stuck within the
concentrated collagen. They keep a round shape (aspect ratio or elongation close to 1) similar
regions filled with fluid (i.e. culture medium) appear and maybe due to the interplay between cell tractions/remodelling and fluid pressure.
To quantify these observations we analyzed image stacks by selecting magnified single cells (zoom X3) embedded into collagen gels at the different concentrations (0.42-0.95-1.38-1.8
mg/mL). Fig. 7a confirms that, in a less concentrated collagen gel, cells present a large
deformation/elongation, in contrast with higher collagen concentrations where cells keep their
almost round shape with very small protrusions (Fig. 7b-7c-7d) corresponding to an amoeboid
motion. In addition, Fig. 7d shows a high density of fibers around the cell in agreement with
the fact that cells play an attractive remodelling role of the collagen. To quantify these effects more precisely, an image processing method was used. Cells were isolated from the images (see Materials and Methods) and their global parameters (positions, surface, volume, etc.) were calculated. We focused on their elongation which seems to be a relevant parameter here.
Fig. 8a shows typical projected shapes of the most elongated cells found for the small
collagen density (0.42mg/mL). Collecting results for a sufficient number of cells in different collagen matrices (18-16-19-16 for collagen concentration of 0.42-0.95-1.38-1.8 mg/mL
respectively) leads to the chart in Fig. 8b where the number of cells vs. elongation is shown
for the four collagen concentrations. Finally the data is collected in Fig. 9 where cell
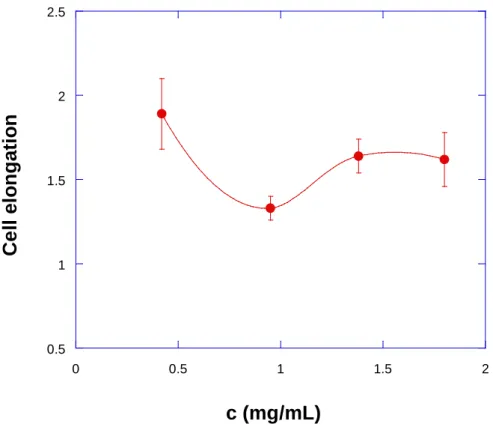
elongation is represented against collagen concentration. It appears that the cell elongation has a mean value around 2 at 0.42 mg/mL, then decreases down to 1.2 at 0.95 mg/mL then it increases slightly again to reach a plateau of 1.5 at the higher concentrations (1.38 or 1.8 mg/mL). Probably the explanation of such a complex shape for this curve needs to be understood based on the competition between different effects. This will be discussed in the next part.
(a) (b) 0 1 2 3 4 5 6 7 8 0 0.4 0.8 1.2 1.6 2 2.4 2.8 3.2 3.6 4 4.4 4.8 0.42 mg/mL N u m b e r Cell elongation 0 1 2 3 4 5 6 7 8 0 0.4 0.8 1.2 1.6 2 2.4 2.8 3.2 3.6 4 4.4 4.8 0.95 mg/mL N u m b e r Cell elongation 0 1 2 3 4 5 6 7 8 0 0.4 0.8 1.2 1.6 2 2.4 2.8 3.2 3.6 4 4.4 4.8 1.38 mg/mL N u m b e r Cell elongation 0 1 2 3 4 5 6 7 8 0 0.4 0.8 1.2 1.6 2 2.4 2.8 3.2 3.6 4 4.4 4.8 1.8 mg/mL N u m b e r Cell elongation
Fig. 8: (a) Examples of increasingly elongated cells in a low density collagen gel (0.42 mg/mL) obtained by surface projection using Edit3D. (b) Histograms showing cell elongation
0.5 1 1.5 2 2.5 0 0.5 1 1.5 2
C
e
ll
e
lo
n
g
a
ti
o
n
c (mg/mL)
Fig. 9: Cells elongation vs. collagen concentration.Error bars are standard errors of the mean
3.2.2 Detailed analysis of the remodelling process
We next consider a more careful analysis of the remodelling process, i.e. the way cells migrate through the collagen matrix and how they remodel the latter one. This was done using
the Volocity softwareTM (see §2.4). Volumes can be selected and the sum of the intensities of
the reflected light gives a measure of the collagen density, when referred to the global volume of the selected region. We have chosen to plot the data using arbitrary units (a.u.) and simple comparisons will be made here.
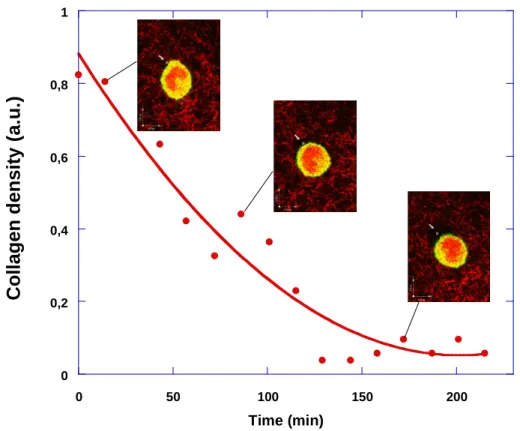
In a first experiment, we select one cell which is in motion. A small region of collagen (Fig. 10) located on the top left of the figure (see arrow) is followed in time. The collagen
density measured in this region decreases as a function of time. Even after one hour, the density is reduced by a factor of two. Thus remodelling is quite fast. The overall effect is studied over 4 hours and the collagen density eventually goes down close to zero, thus
showing that cells leave empty spaces behind them, i.e. spaces filled with fluid alone (or collagen-free). This is the first effect.
0 0,2 0,4 0,6 0,8 1 0 50 100 150 200
C
o
ll
a
g
e
n
d
e
n
s
it
y
(
a
.u
.)
Time (min)Fig. 10: Evolution of collagen density in a fixed volume (white cube on the top left of the
cell, indicated by the arrow), as a CHO cell migrates away from it : the collagen density clearly decreases during cell motion, thus the cell removes some collagen from this region.
This effect is analyzed over a time period of 4 hours. Even after one hour, the density is decreased by a factor of 2 (from 0.8 to 0.4 in a.u.). Photographs are taken at times indicated on the graph. A large hole is left after passage of the cell. This is one way to remodel the gel.
To investigate such behaviors more closely, the collagen density was measured in the neighborhood of a CHO cell: different parallelepipedic boxes were chosen, located few
microns away from each other (see Fig. 11). As a comparison, the average collagen density
was measured in a similar box located nearby, with no cell present. The collagen density increases as one moves closer to the cell, in particular very close to it (1µm away): this is
where it has a maximum, as shown in Fig. 11. As one moves away, the density is reduced
quite rapidly, for example it is reduced by a factor of two only 7 µm away (from 0.8 to 0.4 a.u.). At this distance, it becomes already close to the value of the collagen density as
measured in a nearby region (distant by two cell diameters). In this nearby region, its value is a fluctuating one (around 0.2 a.u.), in good comparison with the overall collagen density (0.19) measured for the whole gel (0.9 mg/mL in this case).
0 0,2 0,4 0,6 0,8 1 0 2 4 6 8 10 With cell Without cell Average density
Distance (µm)
C
o
ll
a
g
e
n
d
e
n
s
it
y
(
a
.u
.)
Fig. 11: Collagen density (a.u.) measured in parallelepipedic regions close to a cell and in a region with collagen alone (see insert showing the positions of two such regions, collagen is not shown for clarity). Regions are moved away from the cell or throughout the gel (case with
no cell). The arrow also indicates the direction of migration of the cell. The average collagen density is also indicated to be around 0.19 (a.u.) corresponding to 0.9 mg/mL. Collagen
density decreases when moving away from the cell, as opposed to the almost constant collagen density measured in the region with collagen alone. Thus the closer to the cell, the
higher the collagen density: cells accumulate collagen around them.
This shows that the collagen density is larger the closer to the cell, thus cells have the ability
to compact collagen around them. This was also shown in Fig. 6a, where collagen fibers are
Finally, the evolution of the collagen density was measured within isoparametric volumes (1µm in thickness) with a shape that resembles that of a cell, i.e. the volume was drawn
around the cell at a given distance from the cell edge, as shown in the insert of Fig. 12. The
density of collagen, as measured with VolocityTM, again shows that the collagen density
decreases as one moves away from the cell. Three measurements were made at three different times t=0, t=82 min, and t=137 mn. The collagen density increases close to the cell; this shows again the ability of cells to attract collagen fibers. These effects will be further discussed in the next part (§4).
0,4 0,5 0,6 0,7 0,8 0,9 1 0 1 2 3 4 5 6 7 8 t=0 t=82 min t=137 min
C
o
ll
a
g
e
n
d
e
n
s
it
y
(
a
.u
.)
Distance (µm)
Fig. 12: Evolution of the collagen density in the neighborhood of a cell. Isodistance volumes (1µm in thickness) have been used around a cell (see an example in insert) and the corresponding volume of embedded collagen fibers was measured within volumes spaced by
1µm. Measurements are made at times t=0, 82 min, and 137 min. The volume occupied by collagen (i.e. collagen density) always increases with time around the cell and is higher closer
to the cell. This shows the ability of cells to attract collagen fibers irreversibly. This is the second way to remodel the gel.
4. Discussion
The first part of this work deals with the intrinsic properties of collagen gels. Such properties result from the interactions between two components: a network of collagen fibrils and an interstitial fluid, i.e. the culture medium. When mechanical stress is applied, the network and the medium deform together and the resistance to the interstitial flow of the solution through the network can lead to high pressure, which allows the gel to withstand compressive loads
[29]. In shear, the resistance is quite important and the elastic moduli G0 can reach rather large
values, in agreement with previous works [19,29]. The ability of the network to resist such
stresses is due to its particular dense crosslinked microstructure as exhibited in Fig. 5. Our
data for collagen gels is also comparable (Fig. 1-2) with the results obtained in laser trap
microrheology [48] where the authors obtained an increasing shear modulus G with c, the
collagen concentration. The data obtained for G’(0.1 Hz) vs. c exhibits a typical slope of 2.6
(see Fig. 4), in agreement with previous works on actin and collagen networks [25,47].
In the second part of this work, cells are embedded into the gel. It is shown, for the first time, using rheological measurements, that the matrix elasticity is globally reduced by a rather large
amount at high values of c, this effect being due to the presence of cells (see Fig. 2-3-4). This
effect, although surprising, might be due to the ability of cells to remodel the matrix, as
fibroblasts were earlier shown to condense a tissue into a fibrillar structure [5], i.e. to compact
it [16,17] or further colonize it [22,23]. Other living cells (like bacteria) can also modify the
viscoelasticity of certain gels [8]. This effect has been considered by Leung and co-workers
using a different technique [33] using bead twisting microrheology to investigate the effect of
fibroblasts in a collagen matrix. The results are similar : local elasticity of the collagen matrix
is higher without cells, and decreases when cells are embedded in the matrix (25K, 50K and 100K cells/mL, less than what was used in the present study). The authors also checked this
effect except for very long durations (larger than 7 days). We restrict here the analysis to short term behavior (<24h) because it is known that other mechanisms may take place at longer times, for example the expression of collagenase (MMP1) and gelatinase A (MMP2) leading
to matrix degradation/hydrolysis [22]. Finally the modulus reduction observed at short times
[33] is in agreement with our experiments.
The nonlinear effect with cell concentration found in Fig. 4 was also observed by Evans and
Barocas [16]: their data shows a decrease of the Young Modulus (E) at small cell
concentration, then an increase at higher cell concentration (c=3 mg/mL). At lower values of c (1-2 mg/mL), E always increases as in our case. These nonlinearities maybe due to the
nonlinear properties of collagen [17], but are also due to the presence of cells, as will be
discussed next. Another observed effect was the slope change of G0 vs. collagen concentration
c (Fig. 4). This slope changes drastically from a value of 2.6 to a value of 1 when cells are
embedded into the gel. This effect further enhances the fact that cells play a definitive role on the organization of collagen fibers.
Let us now discuss these effects in view of the confocal microscopy analysis. The collagen
networks appeared with a finer mesh as the concentration c increases, as expected (Fig. 5).
Regarding cell-collagen networks, it was found (see Fig. 8-9) that cells behave differently
depending on the collagen matrix concentration. Low concentrations lead to more elongated
cells (Fig. 6a-7a-8a) whereas larger concentrations lead to smaller round cells (Fig. 6b-6c-6d
and Fig. 7b-7c-7d); Had the concentration been smaller, then single contacts with isolated
fibers would have been found [20], but this is not the case here. It has also been emphasized
that new regions appear in the cell-collagen matrix (Fig. 6d) where fluid-filled spaces are
present. Figure 8b and Fig. 9 quantify these effects: cell elongation (ratio of the length over
width of the corresponding cell-fitting ellipse) vs. collagen concentration seems to be a decreasing function (with a possible minimum). To explain this feature, a simple analysis is
proposed based on the existence of two competing effects leading to a miminum, a
phenomenon also observed for 2D cell migration [2,38] :
(a) Binding/adhesion to collagen is important for cells and is enhanced by the presence of collagen or mechanosensing (b) Size effects (related to collagen mesh size) affect cell shapes as cells cannot spread in too dense regions. The results are as found experimentally:
• At small concentrations, cells elongate thanks to space; they encounter a few fibers only,
that they attract (Fig. 6a).
• At large concentrations, cells remain small because of the lack of space and do not elongate
so much, because they have enough fibers around them to bind.
Most important is the effect that cells can play on the microstructure of the network, and the
tensions they can generate (Fig. 6-7), which leads to remodelling of the collagen network.
This has been studied thanks to the determination of collagen densities within specific volumes chosen in the neighborhood of cells.
Figure 10 showed how a cell can move through a collagen network (0.9 mg/mL) by leaving
holes behind it. This was shown by a rapid decrease of the collagen density in a box close to where the cell passed. This phenomenon can occur within one hour and is quite fast.
In a second experiment, the collagen density was measured in a parallelepipedic box located close to a cell. This box had a fixed volume and was moved away from the cell. The resulting
collagen density (Fig. 11) was shown to decrease rapidly away from the cell, thus showing an
enhanced amount of collagen in the neighborhood of the CHO cell. This was checked with a
control volume in a nearby region (away from any cell), whose density (≈ 0.2) was found
close to the value far away from the cell (≈ 0.2, at a distance of 8µm). Finally this latter value
was found to be in agreement with the average collagen density in the whole gel (0.19) as
Finally, isovolumes (distant by 1µm each, each having a thickness of 1µm) were chosen
around a cell edge to measure collagen density (see Fig. 12). The result is again stricking: as
time goes on (during the first two hours), the collagen density increases all around the cell but even more when getting closer to the cell. This shows an irreversible attraction of collagen fibers by CHO cells. Such fibers never go back to their original positions, this corresponding to plastic deformations.
Summarizing our data, the remodelling effect is comprised of two mechanisms :
(1) the first one shows that some cells migrate through gels and leave tunnels “behind them”; (2) the second one is due to the attraction of collagen by cells exerting traction forces.
These new features can share some light when compared to previous works on the
compaction of gels [5,17]. It is indeed shown here that cells, either by pulling on fibers or
“drilling tunnels” through gels, can remodel it and create collagen-free regions (i.e. fluid streams). Then it becomes possible for the fluid to flow outside while the network is
contracted. This is a microscopic explanation of the proposed macroscopic effect [5,17].
Fig. 13: Sketch of the possible structure formed by cells surrounded by collagen network: Cells reorganize the initial collagen matrix (left) by attracting collagen thus depriving other regions from collagen, and creating less dense regions where fluid can flow. The rigidity of
Finally, the drastic reduction of the elastic moduli obtained previously can be explained thanks to the ability of cells to remodel the collagen network. The initial network shows
strong interacting links (Fig. 13, left, and confocal image in Fig. 5) corresponding to a rigid
gel. Then cells remodel it, this leading to a softer network composed of weakly connected
islands drained by the interstitial fluid as sketched in Fig. 13 (right) and also confirmed using
confocal microscopy (Fig. 6d) in this present work. This effect was analyzed closely thanks to
collagen density measurements in the neighborhood of cells.
5. Conclusions
In this work, we focused on the mechanical impact that CHO cells (a fibroblast type) can have on their microenvironment, i.e. a collagen network, and conversely. Bulk rheology, as well as confocal reflectance/fluorescence microscopy were used to explore the complex interplay between the different network elements.
Collagen matrices were found to exhibit viscoelastic properties with an elastic modulus following a nonlinear relation with collagen concentration in agreement with previous works. Regarding cell-filled matrices, we found that cells can affect the collagen rheology dramatically. This was shown by a strong decrease of the elastic shear modulus G’ of cell-collagen networks at the highest cell-collagen concentrations used (c > 1 mg/mL). Confocal microscopy enabled to explain this dramatic change by revealing the cell-collagen microstructure. In particular, remodelling of the network was explained by the ability of cells to attract the collagen fibers or leave “tunnels” behind them, thus leading to new microstructures and to the subsequent breakdown of the elastic modulus.
Perspectives of this work could focus on the ability of the confocal method to capture matrix
fiber heterogeneities or orientations in cell-populated collagen gels [42,47]. But they could
[36], as well as proteolytic degradation by MMPs [13] and growth [6,10] on longer time
scales [22,23]. Finally they would be ideally suited for studying cell migration in 3D collagen
matrices.
Acknowledgments
This work has been partly funded by the European Commission (EC) through a Marie Curie Research Training Network (MRTN-CT-2004-503661) entitled ‘‘Modeling, mathematical methods and computer simulation of tumor growth and therapy’’. Confocal microscopy was performed at the microscopy facility of the ‘‘Institut Albert Bonniot’’. This equipment was partly funded by ‘‘Association pour la Recherche sur le Cancer’’ (Villejuif, France) and the ‘‘Nanobio program’’. We thank Y. Usson (Institut Albert Bonniot) for his kind help with the 3D processing of confocal images.
References
[1] O. Akhouayri, M.-H. Lafage-Proust, A. Rattner, N. Laroche, A. Caillot-Augusseau, C. Alexandre
and L. Vico, Effects of Static or Dynamic Mechanical Stresses on Osteoblast Phenotype Expression in Three-Dimensional Contractile Collagen Gels, J. Cell Biochem. 76 (1999), 217-230.
[2] D. Ambrosi, A. Duperray, V. Peschetola and C. Verdier, Traction patterns of tumor cells, J. Math.
Biol. 58 (2009), 163-181.
[3] V.H. Barocas, A.G. Moon and R.T. Tranquillo, The fibroblast-populated collagen microsphere
assay of cell traction force. Part 2: Measurement of the cell traction parameter. J. Biomech. Eng. 117 (1995), 161-170.
[4] A.R. Bausch and K. Kroy, A bottom-up approach to cell mechanics, Nature Physics 2 (2006),
231-238.
[5] E. Bell, B. Ivarsson and C. Merrill, Production of a tissue-like structure by contraction of collagen
lattices by human fibroblasts of different proliferative potential in vitro, Proc. Natl. Acad. Sci. USA 76 (1979),1274-1278.
[6] A.O. Brightman, B.P. Rajwa, J.E. Sturgis, M.E. McCallister, J.P. Robinson and S.L.
Voytik-Harbin, Time-Lapse Confocal Reflection Microscopy of Collagen Fibrillogenesis and Extracellular Matrix Assembly In Vitro, Biopolymers 54 (2000), 222-234.
[7] E. Canetta, A. Leyrat, C. Verdier and A. Duperray, Measuring cell viscoelastic properties using a
force-spectrometer: Influence of protein-cytoplasm interactions, Biorheology 42 (2005), 321-333.
[8] J.P. Celli, B.S. Turner, N.H. Afdhal, S. Keates, I. Ghiran, C.P. Kelly CP et al. Helicobacter pylori
moves through mucus by reducing mucin viscoelasticity, Proc. Natl. Acad. Sci. USA 106 (2009), 14321-14326.
[9] B. Chaudhry, H. Ashton, A. Muhamed, M. Yost, S. Bull and D. Frankel, Nanoscale viscoelastic
properties of an aligned collagen scaffold. J. Mater. Sci.: Mater. Med. 20 (2009), 257-263
[10] B. Chevallay, N. Abdul-Malak and B. Herbage, Mouse fibroblasts in long-term culture within
collagen three-dimensional scaffolds: Influence of crosslinking with diphenylphosphorylazide on matrix reorganization, growth, and biosynthetic and proteolytic activities, J. Biomed. Mater. Res. 49 (2000), 448-459.
[11] J. Collet, H. Shuman, R.E. Ledger, S. Lee and J.W. Weisel, The elasticity of an individual fibrin
fiber in a clot, Proc. Natl. Acad. Sci. USA 102 (2005), 9133-9137.
[12] E. Cukierman, R. Pankov, D.R. Stevens, K.M. Yamada, Taking cell-matrix adhesions to the third
dimension, Science 294 (2001), 1708-1712.
[13] D. Dikovsky, H. Bianco-Peled, D. Seliktar, Defining the Role of Matrix Compliance and
Proteolysis in Three-Dimensional Cell Spreading and Remodeling, Biophys. J. 94 (2008) 2914-2925.
[14] D.E. Discher, P. Janmey and Y.L. Wang, Tissue cells feel and respond to the stiffness of their
substrate, Science 310 (2005), 1139-1143.
[15] A.J. Engler, S. Sen, H.L. Sweeney and D.E. Discher, Matrix elasticity directs stem cell lineage
[16] M.C. Evans and V.H. Barocas, The Modulus of Fibroblast-Populated Collagen Gels is not Determined by Final Collagen and Cell Concentration: Experiments and an Inclusion Based Model, J.
Biomech. Eng. 131 (2009) 101014.
[17] P. Fernandez and A.R. Bausch, The compaction of gels by cells: a case of collective mechanical activity, Integrative Biology 1 (2009), 252-259.
[18] G. Forgacs, R.A. Foty, Y. Shafrir and M.S. Steinberg, Viscoelastic properties of living embryonic
tissues: a quantitative study, Biophys. J. 74 (1998), 2227-2234.
[19] M.E. Francis-Sedlak, S. Uriel, J.C. Larson, H.P. Greisler, D.C. Venerus and E.M. Brey,
Characterization of type I collagen gels modified by glycation, Biomaterials 30 (2009), 1851-1856.
[20] P. Friedl, S. Borgann and E.-B. Bröcker, Amoeboid leukocyte crawling through extracellular
matrix: lessons from the Dictyostelium paradigm of cell movement, J. Leukoc. Biol. 70 (2001), 491-509.
[21] Y.C. Fung, Biomechanics. Mechanical properties of living tissues (2nd edition), Springer-Verlag,
New York-Berlin, 1993, 568 pp.
[22] C. Helary, A. Foucault-Bertaud, G. Godeau, B. Coulomb and M.M. Giraud-Guille, Fibroblast
populated dense collagen matrices: cell migration, cell density and metalloproteinases expression,
Biomaterials 26 (2005), 1533-1543.
[23] C. Helary, L. Ovtracht, B. Coulomb, G. Godeau and M.M. Giraud-Guille, Dense fibrillar collagen
matrices: A model to study myofibroblast behaviour during wound healing, Biomaterials 27 (2006), 4443-4452.
[24] A. Iordan, A. Duperray and C. Verdier, Fractal approach to the rheology of concentrated cell
suspensions, Phys. Rev. E 77 (2008), 011911.
[25] P.A. Janmey, U. Euteneuer, P. Traub and M. Schliwa, Viscoelastic properties of vimentin
compared with other filamentous biopolymer networks, J. Cell Biol. 113 (1991), 155-160.
[26] P.A. Janmey, J.P. Winer, J.W. Weisel, Fibrin gels and their clinical and bioengineering
applications. J. Royal Soc. Interface 6 (2009), 1-10.
[27] J.P. Jung, A.K. Nagaraj, E.K. Fox, J.S. Rudra, J.M. Devgun and J.H. Collier, Co-assembling
peptides as defined matrices for endothelial cells, Biomaterials 30 (2009), 2400-2410.
[28] L.J. Kaufman, C.P. Brangwynne, K.E. Kasza, E. Filippidi, V.D. Gordon, T.S. Deisboeck et al.
Glioma expansion in collagen I matrices: analyzing collagen concentration-dependent growth and motility patterns, Biophys. J. 89 (2005), 635-650.
[29] D.M. Knapp, V.H. Barocas, A.G. Moon, K. Yoo, L.R. Petzold, and R.T. Tranquillo, Rheology of
reconstituted type I collagen gel in confined compression, J. Rheol. 41 (1997), 971-993.
[30] L. Kolacna, J. Bakesova, F. Varga, E. Kostakova, L. Planka, A. Necas, D. Lukas, E. Amler and
V. Pelouch, Biochemical and biophysical aspects of collagen nanostructure in the extracellular matrix,
Physiol. Res. 56 (2007), 51-60.
[31] R.G. Larson, The structure and rheology of complex fluids. Oxford Univ Press, Oxford, 1998, 663
[32] V.M. Laurent, E. Planus, R. Fodil and D. Isabey, Mechanical assessment by magnetocytometry of the cytosolic and cortical cytoskeletal compartments in adherent epithelial cells. Biorheology, 40 (2003), 235-240.
[33] L.Y. Leung, D. Tian, C.P. Brangwynne, D.A. Weitz and D.J. Tschumperlin, A new
microrheometric approach reveals individual and cooperative roles for TGF-beta1 and IL-1beta in fibroblast-mediated stiffening of collagen gels, FASEB J. 21 (2007), 2064-2073.
[34] B.B. Mandal, S.C Kundu, Cell proliferation and migration in silk fibroin 3D scaffolds,
Biomaterials 30 (2009), 2956-2965.
[35] J.P. Marquez, G.M. Genin, K.M. Pryse and E.L. Elson, Cellular and Matrix Contributions to
Tissue Construct Stiffness Increase with Cellular Concentration, Annals Biomed. Eng. 34 (2006), 1475-1482.
[36] A.S. Meshel, Q. Wei, R.S. Adelstein and M.P. Sheetz, Basic mechanism of three dimensional
collagen fibre transport by fibroblasts, Nat. Cell Biol. 7 (2005),157-164.
[37] C.P. Ng and M.A. Swartz, Mechanisms of Interstitial Flow-Induced Remodeling of Fibroblast–
Collagen Cultures, Annals Biomed. Eng. 34 (2006), 446-454.
[38] S.P. Palecek, J.C. Loftus, M.H. Ginsberg, D.A. Lauffenburger and A.F. Horwitz, Integrin-ligand
binding properties govern cell migration speed through cell-substratum adhesiveness, Nature 385 (1997), 537-540.
[39] F. Parazza, E. Bertin, Z.M. Wozniak and Y. Usson, Analysis of the spatial distribution of AgNOR
proteins in cell nuclei using simultaneous confocal scanning laser fluorescence and transmitted light microscopy, J. Microscopy 178 (1995), 251-260.
[40] F. Parazza, C. Humbert and Y. Usson, Method for 3D volumetric analysis of intranuclear
fluorescence distribution in confocal microscopy, Comput. Med. Imaging Graph. 17 (1993), 189-200.
[41] L. Preziosi, D. Ambrosi and C. Verdier, An elasto-visco-plastic model of cell aggregates. J.
Theor. Biol. 262 (2010), 35-47.
[42] E.A. Sander, T. Stylianopoulos, R.T. Tranquillo and V.H. Barocas, Image-based multiscale
modeling predicts tissue-level and network-level fiber reorganization in stretched cell-compacted collagen gels, Proc. Natl. Acad. Sci. USA 106 (2009), 17675–17680.
[43] F.G. Schmidt, B. Hinner and E. Sackmann, Microrheometry underestimates the values of the
viscoelastic moduli in measurements on F-actin solutions compared to macrorheometry, Phys. Rev. E 61 (2000), 5646-5653.
[44] P. Sollich, Rheological constitutive equation for a model of sof glassy materials, Phys. Rev. E 58
(1998), 738-759.
[45] C. Storm, J.J. Pastore, F.C. MacKintosh, T.C. Lubensky and P.A. Janmey, Nonlinear elasticity in
biological gels, Nature 435 (2005), 191-194.
[46] J.J. Tomasek, G. Gabbiani, B. Hinz, C. Chaponnier and R.A. Brown, Myofibroblasts and
mechano-regulation of connective tissue remodelling, Nature reviews 3 (2002), 349-363.
[47] D. Vader, A. Kabla, S.C. Weitz and L. Mahadevan, Strain-Induced Alignment in Collagen Gels,
[48] D. Velegol and F. Lanni. Cell traction forces on soft biomaterials. I. Microrheology of type I collagen gels, Biophys. J. 81 (2001), 1786-1792.
[49] C. Verdier, J. Etienne, A. Duperray and L. Preziosi, Review : Rheological properties of biological
materials, C. R. Acad. Sci. Phys. 10 (2009), 790-811.
[50] T. Wakatsuki, M.S. Kolodney, G.I. Zahalak and E.L. Elson, Cell mechanics studied by a
reconstituted model tissue. Biophys. J. 79 (2000), 2353-2368.
[51] J.J. Wille, E.L. Elson, R.J. Okamoto, Cellular and Matrix Mechanics of Bioartificial Tissues
During Continuous Cyclic Stretch, Annals Biomed. Eng. 34 (2006), 1678-1690.
[52] Z.M. Wozniak, Y. Usson, F. Parazza, P. Champelovier, D. Leroux and D. Seigneurin,
Quantitative analysis of three-dimensional distribution of AgNOR proteins during interphase in leukemic cells, Cytometry 24 (1996), 14-26.
[53] H. Yuan, E.P. Ingenito and B. Suki, Dynamic properties of lung parenchyma: mechanical
contributions of fiber network and interstitial cells, J. Appl. Physiol. 83 (1997), 1420-1431.
[54] G.I. Zahalak, J.E. Wagenseil, T. Wakatsuki and E.L. Elson, A Cell-Based Constitutive Relation
for Bio-Artificial Tissues, Biophys. J. 79 (2000), 2369-2381.
[55] W. Zhu, J.C. Iatridis, V. Hlibczuk, A. Ratcliffe and V.C. Mow, Determination of
collagen-proteoglycan interactions in vitro, J. Biomech. 29 (1996), 773-783.
[56] F. Ziemann, J. Radler and E. Sackmann, Local measurements of viscoelastic moduli of entangled