Decision Making in the HIV/AIDS Supply Chain
by
Elaine Phu Cao
Bachelors of Science, Industrial Engineering Northwestern University, 2003
Submitted to the Engineering Systems Division in Partial Fulfillment of the Requirements for the Degree of
MASTER OF ENGINEERING IN LOGISTICS at the
MASSACHUSETTS INSTITUTE OF TECHNOLOGY
JUNE 2007
© Elaine Cao. All rights reserved.
The author hereby grants to MIT permission to reproduce and to distribute publicly paper and electronic copies of this thesis document in whole or in part.
Signature of Author... ...
Wf'gineering Systems Division May 11, 2007
Certified by ... ...
Edgar Blanco Research Associate, 4 eTICe4t for Transportation and Logistics Thesis Shperviset, A ccepted by ...
I/ YQ eT Sheffi
Professor, Engineering Systems Division Professor, Civil and Environmental Engineering Department Director, MIT Center for Transportation and Logistics
MASSACHUSETTS INSTITUTE OF TECHNOLOGY
JUL 3 1 2007
I
ARKERLIBRARIES
__Page
I of 65Decision Making in the HIV/AIDS Supply Chain
byElaine Phu Cao
Submitted to the Engineering Systems Division
on 11 May 2007 in Partial Fulfillment for the Degree of Master of Engineering in Logistics
Abstract
During the first two decades of HIV/AIDS awareness, the U.S. and foreign governments responded slowly to the crisis. In contrast today, as the pandemic continues, initiatives of nonprofit organizations have dramatically increased the amount of available funding. Countries must work to effectively allocate the influx of resources. This paper examines one area for improvement within the context of the developing world: supply chain management. The HIV/AIDS supply chain in a resource-poor setting differs from
traditional networks. In order to properly manage operational activities, it is important to understand inherent system complexities, such as bureaucratic funding, forced ordering, shrinkage, and human capital constraints. This research explores these issues and identifies five scenarios that impact performance measures. The model, developed through an integrated supply chain approach, simulates the effects of scenarios on inventory level, cycle service level, and missed treatment dosages. Supply chain
planning without accounting for system complexities leads to significant drops in service performance from theoretical expectations. Countries should order excess inventory to compensate for these issues. Funding efforts should focus on training resources to properly manage treatment demand and target operational changes that yield the highest improvements on performance metrics. Short-run and long-run tactics must be aligned to avoid the threat of widespread resistance, which results from inconsistent treatment and poor patient care. The goal of this research is to understand the HIV/AIDS supply chain and identify the best areas for resource investment.
Acknowledgment
This thesis would not have been possible without the valuable guidance of my thesis advisor, Dr. Edgar Blanco of MIT, and insights from individuals at the Clinton Foundation, USAID, Center for Disease Control, and Institute of Healthcare
Improvement. I would also like to thank Dr. Chris Caplice, Director of MLOG, for helping me make the most out of my academic experience. I am continually grateful for the support of my family and friends, and encouragement from my fellow MLOG
classmates.
Biographical Note
Elaine Cao completed a Bachelor of Science in Industrial Engineering at Northwestern University. She graduated with departmental honors, a minor in Economics, and a certificate in Applied Mathematics. After graduating, she worked as a consultant in Accenture's Health & Life Science practice and Huron's Performance Improvement group. In 2006 she left to attend MIT where her focus has been on healthcare process improvement.
Table of Contents
A bstract ...
2
A cknow ledgm ent ... 3
Biographical N ote ... 3 Table of Contents ... 4 List of Figures ... 6 List of Tables... 7 1 Introduction ... 8 1.1 M otivation... 9 1.2 Overview ... 11
2 HIV/A ID S Com plexities... 12
2.1 Treatm ent ... 12
2.2 D eveloping Nation Environm ent ... 14
2.2.1 Funding... 14
2.2.2 Shrinkage... 14
2.2.3 H um an Resources... 15
2.2.4 Consum er Behaviors ... 16
2.3 Issues Sum m ary ... 16
3 Supply Chain D escription ... 18
3.1 Procurem ent ... 18 3.2 D istribution... 20 3.3 Inventory lc ... 20 3.4 Case Examples ... 21 3.4.1 K enya... 21 3.4.2 U ganda ... 23 4 Previous W ork... 24
4.1 Institute for H ealthcare Improvem ent ... 24
4.2 Clinton Foundation... 25
4.3 Center for D isease Control (CD C) ... 27
4.4 USAID ... 28
5 Threat of W idespread Resistance...
31
6 Simulation M odel...
34
6.1 M odel Design ...
35
6.2 Baseline Data and Assumptions ...
36
6.3 Scenario Testing ...
39
6.4 Scenario Results...
40
6.4.1 Baseline Comparison ...
40
6.4.2 Increased Patient Demand...42
6.4.3 Increased Site Order Placement Probability ...
43
6.4.4 Decreased Lead-Time Variability ...
44
6.4.5 Decreased Shipment Shrinkage ...
45
6.5 Results Summary...47
6.6 Implementing the M odel ... 49
7 Opportunities for Further Research... 51
8 Conclusion...53
Bibliography... 54
Appendix I: Acronyms...56
Appendix II: Sub-Saharan Africa Procurement... 57
Appendix III: Order-Up-To Calculations ... 60
Appendix IV: Simulation M odel... 61
Appendix V: Simulation Runs ... 62
List of Figures
Figure 1: 2006 People Living with HIV (in millions) ... 9
Figure 2: Supply Chain Com plexities... 17
Figure 3: Kenya Logistics System 2004... 22
Figure 4: CHAI Negotiated Price Comparison (Annual Treatment Cost per Patient) .... 26
Figure 5: M odel D iagram ... 36
Figure 6: Scenario 1 - Baseline Comparison Results... 41
Figure 7: Simulation Warehouse CSL vs. Average Inventory Levels... 42
Figure 8: Simulation Site CSL vs. Average Inventory Levels... 42
Figure 9: Scenario 2 - Increased Patient Demand ... 43
Figure 10: Scenario 3 -Increased Site Order Placement Probability ... 44
Figure 11: Scenario 4 -Decreased Administering Site Lead-Time Variability... 45
Figure 12: Scenario 5 - Decreased Shipment Shrinkage at the Warehouse Level... 46
Figure 13: Scenario 5 - Decreased Shipment Shrinkage at the Administering Sites ... 47
List of Tables
Table 1: Unmet HIV Treatment Demand (Dec. 2005) ... 10
Table 2: Medical Human Resources per 100,000 People... 15
Table 3: Manufacturer of ARV Drugs into Sub-Saharan Africa - 2004 to 2006 ... 19
Table 4: CDC SDM P Core Curriculum ... 28
Table 5: U SAID Tool Description... 29
Table 6: M odel A ssum ptions ... 37
Table 7: Safety Stock Factor... 38
Table 8: Inventory Levels Corresponding to Each Safety Stock Factor... 40
Table 9: Output Summary - Warehouse Cycle Service Level Improvement... 48
Table 10: Output Summary - Warehouse Avg. Inventory Level % Improvement ... 48
Table 11: Output Summary -Site Cycle Service Level Improvement ... 48
Table 12: Output Summary - Site Avg. Inventory Level % Improvement ... 48
Table 13: Output Summary - Total Missed Monthly Dosage % Improvement... 49
Table 14: Sub-Saharan Africa ARV Drug Consignee Data - 2004 to 2006 ... 57
Table 15: 2006 Sub-Saharan Africa Country of Manufacturer Data - ARV Drugs... 58
Table 16: 2006 Sub-Saharan Africa ARV Drug Manufacturer Data - 2004 to 2006... 58
Table 17: Sub-Saharan ARV Drug Purchasing Volumes - 2004 to 2006... 59
Table 18: Warehouse Order-Up-To Calculations (CSL = 99.99%) ... 60
Table 19: Site Order-Up-To Calculations (CSL = 99.99%)... 60
Table 20: Baseline Comparison Simulation Runs ... 62
Table 21: Increased Patient Demand Simulation Runs... 63
Table 22: Increased Site Order Efficiency Simulation Runs... 64
Table 23: Decreased Site Lead-Time Variability Simulation Runs... 64
Table 24: Decreased Warehouse Shipment Shrinkage Simulation Runs ... 65
Table 25: Decreased Site Shipment Shrinkage Simulation Runs ... 65
1
Introduction
.
The prevalence of HIV/AIDS increases year after year in poverty stricken nations. In order for these countries to establish a stable economy, work must be done to combat the spread of disease. The need to effectively allocate financial resources escalates as the efforts of nonprofit organizations continue. This research explores one area for
improvement, supply chain management. HIV/AIDS treatment in developing countries is particularly interesting because of the distinct nature of the drug and the resource
constrained environment in which it is administered. The three main objectives are to: * Understand the major obstacles in managing an efficient HIV/AIDS supply
chain
" Identify the economic impacts of inadequate patient care due to a poorly
managed system
" Develop a high-level model that will help nonprofit organizations assess their
current operations and make effective future decisions
For a variety of reasons, the nonprofit HIV/AIDS supply chain, particularly in poor countries, differs from traditional supply chains. This paper explores these differences and analyzes methods for better management control. The constructed research model tracks drug inventory and cycle service levels in an integrated upstream and downstream approach while accounting for operational issues.
Research Question: How can developing countries most effectively manage their supply
1.1 Motivation
A significant unmet need for HIV/AIDS treatment and mounting funds motivates
this academic endeavor. An estimated 39.5 million people suffer worldwide from HIV. In 2006, 4.3 million new patients were diagnosed and 2.9 million people died of AIDS-related illnesses.
Figure 1: 2006 People Living with HIV (in millions)
Sub-Saharan Africa is the most affected region in the world with nearly 2/3 of the total disease population. Not all infected individuals require drug treatment. Physicians prescribe drugs based on disease symptoms, level of CD4 count 1, and viral load.
According to UNAIDS, 6.5 million people require drug therapy, but only 1.3 million are treated. This equates to 80% of people living with HIV/AIDS receiving inadequate health care. See table 1 on the following page.
The CD4 count indicates immune strength and disease stage advancement.
Page 9 of 65 2.2 1.4 -7.8 24.7 * Sub-Saharan Africa * South and South East Asia
o Eastern Europe & Central Asia O Latin America
* North America * Other
Table 1: Unmet HIV Treatment Demand (Dec. 2005) Est. No. of People Est. No. of People
Receiving Treatment Needing Treatment Percentage
Region (Dec. 2005) (Dec. 2005) Covered
Sub-Saharan Africa 810,000 4,700,000 17%
Latin America &
Caribbean 315,000 465,000 68%
East, South & South
East Asia 180,000 1,100,000 16%
Europe 21.000 160,000 13%
Middle & North
Africa 4,000 75,000 5%
Total 1,330,000 6.5 Million 20%
Given these overwhelming figures, projects established by the United Nations (UN), United States, and the World Health Organization (WHO) have propelled the issue of HIV/AIDS forward. The UN set one of its eight millennium goals towards halting and reversing the spread of HIV/AIDS by 2015. The current Bush administration started the
U.S. President's Emergency Plan for AIDS Relief (PEPFAR). PEPFAR is the largest
international health initiative dedicated to a single disease. The goal is to disperse $15 billion dollars in funding over the next five years. Furthermore, the WHO launched its '3 by 5' initiative on December 1, 2005 with the intent of providing 3 million people with HIV treatment by 2015.
The purpose of this research is to help countries make effective supply chain decisions given available resources and inherent complexities. Initiatives of nonprofit organizations continue to provide more funding as the threat of this disease continues. Initially the U.S. and countries abroad responded slowly to the AIDS pandemic, primarily because of the negative stigma associated with the disease. Governments, in the first 20 years of public awareness, 1981 to 2001, made little effort to address HIV/AIDS.
times the financial backing in 2001. This figure is expected to rise to $8.9 billion in 2006 and $10 billion in 2007. The large discrepancy in treatment access and demand makes efficient fund allocation critical in the battle against HIV/AIDS.
1.2 Overview
This study seeks to understand how developing nations can effectively manage their HIV/AIDS supply chain despite the complexities of operating in a
resource-constrained environment. Chapter 2 identifies key supply chain issues, chapter 3 depicts the current supply chain, and chapter 4 describes ongoing nonprofit efforts. Collectively these sections illustrate the difficulties of distributing and administering HIV medication in developing countries. Poor supply chain management leads to suboptimal patient care. Chapter 5 explores the economic impacts of inconsistent treatment. The threat of
widespread treatment resistance makes high patient service levels important. Treating resistant patients is more costly and will greatly hinder long-term efforts in combating HIV/AIDS. Chapter 6 outlines the simulation model and five target scenarios. These
scenarios impact performance metrics, such as inventory levels and cycle service
performance. Simulation results and model implementation are described in depth in this section. Finally as a wrap-up, chapter 7 offers opportunities for further research and chapter 8 highlights key conclusions.
2 HIV/AIDS Complexities
The HIV/AIDS supply chain differs from traditional operations because of treatment characteristics and the poor healthcare infrastructure in developing nations. Considerations regarding funding, shrinkage, human capital, and consumer behavior need to be accounted for in order to successfully manage the supply chain.
2.1 Treatment
HIV/AIDS patients high CD4 counts and viral loads are put on a lifelong
treatment regimen called HAART, highly active antiretroviral therapy. This therapy includes single dose and fixed-dose combinations of two or three Antiretroviral (ARV) drugs from different medication categories. The following is a list of ARV groupings:
* Protease Inhibitors (PIs)
" Nucleoside/Nucleotide Reverse Transcriptase Inhibitors (NRTIs)
* Non-Nucleoside Reverse Transcriptase Inhibitors (NNRTIs) " Entry Inhibitors (excluding Fusion Inhibitors)
Patients, on HAART, must take medications twice a day everyday. A 90-95% adherence to this regimen is required for treatment to be effective in the long run. HIV/AIDS is biologically adaptive. Patients who miss more than one dose every two weeks will develop drug tolerance. There are 1st and 2nd line patients. Patients are initially put on a
resistance are moved to 2"d line medication. 2"d line patients require higher dosages and
must be monitored frequently. 2"d line and pediatric drugs are 10 to 50 times more
expensive then first line treatment and may require cold-chain storage. Once HAART has been initiated, ARV drugs should be made available consistently to a patient over their life-time in order to maintain drug effectiveness. This puts tremendous pressure on supply chain functionality because of high stock-out risks and dosage variability
dependent on patient medical needs.
Advances in modem medicine and improvements in treatment cost and delivery have made caring for those infected with HIV economically feasible. HIV positive patients can live long health lives under HAART. A common method for gauging the cost effectiveness of healthcare treatments involves looking at quality adjusted life years (QALYs). QALYs takes into account the number of years a patient's life is expected to be increased by treatment and adjusts based on the quality of life this therapy provides. According to a 2004 study initiated by the Medecins Sans Frontieres (MSF)2, Cape Town
patients on ARV treatment have an expected life of 6.79 quality adjusted years verses
1.59 for those left untreated. The estimated cost for a lifetime of treatment is $13,000 or
approximately $1,900 per QALY ($13,000 / 6.79 QALYs). Generally, treatments are considered cost effective if it less than 3 times the gross national income (GNI) per capita. For Sub-Saharan Africa, the GNI per capita is approximately $735, thus making HAART a cost effective option. Procurement discounts, especially for 2"d line and
pediatric drugs, and process efficiencies can greatly help to lower the cost per quality adjusted life year and further expand treatment.
2 Mddecins Sans Frontieres (MSF) is an international humanitarian aid organization that provides emergency medical assistance to populations in danger.
3 Source: World Bank, Sub-Saharan Africa GNI per Capita = $745
2.2 Developing Nation Environment
2.2.1 Funding
Besides the unique nature of HAART, other factors make the HIV supply chain difficult. There are burdening budgetary concerns. Financial funding relies heavily on public and private donations. Because of the extensive amount of paperwork involved with purchasing through multiple funding organizations, developing countries typically place an annual order and schedule 3 or 4 deliveries throughout the year. Forecasting accuracy for such an extensive period is difficult and coordination between various donors can be cumbersome. These issues that influence country operations also affect ARV suppliers. In working with the bureaucracy of nonprofits, it is hard for drug manufacturers to manage their revenue recognition cycles. Companies depend on these incomes to build additional capacity needed to meet increasing demand made available through nonprofit funding.
2.2.2 Shrinkage
Outside countries produce most HIV drugs distributed in Sub-Saharan Africa. Hurdles in getting these life-saving treatments past customs add to time and
lead-time variability. ARV medications have a shelf-life of 12 to 24 months and typically
25% to 30% of the shelf-life is gone by the time the drugs reach its destination.
Furthermore, distribution in country can be challenging. These drugs are administered to remote areas where transportation is difficult. Delivery can be unreliable and lack the necessary measures to deter theft. Transportation methods must be secure, accountable, and in some cases equipped with temperature controls throughout the supply chain. High
lead-time variability and the common occurrences of shrinkage make the supply chain in developing countries tricky to manage. Shrinkage in this situation can be attributed to supplier inefficiencies, theft, and/or product spoilage.
2.2.3 Human Resources
Aside from appropriate supply chain policies and drug availability, there is an insufficient amount of human resources available to run an effective supply chain. It is difficult for developing countries to recruit and retain strong management and medical staff. This leads to drug orders not being placed and patients missing their dosages. The U.S. has over 51 times the number of physicians, 22 times the number of nurses, and 29
times the number of pharmacist in comparison to Rwanda for every 100,000 people4. See table 2 below. Appropriate policies in operations must account for these inefficiencies and lack of human capital.
Table 2: Medical Human Resources p r 100,000 People Country Phyicans turm Phar1cTNt4
US 256 937 88 Dominican Republic 188 184 40 China 106 105 28 Bahamas 105 447 n/a Jamaica 85 165 n/a India 60 80 56 Botswana 40 265 19 Haiti 25 11 n/a Cambodia 16 61 4 Kenya 14 118 10 Lesotho 5 62 3 Rwanda 5 42 3 Mozambique 3 21 3 Tanzania 2 37 1
4 PLOS Medicine, www.plosmedicine.org, July 2006, Volume 3, Issue 7 - McCarthy, O'Brien, Rodriguez. Training and HIV Treatment Scale-up: Establishing an Implementation Research Agenda.
2.2.4
Consumer Behaviors
Consumer behavior makes demand management and quality patient care a major obstacle. It takes significant commitment on the patients' part to stick to a regiment of two doses a day. Those infected by HIV need to be educated on the disease and the
importance of treatment adherence. Patients in developing countries have difficult transportation and financial hurdles. They cannot afford regular visits to a clinic. In general patients are required to visit a facility every month. Clinicians use this time to monitor treatment, make dosage adjustments, and distribute ARV drugs for the following month. HAART medication must be taken on a full stomach in order to reduce nausea and allow the body to keep drugs in the system. In Sub-Saharan African, there are over 300 million people living below the poverty level, or less than $1 per day (World Bank
Report). They do not have consistent access to food and water. Patients in poor
countries may be willing to adhere to treatment, but there are socio-economic factors that prevent them from receiving adequate care. All of these constraints affect consistent consumer behavior make demand management highly unpredictable.
2.3 Issues Summary
The aforementioned issues all contribute the complexity of the HIV/AIDS supply chain in developing countries. These factors make the system unique. Special
considerations should be made to maintain adequate inventory levels and high cycle service levels. See figure 2 on the following page for a summary of the added
proposes ways to manage these issues and analyzes improvements that will have the greatest impact on providing consistent patient care.
- - -M intirlA rnnrrnfi I dcnor burearcra.y | -Difficult revenue re-ogiiticn management Increasin] czpacity I Idemaids I -Lcng -us:om I I nr-co effoctinc I I drig shelf-life
National Intermedlary Treatment
Varehmuse IWarehouse I I Facilfty
r -- - r ---
r---1 - Anwanl nalinnnl I -Fiyrso Hlpivp.ri P and I i - fnmanl
I order I order plEcenent I I maiagement
I II
-Noiprofit Prodict shrinkaqe Fixed celiveriES aid
I bureaucra:y I | I order placement
Product shrinkage reliability I-. -. H Highie tm Product shrinkage
nd pie sreliability - and risks I-Long lead-times Hich lead-:ime vanabiity I Hu-nan resource constraints I I-_--_ ---variabilitV 0= -Hrmnn rmnnirr constraints -- -- ---Pcor education I - Inconsistent I treatrent access I - Lack of proper I I nutrition I Lorq lead-:imes - Pcvery
High Ind-timrn variability Human resource corstraints -_________j L - --- - - I Figure 2: Supply Chain Complexities
Page 17 of 65 M=*
3 Supply Chain Description
Developing nations structure and operate their HIV/AIDS supply chain
differently. The information presented in this chapter and in the Previous Work section comes from literature research and interviews with nonprofit organizations. The objective is to understand the current situation and explore the common complexities mentioned earlier in figure 2. This section describes procurement, distribution, and inventory management policies in developing countries. The specific focus, illustrated through case studies, is on countries in Sub-Saharan Africa. These nations have the highest prevalence of HIV/AIDS.
3.1 Procurement
Procurement can be centralized, decentralized, or some combination of the two practices. Ideally, at the national level, governments should purchase centrally in order to have greater control over drugs arriving in country. All ARV drugs in Rwanda are
purchased through a central source, but this is considered atypical. Generally, countries must purchase through a number of donor organizations all of whom have their own supplier preferences. A large order is placed for the year with 3 or 4 scheduled
deliveries. These shipments usually take 4 to 8 weeks to arrive at the destination country. The Clinton Foundation HIV/AIDS Initiative advises their partnering nations to move towards a 70/30 percent split between two main suppliers. This allows for pricing discounts based on volume and a reduction in procurement risks by sourcing from multiple suppliers. Generic manufacturers supply the majority of drugs to Sub-Saharan
Africa. See table 3 and Appendix I for details.5 Buying power and control are important in dealing with these producers, because although more inexpensive, there is a growing concern over the efficacy of unbranded prescription drugs.
Table 3: Manufacturer of ARV Drugs into Sub-Saharan Africa - 2004 to 2006 6 Manufactr Number of Units Peroente
Other 1383544787 50.00% Cipla Ltd. 530496763 19.17% Aurobindo Ltd. 189293999 6.84% GlaxoSmithKline Ltd. 121202502 4.38% Boehringer Ingelheim 89690919 3.24% Bristol-Myers Soulbb 78353761 2.83% Aspen Pharmacare Ltd. 71254790 2.58% Hetero Drugs Ltd. 65697580 2.37%
Merck, Sharp & Dohme Ltd. 54836157 1.98%
Ranbaxy Ltd. 40918190 1.48% Emcure 33168200 1.20% Strides Arcolab Ltd. 31128180 1.12% Hoffman La Roche 30897198 1.12% Abbott Laboratories Ltd. 14283118 0.52% IDA 12272000 0.44% Roxanne Lab. 6224400 0.22% Aspen Pharmacare 5765040 0.21%
Gilead Sciences, Inc. 3299490 0.12%
A to Z Textiles Limited 2574210 0.09%
IHD 532800 0.02%
Gilead Sciences Inc. 529830 0.02%
Ranbaxy Ltd.. 399000 0.01% Cadila 240000 0.01% Geka Pharma 195600 0.01% Patheon 122220 0.00% Roxane Laboratories 72000 0.00% To be verified 54000 0.00% UNICEF Warehouse 41640 0.00% Meymac 600 0.00% Star Pharmaceuticals Ltd. 600 0.00% Grand Total 2767089574
Local purchasing differs slightly from national policies. Countries that have well-trained staff at the local administering level will utilize a "pull" ordering system, while centrally efficient programs will utilize a "push" system. Some may use both types of procedures based on the characteristics of the individual dispensing site. At both the national and local level, countries generally order in fixed periods because of the arduous task of effort coordination and transportation management.
5 World Health Organization Global Price Reporting Mechanism
6 Highlighted manufacturers produce branded drugs.
3.2 Distribution
Distribution networks also appear to be different from country to country, but there are some commonalities. Typically there is a national warehouse and intermediary
warehouses that supply large hospitals and local clinics with first-line ARV medications. The demand for second-line treatment is much smaller, so countries with reliable quick transportation systems, less than 24 hours, will store these products at a national facility. Ordering and transportation can be handled at the warehouse level or by the
administering facility. In Rwanda, patient interfacing locations place their orders with a warehouse and are responsible for arranging transportation and shipment pick-up. Since Rwanda is rather small, approximately 26,000 square kilometers or slightly more than twice the size of Los Angeles county, transportations take less than a couple of days even despite the rural transportation networks. In more sophisticated systems, distribution is controlled centrally. Transportation runs may be triggered by an order placement or be routine. Some areas will incorporate a "milk-run" scenario. A truck will routinely visit a set of sites. In these visits, the truck will replenish supply and pick up products that are close to expiration. These drugs are then redistributed to facilities for immediate
administering. Regardless of the level responsible for transportation, distribution must be reliable and secure because of the sensitivity of ARV drugs.
3.3 Inventory Policy
Locations determine order quantities based on inventory management policies. This is similar to practices in traditional supply chains. Much like procurement and distribution, inventory management will either be controlled centrally or at the local sites
depending on which level is run most efficiently. The standard policy, as considered by USAID, is a (R, s, S) system. With this setup, facilities review inventory every R
periods. Once inventory levels hit a point s, product is ordered up to a quantity S. In a (s, S) system inventory is reviewed continuously. Product is ordered up to a point S, once
inventory levels fall below a point s. Lastly, there is a two-bin variation of the
continuous review system. Two bins are each filled with enough supply to meet demand for a given period of time. Once all the drug treatment is gone from one bin, product is ordered to fill the emptied bin. All of these policies are reasonable, but the policy looked at in this research model is an (R, S) model. The Model Design section describes reasons for an (R, S) selection.
3.4 Case Examples
3.4.1 Kenya
Figure 3 illustrates a USAID study done in Kenya in 2004. The diagram shows organizations that contribute to funding, procurement, warehousing, and delivery at the district and sub-district levels. A major procurement issue for Kenya, which likely exists with other under-developed African countries, is the consuming task of ordering through multiple donor organizations. Anti-retroviral drugs go through 4 different funding sources and 6 different procurement agencies in Kenya. Synchronization concerns contribute to complications involved with scheduling and demand planning.
Anti-Ratroviral
Drugs
Mission for Centers; forDotrwihu
Crown Agents Government Essential Drugs Diase Control "The ConBortum1" Dorrs
(Private / NGO) of Kenya and Supplies (Bilateral Donor) (Private / NGO) (Private / NGO)
(Prit /ING 01
EEMSA KEMSA Central
E.:
Funingl Depoi -a+. SeSoucrs
mProrarn
A And SrclresCot) Stof
r WOvt.) (Prroie/g
DIevdet Lve and ztalth Cetr St Lv (Gvt)
Note: (1) Crown Ag ents, G TZ (Duetsch e), JSI (John Snow, Inc.), and KEMSA (Kenya Medl cal Supplies Agency) (2) Dispensaries go to the district level to collecet drugs.
K EY Funding Source Procurement Agency Point of First Warehousing
Delivery Organization to District Levels
Delivery Organization to Sub-District L evels
Figure 3: Kenya Logistics System 2004
ARV drugs in Kenya are distributed through three different sectors: public,
private, and mission (religious). 7 Within the public sector there is 1 central warehouse
(KEMSA in Nairobi), 7 regional warehouses, 2 national hospitals, 8 provincial hospitals,
and 78 district hospitals which serve the health centers and dispensaries. The central and
regional warehouses distribute to the hospitals, which order every 2 months. The central warehouse pushes orders out to the regional warehouse. National and provincial
hospitals can schedule pick-ups or deliveries, while all district hospitals receive deliveries. Once an order is placed, it takes 4 to 6 weeks for this order to arrive at the
hospitals. Health centers and dispensaries in this case do not administer ARV drugs. The public sector treats approximately 70,000 patients in Kenya.
3.4.2 Uganda
The Ministry of Health and the Danish International Development Agency purchases essential drugs in Uganda. The National Medical Stores in Entebbe (NMS) manages logistic operations.8 Uganda has 56 district and 214 sub-district storage facilities. Distribution operates on a "push" system where a central organization
determines order quantities and scheduling for all channels. The NMS delivers drugs to the district warehouse, which subsequently repackages for transportation to the sub-district locations. Four trucks are used to service the entire system. Current lead-time including processing, transportation, loading, and unloading time takes approximately 59
days at the district level. For Uganda, fuel and maintenance is $.63 per kilometer, travel per diem is $14.45 per day per truck driver, and standing costs are about $110.22 per vehicle per day.
8 Deliver. Analyzing Transportation Costs Uganda. On Track. April 2003
4 Previous Work
There has been extensive research in resource allocation in regards to global policy making, but the purpose of this paper is to address the problem of HIV/AIDS from a tactical level. Many nonprofit organizations contribute to work in this arena.
Specifically, this section looks at the efforts of the Institute of Healthcare Improvement, Clinton Foundation, Center for Disease Control, USAIDS, and Partners in Health. Information is based on literature research and field interviews. The Institute of Healthcare improvement targets benefits through process improvement. The Clinton foundation takes an advisory role in negotiating ARV procurement discounts and in addressing the lack of human resources in the healthcare profession. The Center for Disease Control, through its Sustainable Development and Management program, works to train effective leaders in managing the efforts against the spread of HIV/AIDS. In targeting multiple areas of the supply chain, USAID has developed a variety of tools to
help developing countries assess and improve their operational activities. And lastly, Partners in Health, through its HIV Equity Initiative in Haiti, has developed a unique approach in addressing the prevention, treatment, and education of HIV/AIDS.
4.1 Institute for Healthcare Improvement
The Institute for Healthcare Improvement (IHI) was founded in 1991. It is a nonprofit organization that originally focused on improving the health care system in developed countries, but has recently expanded its work into poor nations. Specifically,
[HI works to increase availability and access to HAART through process improvement.
IHI and its partners currently support several projects in South Africa. Rural projects are in Umkhanyakude District and Mhlontlo District (Eastern Cape), and urban projects are in Cape Town metro (Western Cape) and Johannesburg.9 IHI's focuses its approach on achieving benefits that do no require an extensive amount of human and material resources. In the Eastern Cape, IHI increased the number of patients that initiated monthly on treatment from 12 to 35 through process changes and the spread of
HIV/AIDS awareness. IHI believes the most effective way to combat HIV/AIDS is to
optimize the existing healthcare system while securing resources needed for widespread treatment.
4.2 Clinton Foundation
The Clinton Foundation HIV/AIDS Initiative (CHAI) works to combat the spread of disease through drug discounts and integrated care programs, e.g., treatment and prevention. In 2005, over 30% of the Clinton Foundation expenses, approximately $40M, were spent on HIV/AIDS programs (2005 Annual Report).
CHAI's Procurement Consortium is among these programs. The Procurement Consortium allows developing countries to access ARV drugs at affordable prices. Nearly 90% of drugs purchased in Sub-Saharan Africa are through generic
manufacturers. See Procurement section. On October 23, 2003 an agreement was established with 5 generic manufacturers: Aspen Pharmacare Holdings, Cipla, Hetero
9 "The Science of Dissemination: Strategies for Scale-up Antiretroviral Treatment in South Africa Through Health System Optimization"
Drubs, Ranbaxy, and Matrix Laboratories. These companies allow the CHAI team to identify areas for cost savings within their operations in exchange for pricing discounts based on volume contracts. CHAI teams focus on lower manufacturing costs and formulation overhead for generic companies. Over 60 partner countries have access to this pricing agreement. The World Health Organization has approved all drug therapies included in the agreement for quality and efficacy. Four years ago the price of treating a patient on ARV medication for one year was over $500. The Clinton Foundation has reduced these prices by nearly two-folds. See figure 4 for price comparisons. In
addition, CHAI launched the Pediatric and Rural initiative in 2005. Through this effort, CHAI is working to reduce the prices of pediatric and 2nd line HIV/AIDS treatment and
diagnostic tests. These medications are more expensive primarily because of a lack of competition by generic manufacturers.
HAART Treatment HAART Treatment
(3TC+d4T(40)+NVP) (9TC+d4T(40)+NVP) October 2003 October 2005 $562 S562 $290 $192 $140 $140
Branded Generic CHAI Branded Generic CHAI Best Ceiling Best Celling
Figure 4: CHAI Negotiated Price Comparison (Annual Treatment Cost per Patient)
CSHOR, Consortium for Strategic HIV Operations Research, is a new program division within CHAI. CSHOR works with low and middle income countries to improve treatment and care. This program addresses the lack of resources and infrastructure available to support widespread HAART treatment. CSHOR has developed a simulation
tool, SIMCLIN, that analyzes resource requirements for drugs, lab testing, and human resources. The model predicts future healthcare needs and the impact of change at the administering level. Formulation inputs include data regarding population and treatment protocol. This initiative works to improve the recruiting, training, and retention of necessary healthcare workers in developing countries.
4.3 Center for Disease Control (CDC)
The Center for Disease Control (CDC), similar to the Clinton foundation, views human resource as an important area for improvement, but their focus is at the
management level. The CDC sponsors a Sustainable Management and Development Program (SMDP). The goal of this program is to strengthen public health management and leadership in developing countries. SMDP partners with the Ministry of Health, Non-Government Organizations (NGOs), and academic institutions. SMDP offers a six week training course in the Management of International Public Health (MIPH).
Enrollees are local counterparts from the CDC Global AIDS Program (GAP) and developing country representatives. Once completing MIPH, the CDC sends these representatives back to their host country. They are then responsible for using the tools and techniques provided by SMDP to train individuals in middle management, e.g., lab managers, warehouse coordinators, etc. The Center for Disease Control has taught nearly 300 people from 61 countries, who, as a result, have trained over 3000 public health
professionals. Table 4 on the next page details the core competencies of SMDP.
Table 4: CDC SDMP Core Curriculum
Managing in an Organization Managing Public Health Managing in a Changing Training of Trainers
Programs Environment
" Team Building 0 Priority Setting 0 Leading Change for * How to Manage,
* Effective 0 Health Problem Results Design, Deliver,
Communication Analysis * Advocacy * Evaluate Training
" Behavioral Style 0 Intervention * Communication and * Effective
Analysis Strategy Media Relations Presentation Skills
* Leadership * Work Plans and * Crisis
* Conflict Program Budgets Communication
Management * Monitoring and 0 Organizational
* Strategic Evaluation Excellence
Communication * Problem * Time and Meeting
Solving/Evidence-Management Based
* Supervision * Decision Making 0 Process
Improvement
Often SMDP workers will visit a developing country as mentor. They will collaborate with the country representative in management development efforts. For eample, SMDP helped the Machinga District Hospitals in Malawi. 65% of the hospitals in this district were experiencing low detection rates of smear-positive tuberculosis patients because of laboratory handling errors. Through training and process
improvements, the percentage of underperforming hospitals dropped from 65% to 50%.
SMDP's approach is to train strong managers to lead the efforts against HIV/AIDS.
4.4 USAID
USAID is an independent government agency that operates under the guidance of the Secretary of State. The purpose of this organization is to further America's foreign policy interests and improve the lives of those in the developing world. The USAID DELIVER project focuses on supply chain operations. DELIVER has developed several tools for managing operations. These tools help organizations assess their current supply chain situation and in some instances output concrete operational decisions, e.g., forecasting
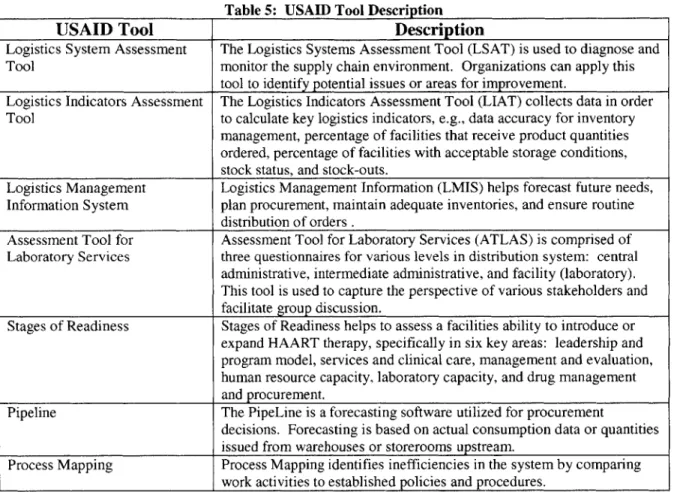
figures, procurement quantities, etc. See table 5 for a list of USAID tools and functionality.
Table 5: USAID Tool Description
USAID Tool Description
Logistics System Assessment The Logistics Systems Assessment Tool (LSAT) is used to diagnose and Tool monitor the supply chain environment. Organizations can apply this
tool to identify potential issues or areas for improvement.
Logistics Indicators Assessment The Logistics Indicators Assessment Tool (LIAT) collects data in order Tool to calculate key logistics indicators, e.g., data accuracy for inventory
management, percentage of facilities that receive product quantities ordered, percentage of facilities with acceptable storage conditions, stock status, and stock-outs.
Logistics Management Logistics Management Information (LMIS) helps forecast future needs, Information System plan procurement, maintain adequate inventories, and ensure routine
distribution of orders .
Assessment Tool for Assessment Tool for Laboratory Services (ATLAS) is comprised of Laboratory Services three questionnaires for various levels in distribution system: central
administrative, intermediate administrative, and facility (laboratory). This tool is used to capture the perspective of various stakeholders and facilitate group discussion.
Stages of Readiness Stages of Readiness helps to assess a facilities ability to introduce or expand HAART therapy, specifically in six key areas: leadership and program model, services and clinical care, management and evaluation, human resource capacity, laboratory capacity, and drug management and procurement.
Pipeline The PipeLine is a forecasting software utilized for procurement
decisions. Forecasting is based on actual consumption data or quantities issued from warehouses or storerooms upstream.
Process Mapping Process Mapping identifies inefficiencies in the system by comparing work activities to established policies and procedures.
4.5 Partners In Health
Founded in 1987, Partners in Health (PIH) is a nonprofit organization that focuses on delivering quality health care to developing communities. PIH benefits from strong alliances with Harvard Medical School, Harvard School of Public Health, and the
Brigham and Women's Hospital. Partners in Health launched their HIV Equity Initiative in Haiti in 2000 with the help of a $44.7M grant from the Bill & Melinda Gates
Foundation. This effort is based on PIH's "four pillars": AIDS prevention and treatment, advanced tuberculosis care, improved screening and testing, and women's health.
Tuberculosis is the leading cause of death among those suffering from HIV/AIDS. The focus on women's health is on reducing maternal mortality, preventing mother-to-child transmission, and early detecting of HIV in newborns. The supply chain that resulted from this effort is unique. Free ARV medications are provided to the community through "Accompagnateurs". Accompagnateurs are local Haitians trained to administer ARV
drugs. They travel to patients daily and serve as a link between the villages and the clinics. Accompagnateurs, some who may be HIV positive, test patients, deliver
therapies, ensure adherence, and attend to social problems, such as malnutrition, housing, education, and psychological support. As a result, PIH has lowered AIDS mortality in impoverished areas and have since expanded into Sub-Saharan Africa.
5
Threat of Widespread Resistance
The aforementioned supply chain complexities contribute to inconsistent HIV treatment, which can then result in widespread drug resistance. Chapters 2 through 4 highlighted issues in the developing world and chapter 6 identifies five process scenarios that impact service level and inventory management. High service levels come at the expense of increased inventory. Although excess drug inventory causes system waste, the long-run cost of missed dosages far outweighs the immediate financial burdens of purchasing and holding extra product. This chapter seeks to analyze the economic impacts of poor patient care.
Patients that miss treatment tend to build a tolerance to drug effectiveness.
Patients are required to take their medication everyday and HAART becomes ineffective if more than one dose is missed every two weeks. Resistant patients are more expensive to treat. Cynics of nonprofit programs in developing countries believe that these
initiatives provide greater opportunity for HIV viruses to mutate and spread. In contrast, "Staying the Course", an article in Nature, states that widespread resistance is not a threat because patients in Africa are just as likely to adhere to treatment as those in the
developed world.
Although individuals in developed and developing countries have demonstrated commitment to HIV therapy, there are additional issues to consider in understanding the potential for widespread resistance in resource-poor environments. The development and
spread of resistant strains as an outcome of inconsistent treatment, is not dependent on one country's performance relative to another. Poor patient care is a global issue and will
lead to the spread of a mutated disease if not managed properly. Furthermore insufficient funding can result in inconsistent treatment. Patients in developing countries treated in the government nonprofit sector do not have control over their healthcare funding as opposed to those who are financial independent. They may be willing to adhere to treatment, but are unable to due to socioeconomic factors. Additionally, patients in poorer countries might just as likely develop a resistant strain as those in the developed nations, but they may be more prone to spreading the disease. According to a study published in the Journal of Community Health, people in underdeveloped nations are less knowledgeable about HIV/AIDS facts, prevention, screening, and treatment. In this study a high-risk pool10 of Russian and U.S. citizens were surveyed on HIV/AIDS knowledge. On average 56% of Russians and 74% of U.S. citizens answered questions accurately. Inadequate HIV/AIDS education results in disease spread due to late detection or false assumptions regarding transmission, e.g., sex protection, needle sharing, etc.
Since HIV/AIDS is biologically adaptive, poor patient care will have an adverse effect on the efforts to lower HIV/AIDS mortality rates. Fortunately, according to a
study by MSF, only 4.4 out of a 1000 patients in developing countries are expected to switch to 2"nd-line treatment each year. Widespread resistance has not yet emerged, but the threat is imminent if measures are not taken to keep the disease from mutating and spreading. Quality uninterrupted treatment is needed in both the developing and developed worlds in order to avoid the devastating ramifications of suboptimal
healthcare. The consequence of drug resistance includes treatment failure, health cost increases, resistant strain transmission to treatment-naive individuals, and new anti-HIV
drug development. Quantifying this threat is difficult because sufficient data collection methods that capture the prevalence of HIV resistant strains among treated and untreated subjects do not currently exist.
The importance of dependable HAART accessibility makes a well designed supply chain critical. Operations must be robust and flexible to account for the complexities of the environment and provide quality consistent patient care. If
widespread resistance becomes more evident, a properly designed system will go a long way in battling HIV/AIDS. An important performance measure in the simulation model
is patient service. Identifying scenarios that help improve this metric in the short-run can greatly help to lower HIV/AIDS related deaths in the long-run.
6 Simulation Model
The goal of this research model is to look at areas of improvement in the entire HIV/AIDS supply chain while accounting for some of the complexities previously
mentioned. Most of the nonprofit initiatives target specific improvement areas, but a supply chain can only operate as efficiently as its weakest link. It is important to understand the relationships between the different nodes in the system, because changes in one area will undoubtedly result in a rippling effect. Furthermore, the tools developed by USAID and CHSOR can be data dependent. This poses a problem given that a
majority of facilities in the developing world have unsophisticated IT systems, and the minimal data available tends to be inconsistent and unreliable. Additionally, although Partners in Health's approach may be ideal, most resource constrained nations lack the infrastructure to support such a set-up, which requires extensive human resource and operational restructuring.
This research analyzes the problem at an integrated supply chain perspective. The model is intended to help organizations understand their supply chain issues and optimize their current operating environment. The simulation developed in this chapter does not
require a significant amount of data and looks at the interaction between a distribution center and multiple administering sites. Understanding the interaction between upstream and downstream operations and integrating the two can yield significant benefits. These benefits include improved customer service, faster response times, and reduced inventory investments and write-offs (Hau Lee, "Creating Value Through Supply Chain
systems approach and targeting improvement areas that will yield the most desirable outcomes.
6.1 Model Design
The simulation is designed in Microsoft Excel and is intended to be customizable to different operating environments. Each run includes 3 years of simulated data. Ideally, countries can use this simple approach to understand their operations and its effects on inventory and customer service levels. Inventory management is based on a (R,S) policy. Every R periods, product is ordered up to a level S. Although USAID considers a (R, s, S) policy as standard, an (R, S) system makes sense because of researched information
and the baseline data used in the model. Locations typically order in fixed intervals, hence the need to include set review periods, R. Furthermore, review periods tend to be longer than lead-times. In these instances, the minimum point s in a standard (R, s, S) system becomes the maximum level S.
The analysis considers one warehouse and two administering sites. The warehouse receives ARV drugs coming in-country from 3 suppliers and is the sole distributor to both
sites. Supplier lead-times to the warehouse and the local sites are simulated as a normal distribution. Although HAART can be complicated, see Treatment section, a monthly dose is considered to have the appropriate ARV drug combinations for a month's supply. Patient arrival and demand is modeled as a Poisson distribution. Patients arrive into the
system monthly to receive treatments for a 4 week period.
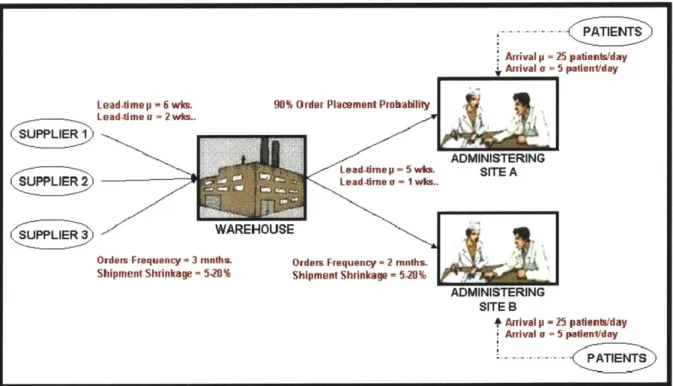
6.2 Baseline Data and Assumptions
The data used as baseline is considered reasonable according research and interview findings. The total yearly demand for the two sites combined is 18,000 monthly
treatment doses. On average, 25 patients arrive into the system daily at each site with a standard deviation of V5 or 5 patients per day." The warehouse places orders every 3 months and sites order every 2 months. Three suppliers service the warehouse. Orders are divided equally among these suppliers. Warehouse supplier lead-time is 6 weeks plus or minus 2 weeks. Processing time between the warehouse and local sites is 5 weeks plus or minus a week. See figure 5 and table 6 for model details and assumptions.
A.. . -2 PATIENTS
Arrival p 25 patients/day
i Arrival a 5=aie~a
Lead-time p = 6 wk. 90% Order Placement Probability
Lead-timea -2 wks.
ADMINISTERING
Lead-tirne p - 5 whm. SITE A
SUPPLIER 2Lead-rne a - 1 wks..
(S=UPPLIER 3 WAREHOUSE
Orders Frequency = 3 rnnths. Orders Frequency -2 rnnths. Shipment Shrinkage = 5.20% Shipment Shrinkage -5.20%
ADMINISTERING SITE B
Arrival p -25 patients/day Arrival a -5 patientday
... ATIENT
Figure 5: Model Diagram
" Calculation is based on the Kenya example. With 70,000 patients on treatment and approximately 88 treatment sites, each site will treat approximately 800 patients. Patients arrive every month to receive their monthly treatment dosages. 750 is assumed for calculation ease, therefore approximately 25 patients arrive to a site daily.
Table 6: Model Assumptions
* (R,S) inventory policy
0 Pull ordering system at the warehouse and local level 0 3 warehouse suppliers with evenly distributed orders * Warehouse delivery is every 3 months
0 Sites order every 2 months 0 Normally distributed lead-times 0 Poisson distributed patient arrivals * Site A has priority ordering over site B
0 Discrete site ordering probability - 1 if order is placed, 0 otherwise * Warehouse scheduled delivery quantities can be adjusted
0 Monthly treatment dosages are tracked in the model
As mentioned, the supply chain in the developing countries differs from
traditional operations. Some of these externalities have been incorporated into the model. A shrinkage factor is applied to shipments arriving to the warehouse and the sites.
Shrinkage can be due to supplier reliability, spoilage, or theft. Normal shrinkage is considered to be 5%, but due to the complexities of this system, the simulation factors in a 5-20% shrinkage percentage. Furthermore, due to resource issues, an order probability is considered at the site level. For baseline analysis, the model assumes that there is a
10% chance that an order is never placed because of poor management or resource
limitations. Order probability is simulated as a discrete distribution (order placed = 1 with a 90% probability and order not placed = 0 with a 10% probability). Data for
lead-times, patient arrival, and shrinkage are simulated in this model using the randO function in Microsoft Excel.
Inventory management calculations are based on textbook formulations in "Inventory Management and Production Planning and Scheduling" (Silver, Pyke, and Peterson). An order-up-to level, S, for the warehouse and sites is calculated using
equation 1. A model screenshot and excel calculations can be found in Appendix III and
IV.
Equation 1: S = XL+R + kUL+R, where " L = Lead-time (days)
* R = Review period (days)
* XL+R = Demand over lead-time and review period
" k = Safety stock factor
* GL+R = Standard deviation in demand over lead-time and review period
The standard deviation in demand over the lead-time and review period is calculated using equation 2. Table 7 shows the safety stock factor for each corresponding
theoretical cycle service level. Cycle service level is calculated as the number of stock-out occasions in a year period. An increase in safety stock factor leads to an increase in the order-up-to level.
Equation 2: UL+R = [E(LT+R)aD2 + E(D) 2JLT+R2 2, where
* E(LT+R) = Expected lead-time plus review period (days) ft = Standard deviation in demand per day
* E(D) = Expected demand per day
* GLT+R = Standard deviation of lead-time plus review period
Table 7: Safety Stock Factor
Safety Stock Factor Theoretical Cycle Service Level
1.28 90% 1.41 92% 1.55 94% 1.75 96% 2.05 98% 3.72 99.99% = 100%
As mentioned, orders at the national level, which go through multiple donor organizations, are placed once at the beginning of the year. Shipments from the various suppliers arrive periodically throughout the year. A major assumption in the model is
that these shipment quantities to the warehouse can be adjusted according to inventory levels at a given time. It is extremely difficult to predict and plan for yearly order quantities that will yield acceptable service levels. Countries, bureaucracy and finance permitting, should move towards a more flexible ordering system. This model uses an (R,S) policy to determine shipment quantities to the warehouse. If this operationally is unfeasible, the results from this simulation can be applied through back calculations to better determine annual shipment sizes.
6.3 Scenario Testing
Different scenarios were tested to see how they affect bottom-line metrics. The performance measures are average inventory level, cycle service level (CSL), and missed monthly treatment dosages. These metrics have important economic implications as discussed in chapter 5. Each model run includes data for 3 years. The warehouse and sites are originally stocked with enough inventories to meet order-up-to requirements for a particular cycle service level. Average inventory level is calculated over the last two years. Scenario results are computed by running the simulation 10 times and then averaging over all results. The following is a list of scenarios tested:
" Scenario 1: Baseline Comparison
* Scenario 2: Increased Patient Demand
" Scenario 3: Increased Site Order Placement Probability
" Scenario 4: Decreased Lead-Time Variability
" Scenario 5: Decreased Shipment Shrinkage
Scenario 1 compares simulation cycle service level results with theoretical cycle service level expectations. Scenarios 2 through 5 are factors that countries can work to improve. These factors affect the key performance measures analyzed in this study. The scenarios are tested using order-up-to levels that yield a theoretical cycle service levels of 99.99%. Site results are computed by averaging simulation results from both treatment
administering locations.
6.4 Scenario Results
6.4.1 Baseline Comparison
In scenario 1, Baseline Comparison, the added externalities, e.g., shrinkage and order placement probability, yielded cycle service levels that were lower than theoretical expectations. See table 8 for order-up-to levels corresponding to each safety stock factor and figure 6 for results. Order-up-to levels were calculated using equations (1) and (2) from above. Simulated warehouse cycle service levels were on average about 4% lower than theoretical values and site cycle service levels about 14% lower. This discrepancy was due to factors incorporated in the model that are not typical considered in normal
supply chain operations.
Table 8: Inventor Levels Corresponding to Each Safety Stock Factor Theoretical Cycle DC Order-Up-To Level Site Order-Up-To Level
Service Level (monthly dose.) (fontly doses)
90% 7,413 2,575 92% 7,500 2,598 94% 7,605 2,625 96% 7,743 2,660 98% 7,957 2,716 100% 9,130 3,018
Simulated Cycle Service Level Comparison 105% 100% >* 95%- -2-28_ . 80% . 70% 65%-60% -1.28 1.41 1.55 1.75 2.05 3.72
Safety Stock Factor
-.- Theoretical -+ Warehouse Results Administering Site Results
Figure 6: Scenario 1 - Baseline Comparison Results
Warehouse inventory policies required order-up-to levels of over 10 months-of-supply (15,000 doses) for a simulated cycle service level of 99%. Simulated average inventory
levels for this were nearly 2.7 times more than the results from a safety stock factor of 3.72 (theoretical CSL = 3.72). See figure 7 on the following page. Similarly, more than
8 months of supply (6,000 doses) were required at the administering sites. This yielded
an average inventory level of 7,943 monthly treatment dosages, which was 4 times greater than the amount of inventory needed for a CSL of 84.9%. 84.9% was the
resulting simulation site service level with a safety stock factor of 3.72 (theoretical CSL = 99.99%). Again, these differences in simulation and expected results were due to system
complexities. See figure 8. The graphs in figure 7 and 8 clearly illustrate the trade-off of purchasing and holding excess inventory for higher service levels.