HAL Id: hal-01329353
https://hal.sorbonne-universite.fr/hal-01329353
Submitted on 9 Jun 2016
HAL is a multi-disciplinary open access
archive for the deposit and dissemination of sci-entific research documents, whether they are pub-lished or not. The documents may come from teaching and research institutions in France or abroad, or from public or private research centers.
L’archive ouverte pluridisciplinaire HAL, est destinée au dépôt et à la diffusion de documents scientifiques de niveau recherche, publiés ou non, émanant des établissements d’enseignement et de recherche français ou étrangers, des laboratoires publics ou privés.
Distributed under a Creative Commons Attribution| 4.0 International License
Internet-Based European Influenza Surveillance
Platform Influenzanet
Paolo Bajardi, Alessandro Vespignani, Sebastian Funk, Ken T.D. Eames,
John Edmunds, Clément Turbelin, Marion Debin, Vittoria Colizza, Ronald
Smallenburg, Carl E. Koppeschaar, et al.
To cite this version:
Paolo Bajardi, Alessandro Vespignani, Sebastian Funk, Ken T.D. Eames, John Edmunds, et al.. Determinants of Follow-Up Participation in the Internet-Based European Influenza Surveillance Plat-form Influenzanet. Journal of Medical Internet Research, JMIR Publications, 2014, 16 (3), pp.e78. �10.2196/jmir.3010�. �hal-01329353�
Original Paper
Determinants of Follow-Up Participation in the Internet-Based
European Influenza Surveillance Platform Influenzanet
Paolo Bajardi1,2,3, PhD; Alessandro Vespignani3,4,5, PhD; Sebastian Funk6, PhD; Ken TD Eames6, PhD; W John Edmunds6, PhD; Clément Turbelin7,8, MD; Marion Debin7,8; Vittoria Colizza7,8, PhD; Ronald Smallenburg9; Carl E Koppeschaar9; Ana O Franco10, PhD; Vitor Faustino10; Annasara Carnahan11, MPH; Moa Rehn11, MPH; Daniela Paolotti3, PhD
1GECO - Computational Epidemiology Group, Department of Veterinary Sciences, University of Torino, Torino, Italy 2Complex Systems Unit, Molecular Biotechnology Center CSU, University of Torino, Torino, Italy
3Institute for Scientific Interchange Foundation, Torino, Italy
4Laboratory for the Modeling of Biological and Socio-Technical Systems, Northeastern University, Boston, MA, United States 5Institute for Quantitative Social Sciences, Harvard University, Cambridge, MA, United States
6London School of Hygiene and Tropical Medicine, London, United Kingdom
7INSERM, UMR-S 1136, Institut Pierre Louis d’Epidémiologie et de Santé Publique, F-75013, Paris, France
8Sorbonne Universités, UPMC Univ Paris 06, UMR-S 1136, Institut Pierre Louis d’Epidémiologie et de Santé Publique, F-75013, Paris, France 9Science in Action BV, Amsterdam, Netherlands
10Instituto Gulbenkian de Ciência, Oeiras, Portugal 11Public Health Agency of Sweden, Stockholm, Sweden
Corresponding Author:
Daniela Paolotti, PhD
Institute for Scientific Interchange Foundation via Alassio 11/c Torino, Italy Phone: 39 011 6603090 Fax: 39 011 6600049 Email: daniela.paolotti@isi.it
Abstract
Background: “Influenzanet” is a network of Internet-based platforms aimed at collecting real-time data for influenza surveillance
in several European countries. More than 30,000 European volunteers participate every year in the study, representing one of the largest existing Internet-based multicenter cohorts. Each week during the influenza season, participants are asked to report their symptoms (if any) along with a set of additional questions.
Objective: Focusing on the first influenza season of 2011-12, when the Influenzanet system was completely harmonized within
a common framework in Sweden, the United Kingdom, the Netherlands, Belgium, France, Italy, and Portugal, we investigated the propensity of users to regularly come back to the platform to provide information about their health status. Our purpose was to investigate demographic and behavioral factors associated with participation in follow-up.
Methods: By means of a multilevel analysis, we evaluated the association between regular participation during the season and
sociodemographic and behavioral characteristics as measured by a background questionnaire completed by participants on registration.
Results: We found that lower participation in follow-up was associated with lower educational status (odds ratio [OR] 0.80,
95% CI 0.75-0.85), smoking (OR 0.64, 95% CI 0.59-0.70), younger age (OR ranging from 0.30, 95% CI 0.26-0.33 to 0.70, 95% CI 0.64-0.77), not being vaccinated against seasonal influenza (OR 0.77, 95% CI 0.72-0.84), and living in a household with children (OR 0.69, 95% CI 0.65-0.74). Most of these results hold when single countries are analyzed separately.
Conclusions: Given the opportunistic enrollment of self-selected volunteers in the Influenzanet study, we have investigated
how sociodemographic and behavioral characteristics may be associated with follow-up participation in the Influenzanet cohort. The study described in this paper shows that, overall, the most important determinants of participation are related to education
and lifestyle: smoking, lower education level, younger age, people living with children, and people who have not been vaccinated against seasonal influenza tend to have a lower participation in follow-up. Despite the cross-country variation, the main findings are similar in the different national cohorts, and indeed the results are found to be valid also when performing a single-country analysis. Differences between countries do not seem to play a crucial role in determining the factors associated with participation in follow-up.
(J Med Internet Res 2014;16(3):e78) doi:10.2196/jmir.3010
KEYWORDS
participatory surveillance; Internet; influenza
Introduction
The Internet is an increasingly used tool in epidemiological data collection, especially for recruitment and follow-up of large cohorts. Successful examples of this approach include the Millennium Cohort Study [1], the Nurses and Midwives e-Cohort Study [2], the Internet-based Pregnancy Planning Study (“SnartGravid”) [3], the participatory nutritional study Nutrinet [4], and the newborn cohort NINFEA [5]. Some studies have systematically examined the advantages of the Internet-based approach [6,7], mostly in terms of the reduction of costs and time required for the data collection. Moreover, an unknown proportion of individuals with symptoms do not seek health care, and this proportion may vary with age, sex, or other social groups. Health care-seeking behavior also varies between countries and may change over the course of an epidemic. There is currently no method for systematically assessing health care usage. The use of the Internet-based cohorts can help to overcome this issue. Here we focus on Internet-based community surveillance of influenza-like-illness (ILI) as a means of gathering epidemiological data from the general population in a participatory fashion. In particular, we will study how the characteristics of individuals who register for the surveillance system are related to their involvement over the course of a surveillance season.
Influenza-like illness in Europe is monitored by means of nationwide networks of sentinel General Practitioners (GPs) detecting only medically attended ILI cases. Internet-based community surveillance of influenza can help to determine the disease burden [8], time trends and seasonality, and to characterize care-seeking and treatment behavior [9] and patterns of absenteeism [10]. Internet-based systems can thus enhance traditional GP-based surveillance and support the interpretation of recorded data, both for pandemic and seasonal influenza [8,9].
Collection of data related to influenza-like symptoms using an Internet platform is ongoing in several European countries: since 2003 in the Netherlands and Belgium [11], since 2005 in Portugal [12], 2008 in Italy, and 2009 in the United Kingdom [8,9]. Starting during the influenza season of 2011-2012, for the first time a network of Internet-based surveillance systems, called Influenzanet [13], has been active in seven European countries (the Netherlands, Belgium, Portugal, Italy, the United Kingdom, Sweden, and France), each using the same platform with the aim of gathering data across different countries in a standardized way, to monitor ILI in the community in real-time,
track vaccine effectiveness [10,14], and to estimate risk factors for ILI.
In the seven countries, epidemiological data are collected with the participation of a self-selected cohort of volunteers followed over the influenza season. The success of the data collection strongly depends on the regular participation of the volunteers. Here, we investigate the determinants of participation in follow-up of volunteers enrolled in the Influenzanet platforms during the influenza season of 2011-2012.
Methods
Any resident of a country where Influenzanet is implemented can be involved in the influenza data collection by registering through the national Web page [15-20]. In each country, identical questionnaires are implemented with questions about respiratory symptoms, access and utilization of care and self-medication, uptake of vaccines, attitudes to influenza vaccines, and absenteeism. For the sake of clarity in the following, the term “users” will indicate all the individuals who have registered with the platform and possess a username and a password, regardless of their subsequent activity during the influenza season.
Upon registration, users are invited to complete a background questionnaire containing various sociodemographic, medical, geographic, and behavioral questions. In particular, the background questionnaire covers age, gender, household size and composition, location of home and workplace, education level, occupation, vaccination status for the previous and present influenza season, the presence of a chronic disease, possible pregnancy, and other issues (see the complete list of questions in Multimedia Appendix 1). Users are reminded weekly, via an email newsletter, to report their health status through a brief symptoms questionnaire, whether or not they experienced any symptoms since the last time they visited the platform. Users who report the presence of symptoms are asked some follow-up questions about the symptoms’ onset date, about their health care-seeking behavior, medications taken for that particular episode of illness, and time off work/school. The weekly newsletter contains also a summary of the latest influenza facts and news to maintain users’ interest in the questionnaire. Users can also create accounts on behalf of other members of their family/household, thus enabling, for instance, parents to record data for their children.
To study the determinants of participation in follow-up, we analyzed the behavior of users over the course of an influenza season, focusing on their propensity to return to the platform
and provide information about their health status. Information collected in the background questionnaire allows us to study how the sociodemographic characteristics of participants are related to participation in follow-up. The study sample here consisted of all the Influenzanet volunteers in the seven European countries who contributed at least one symptoms questionnaire during the 2011-2012 influenza season and who inserted their own data. Since users can also create accounts on behalf of other people of their family/household, we discarded users whose information was reported to have been provided by someone else (eg, a husband whose questionnaires are filled in by his wife). Likewise, we did not consider subjects less than 15 or more than 70 years old, on the assumption that a different participant may have managed their account. In fact, more than 400 children younger than 15 years old and more than 200 individuals older than 70 years have their own account (ie, their own username and password to access the platform). This is a legacy from previous seasons when some of the platforms had the requirement that each individual have his/her own account even if it was managed by someone else. Therefore, we did impose the additional constraint on the volunteer’s age in an attempt to ensure, as far as possible, that we were considering volunteers who manage their own accounts.
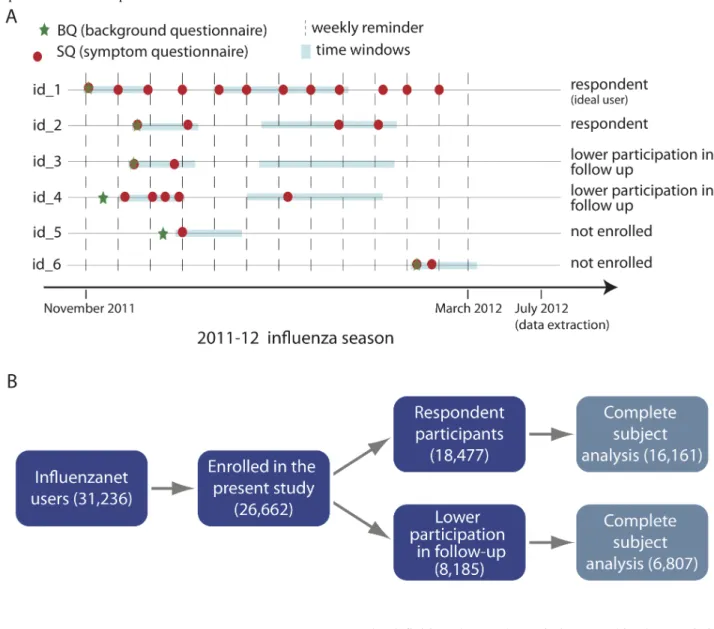
From the study sample, we considered as “enrolled participants”, those participants eligible to be included in the analysis presented here, those who completed their first symptoms questionnaire at least 60 days before the end of the monitoring season, and completed at least one additional symptoms questionnaire within 15 days of the first symptoms questionnaire. From enrolled participants, we considered as “participants in follow–up” or “respondent participants” (either terms will be used in the following), those individuals who filled in at least two symptoms questionnaires during the time window of 30 to 60 days after their first symptoms questionnaire.
Otherwise, the enrolled participants were considered to have a lower participation in the follow-up (see Figure 1).
In order to properly follow the unfolding of the seasonal epidemic and collect data that can be compared with the sentinel-based surveillance (which aggregates data on a weekly basis), users were asked to fill in a symptoms questionnaire each week. However, although completing the symptoms questionnaire only took a couple of minutes each week, there were numerous missing reports. Nevertheless, many individuals who missed a week did not drop out of the study; instead, they updated their health status more infrequently but they continued to provide useful information. On the other hand, some individuals registered on the website just to explore the website and its functionalities and never updated their health status; these individuals are not considered to be enrolled in the study. The definitions used for enrolled participants and participants involved in the follow-up, though by necessity somewhat arbitrary, were chosen to capture behavior that would generate a flow of useful information throughout the season.
By means of a multilevel analysis, we evaluated the association between participation in follow-up during the season and sociodemographic and behavioral characteristics collected in the background questionnaire. A multilevel analysis is generally used when the set of values of a categorical predictor variable are seen not as the complete set but rather as a random sample of all values, in order to allow inferences over a wider population than is possible with regression or other general linear model methods. In this case, we considered the follow-up participation as a dichotomous outcome, the sociodemographic and behavioral characteristics as independent variables, and the country variability as a random effect. We used as independent variables: gender, age, education level, household composition, smoking, presence of a chronic condition, and vaccination status. For each variable, we used the levels shown in Textbox 1. Textbox 1. Levels used on the independent variables for the multilevel analysis.
• gender: male, female
• age (years): 15-30, 31-40, 41-50, 51-60, 61-70
• smoking: yes (smoking occasionally or daily), no (never smoked or quit smoking)
• education level: no formal qualification (final stage of compulsory education not completed), secondary/high school education (highest level completed was the final stage of compulsory education or the high school diploma), university degree (Bachelor’s or a higher degree), and still in education (this was not a mutually exclusive category per se, as users were asked, if still in education, to select also the highest level of education achieved; we thus performed a sensitivity analysis considering this category as a missing value and obtaining very similar results)
• presence of a chronic condition/disease: yes (regularly taking medications for asthma, diabetes, lung disorder, heart disorder, kidney disorder, or an immune-compromising condition), no
• vaccination against seasonal influenza for 2011/12 season: yes, no • household with children (≤18 years old): yes, no
In the multilevel analysis, each variable was adjusted against all the others as potential confounders for the outcome. Since some subject records for the various independent variables were missing, we used a complete-subject analysis to deal with such missing records; thus, the multilevel regression was performed only on those enrolled individuals who provided information for all the considered variables. The education level was asked only to participants above 15 years old, and therefore those with
15 years old are excluded from the multivariate analysis. The reference age group was chosen to be the one with more participants in the total population (51-60 years old) in order to reduce the estimates of confidence intervals. Given the relatively small number of clusters (ie, countries), we verified that a logistic regression where the countries are considered as dummy variables led to results comparable with those obtained with the multilevel regression in terms of strength of association (ie,
odds ratios) and significance (P value). Data were analyzed using Stata software, version 11.0.
In the United Kingdom, the Flusurvey study was approved by the London School of Hygiene and Tropical Medicine Ethics Committee (Application number 5530). In Sweden, the Influensakoll study was approved by the Stockholm Regional Ethical Review Board (Dnr. 2011/387-31/4). In France, the Grippenet study has been approved by the Comité consultatif sur le traitement de l’information en matière de recherche (CCTIRS, Advisory committee on information
processing for research, authorization 11.565), and by the Commission Nationale de l’Informatique et des Libertés (CNIL, French Data Protection Authority, authorization DR-2012-024). In all the participating countries, the study was conducted in agreement with national regulations on privacy and data collection and treatment. Informed consent was obtained from individuals who participated in the study described in this article that the information collected through their data may be used for scientific purposes and published.
Figure 1. Panel A: Illustration of study definitions for enrollment and follow-up participation. Definition for enrollment: first symptoms questionnaire (SQ) at least 60 days before end of monitoring season and at least one more SQ within 15 days from first SQ; Definition for follow-up participation: at least two SQs during time window of 30 to 60 days after first SQ. Panel B: The numbers of Influenzanet users and enrolled participants, obtained applying the enrollment definition given in Panel A, are shown. The final sample on which the multilevel regression was performed, after the complete-subject exclusion of individuals with missing records, was of 22,968 enrolled individuals who provided information for all the variables. Among these, after applying the definition for follow-up participation given in Panel A, 16,161 were respondent participants and 6,807 had a lower participation in the follow-up.
Results
Overall, 31,236 individuals registered and completed at least one symptoms questionnaire during the influenza season of 2011-2012, of whom 28,644 were aged between 15 and 70 years old, thereby comprising the sample in this study. Among these, there was a total of 26,662 enrolled participants, according to
the definition above. The sociodemographic characteristics of enrolled participants are shown in Figure 2 (gender, age, education level, household composition, smoking, presence of a chronic condition, and vaccination status).
For each country, the numbers of enrolled participants and follow-up respondents are shown in Table 1. After the complete-subject exclusion of individuals with missing records,
the final sample on which the multilevel regression was performed was 22,968 enrolled individuals who provided information for all the variables (86.15% of all enrolled participants, 22,968/26,662).
The proportion of respondent participants varies between 43% and 79% across the national platforms. The Dutch cohort represents almost half of the entire Influenzanet cohort (46.97%, 12,524/26,662), while the sample sizes of the others studies range between 1152 (Portugal) and 3834 (Belgium) individuals. For comparison, we report in Table 2the information regarding Internet access in each country (ie, the fraction of Internet users with respect to the general population).
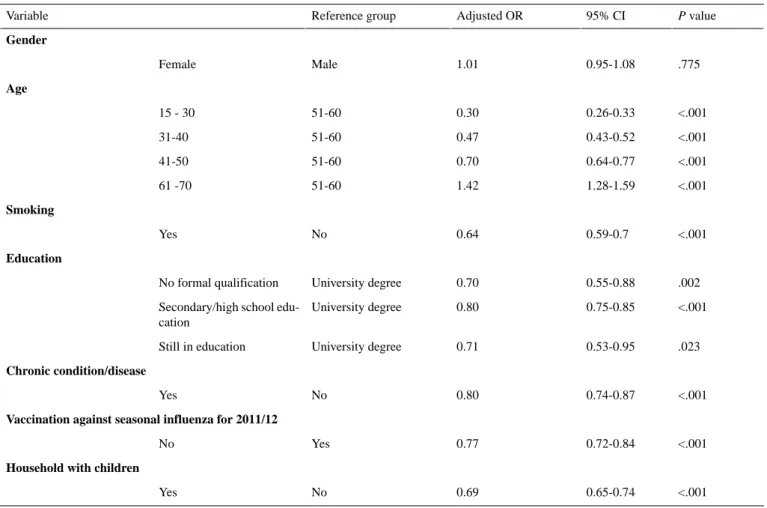
A P value of <.001 associated with the likelihood-ratio test allows us to reject the null hypothesis that the between-cluster (ie, between country) variance is 0, thus confirming that a multilevel analysis is required. The results of the multilevel analysis are shown in Table 3.
The multilevel results show that men and women do not differ significantly in terms of follow- up participation. Holding a university degree, non-smoking behavior, having received an influenza vaccination, and increased age are associated with a higher participation in follow-up. Presence of a chronic health condition and living with children are associated with lower participation in follow-up.
We performed a separate analysis for each country by calculating both the crude and adjusted odds ratio for being a follow-up participant using the same variables that were used for the random effects multilevel analysis. Results are shown in Figure 3.
The adjusted results in Figure 3 (and Table 4 in Multimedia Appendix 2) indicate that for all the “n” countries where a significant association was obtained, participation at follow-up was positively associated with being: non-smoker (n=7 countries), older than 60 years (n=5), vaccinated against seasonal influenza (n=4), not having a chronic condition (n=3), having a university degree (vs secondary/high school, n=3; or vs having no formal education, n=2), and being female in the United Kingdom, while being male in France.
To assess the suitability of our definitions of enrollment and participation in follow-up, and to test the possible sensitivity of the results to the details of the definitions, we tested a slightly stricter definition for enrollment and follow-up participation, requiring one additional symptoms questionnaire for “enrollment”, and shifting the time window for “follow-up participation” to 45 to 75 days (instead of 30 to 60 days) after the first symptoms questionnaire. Similar conclusions were obtained for the determinants of follow-up participation when using the stricter definition for enrollment and follow-up participation (results not shown).
Table 1. Cohort size and participation in the seven countries considering two different enrollment definitions.
Participants not involved in follow-up, n (%) Respondent participants, n (%) Enrolled participants Country 1193 (56.89) 904 (43.11) 2097 Sweden 991 (45.65) 1180 (54.35) 2171 United Kingdom 2835 (22.64) 9679 (77.28) 12,524 Netherlands 792 (20.66) 3042 (79.34) 3834 Belgium 1313 (37.09) 2227 (62.91) 3540 France 697 (51.48) 657 (48.52) 1354 Italy 364 (31.60) 788 (68.40) 1152 Portugal 8185 (30.70) 18,477 (69.30) 26,662 Total
Table 2. General population and fraction of Internet users for each country in the cohort.
Penetration (% population) Internet users (30 June 2013) Population (2012 est.) Country 92.73 % 8,441,718 9,103,788 Sweden 83.64% 52,731,209 63,047,162 United Kingdom 92.94 % 15,549,787 16,730,632 Netherlands 81.33 % 8,489,901 10,438,353 Belgium 79.58 % 52,228,905 65,630,692 France 58.44 % 35,800,000 61,261,254 Italy 55.19 % 5,950,449 10,781,459 Portugal
Table 3. Random effect multilevel logistic regression performed on the set of enrolled individuals. P value 95% CI Adjusted OR Reference group Variable Gender .775 0.95-1.08 1.01 Male Female Age <.001 0.26-0.33 0.30 51-60 15 - 30 <.001 0.43-0.52 0.47 51-60 31-40 <.001 0.64-0.77 0.70 51-60 41-50 <.001 1.28-1.59 1.42 51-60 61 -70 Smoking <.001 0.59-0.7 0.64 No Yes Education .002 0.55-0.88 0.70 University degree No formal qualification <.001 0.75-0.85 0.80 University degree
Secondary/high school edu-cation .023 0.53-0.95 0.71 University degree Still in education Chronic condition/disease <.001 0.74-0.87 0.80 No Yes
Vaccination against seasonal influenza for 2011/12
<.001 0.72-0.84
0.77 Yes
No Household with children
<.001 0.65-0.74
0.69 No
Figure 2. Country-specific distribution of independent variables of enrolled participants: gender, age, education level, household composition, smoking, presence of a chronic condition, and vaccination status (SE = Sweden, UK = United Kingdom, NL = the Netherlands, BE = Belgium, FR = France, IT = Italy, PT = Portugal).
Figure 3. Crude (left panels) and adjusted (right panels) odds ratio by country. An odds ratio greater than 1 is associated with higher likelihood of participation in follow-up ((SE = Sweden, UK = United Kingdom, NL = the Netherlands, BE = Belgium, FR = France, IT = Italy, PT = Portugal).
Discussion
Principal Findings
The first year of Influenzanet data collection took place in seven European countries and saw the participation of tens of thousands of individuals among the general population. Given the opportunistic enrollment of self-selected volunteers in the Influenzanet study, it is important to investigate how sociodemographic and behavioral characteristics may be associated with follow-up participation in the Influenzanet cohort.
The study described in this paper shows that, overall, the most important determinants of participation are related to education and lifestyle: smoking (odds ratio [OR] 0.64, 95% CI 0.59-0.70), lower education level (OR ranging from 0.70 to 0.80 depending on the educational level compared with people holding a university degree), and younger age (OR ranging from 0.30 to 0.70 with an increasing trend in participation with older age) are associated with a lower rate of follow-up participation. People living with children participate in follow-up less than people living alone or in a household consisting only of adults (OR 0.66, 95% CI 0.65-0.74); people who have not been vaccinated against seasonal influenza tend to have a lower participation in follow-up with an associated (OR 0.77, 95% CI 0.72-0.84). We speculate that even though individuals living with children are at greater risk of being infected with ILI and so might be expected to be more motivated to report their health status, the demands of parental care mean that voluntary participation in follow-up could be affected by lack of time. The fact that individuals who chose to be vaccinated are more likely to be follow-up respondents could be because individuals who get the vaccine might also be individuals more concerned
about their personal health and thus more likely to be involved in follow-up throughout the influenza season. Finally, males and females do not have significantly different follow-up participation behavior (OR 1.01, 95% CI 0.95-1.08).
Despite the cross-country variation, the main findings are similar in the different national cohorts, and indeed the results are found to be valid also when performing a single-country analysis. Differences between countries do not seem to play a crucial role in determining the factors associated with involvement in follow-up. The results of the multilevel analysis performed on the Influenzanet cohort as a whole indicates, as expected, that the results regarding smoking, education, and age are similar to what can be found in the literature for traditional non−Internet-based epidemiological studies [21-23] (ie, people who smoke, who are younger, and who have a lower educational level are more likely to have a lower participation in follow-up). This suggests that the self-selection of volunteers through an Internet-based system does not introduce different motivations or determinants for follow-up participation in a study with respect to traditional non−Internet-based epidemiological studies.
The overall percentage of follow-up responders for the different countries varies between 43% and 79%. The platforms running longer (the Netherlands, Belgium, and Portugal) tend to have higher proportions of follow-up responders, suggesting that the participation behavior of Influenzanet users may change over the years as they are more likely to become regular respondents the longer they are involved in the project. It is also worth mentioning that longer-standing systems may well be better able to keep people engaged, due to lessons learned about what works and what does not. Moreover, participants who continue to participate over several years are also more motivated to
participate than those who drop out. In our sample, we did not distinguish between users who registered during the 2011-12 season and users from previous seasons but future work could investigate whether this explains the differences between countries. These differences could be also due to different levels of Internet penetration. The large differences in the proportion of Internet users among the general population, as shown in
Table 2, can be an index of different cultural attitudes in the various countries leading to differing attitudes to participation. Further analysis might also consider the level of engagement, defining the outcome as the proportion of symptoms questionnaires completed out of the maximum possible number of questionnaires that could have been completed since registration, instead of the dichotomous definition of follow-up participation explored in the present analysis. Future work could also investigate whether the determinants associated with participation over several seasons are the same as the determinants identified in the present study.
Conclusions
Previous studies compared the self-selected sample of Influenzanet users in a single country with the general
population [8,11] and it was found that individuals recruited by the platforms are neither demographically nor geographically representative [8]. In this work, we focused on the cohort of enrolled participants from the seven countries during the 2011-12 season as a whole but we did not attempt to make comparisons with the general population. Rather, this is one of the first attempts to describe the determinants of follow-up participation in an Internet-based multi-country cohort study assessing the impact of demographic and behavioral characteristics on follow-up participation.
This study has thus provided information that will help investigators improve the planning of studies for future Internet-based surveillance and to guide enrollment and retention strategies aimed not only at enlarging the samples with motivated participants but also to enhance control over potential biases introduced by differences in follow-up behavior among participants. Our findings can additionally be used to inform the design of engagement campaigns strategically targeted at less self-motivated people to promote their participation and thereby further enhance these surveillance systems by minimizing the selection bias.
Acknowledgments
This work was supported by the EC-ICT IP EPIWORK g.a. no. 231807. Paolo Bajardi gratefully acknowledges the European Research Council Ideas contract n.ERC-2007-Stg204863 (EPIFOR) and the ISI Foundation that partially funded this work. This work was supported by the Master in Epidemiology of the University of Turin and Compagnia di San Paolo. Ken Eames is funded by a Career Development Fellowship supported by the National Institute for Health Research (grant number NIHR-CDF-2011-04-019). The views expressed in this publication are those of the authors and not necessarily those of their funding organizations.
The authors are grateful to Dr Lorenzo Richiardi for fruitful discussions and ideas.
Authors' Contributions
All the authors were involved in the management, design, and editing of the Influenzanet national websites. Paolo Bajardi and Daniela Paolotti conceived the study, analyzed the data, and prepared the manuscript. Ken TD Eames, Clément Turbelin, Marion Debin, Vittoria Colizza, Ana O Franco, Annasara Carnahan, and Moa Rehn also contributed to improve previous versions of the manuscript. All authors read and approved the final manuscript.
Conflicts of Interest
None declared.
Multimedia Appendix 1
Influenzanet questionnaires for 2011-2012.
[PDF File (Adobe PDF File), 466KB- jmir_v16i3e78_app1.PDF]
Multimedia Appendix 2
Factors associated with participation in the single country Influenzanet cohorts. Participation rate, crude, and adjusted odds ratios and confidence intervals are shown for different strata.
[PDF File (Adobe PDF File), 160KB- jmir_v16i3e78_app2.pdf]
References
1. Smith B, Smith TC, Gray GC, Ryan MA, Millennium Cohort Study Team. When epidemiology meets the Internet: Web-based surveys in the Millennium Cohort Study. Am J Epidemiol 2007 Dec 1;166(11):1345-1354 [FREE Full text] [doi:
2. Turner C, Bain C, Schluter PJ, Yorkston E, Bogossian F, McClure R, Nurses and Midwives e-Cohort Group. Cohort Profile: The Nurses and Midwives e-Cohort Study--a novel electronic longitudinal study. Int J Epidemiol 2009 Feb;38(1):53-60 [FREE Full text] [doi: 10.1093/ije/dym294] [Medline: 18202083]
3. Mikkelsen EM, Hatch EE, Wise LA, Rothman KJ, Riis A, Sørensen HT. Cohort profile: the Danish Web-based Pregnancy Planning Study--'Snart-Gravid'. Int J Epidemiol 2009 Aug;38(4):938-943 [FREE Full text] [doi: 10.1093/ije/dyn191] [Medline: 18782897]
4. Nutrinet. URL: https://www.etude-nutrinet-sante.fr/fr/common/login.aspx[accessed 2013-10-08] [WebCite Cache ID 6KDcQcAjF]
5. Richiardi L, Baussano I, Vizzini L, Douwes J, Pearce N, Merletti F, NINFEA cohort. Feasibility of recruiting a birth cohort through the Internet: the experience of the NINFEA cohort. Eur J Epidemiol 2007;22(12):831-837. [doi:
10.1007/s10654-007-9194-2] [Medline: 17955333]
6. van Gelder MM, Bretveld RW, Roeleveld N. Web-based questionnaires: the future in epidemiology? Am J Epidemiol 2010 Dec 1;172(11):1292-1298 [FREE Full text] [doi: 10.1093/aje/kwq291] [Medline: 20880962]
7. Ekman A, Dickman PW, Klint A, Weiderpass E, Litton JE. Feasibility of using Web-based questionnaires in large population-based epidemiological studies. Eur J Epidemiol 2006;21(2):103-111. [doi: 10.1007/s10654-005-6030-4] [Medline:
16518678]
8. Tilston NL, Eames KT, Paolotti D, Ealden T, Edmunds WJ. Internet-based surveillance of Influenza-like-illness in the UK during the 2009 H1N1 influenza pandemic. BMC Public Health 2010;10:650 [FREE Full text] [doi:
10.1186/1471-2458-10-650] [Medline: 20979640]
9. Brooks-Pollock E, Tilston N, Edmunds WJ, Eames KT. Using an online survey of healthcare-seeking behaviour to estimate the magnitude and severity of the 2009 H1N1v influenza epidemic in England. BMC Infect Dis 2011;11:68 [FREE Full text] [doi: 10.1186/1471-2334-11-68] [Medline: 21410965]
10. Eames KT, Brooks-Pollock E, Paolotti D, Perosa M, Gioannini C, Edmunds WJ. Rapid assessment of influenza vaccine effectiveness: analysis of an internet-based cohort. Epidemiol Infect 2012 Jul;140(7):1309-1315. [doi:
10.1017/S0950268811001804] [Medline: 21906412]
11. Friesema IH, Koppeschaar CE, Donker GA, Dijkstra F, van Noort SP, Smallenburg R, et al. Internet-based monitoring of influenza-like illness in the general population: experience of five influenza seasons in The Netherlands. Vaccine 2009 Oct 23;27(45):6353-6357. [doi: 10.1016/j.vaccine.2009.05.042] [Medline: 19840672]
12. van Noort SP, Muehlen M, Rebelo de Andrade H, Koppeschaar C, Lima Lourenço JM, Gomes MG. Gripenet: an internet-based system to monitor influenza-like illness uniformly across Europe. Euro Surveill 2007 Jul;12(7):E5-E6. [Medline: 17991409]
13. Influenzanet. URL: https://www.influenzanet.eu/[accessed 2013-10-08] [WebCite Cache ID 6KDf6DT41] 14. Edmunds WJ, Funk S. Using the internet to estimate influenza vaccine effectiveness. Expert Rev Vaccines 2012
Sep;11(9):1027-1029. [doi: 10.1586/erv.12.88] [Medline: 23151159]
15. Influenzanet. Sweden URL: https://www.influensakoll.se/[accessed 2013-10-08] [WebCite Cache ID 6KDbd2WM1] 16. Influenzanet. United Kingdom URL: https://flusurvey.org.uk/[WebCite Cache ID 6KDbngpBC]
17. Influenzanet. The Netherlands and Belgium URL: https://www.degrotegriepmeting.nl/[WebCite Cache ID 6KDbrmo5v] 18. Influenzanet. France URL: https://www.grippenet.fr/[WebCite Cache ID 6KDc3Sz8T]
19. Influenzanet. Italy URL: https://www.influweb.it/[WebCite Cache ID 6KDbNelMd] 20. Influenzanet. Portugal URL: http://www.gripenet.pt/[WebCite Cache ID 6KDcEt9T7]
21. Goldberg M, Chastang JF, Leclerc A, Zins M, Bonenfant S, Bugel I, et al. Socioeconomic, demographic, occupational, and health factors associated with participation in a long-term epidemiologic survey: a prospective study of the French GAZEL cohort and its target population. Am J Epidemiol 2001 Aug 15;154(4):373-384 [FREE Full text] [Medline: 11495861] 22. Eagan TM, Eide GE, Gulsvik A, Bakke PS. Nonresponse in a community cohort study: predictors and consequences for
exposure-disease associations. J Clin Epidemiol 2002 Aug;55(8):775-781. [Medline: 12384191]
23. Russell C, Palmer JR, Adams-Campbell LL, Rosenberg L. Follow-up of a large cohort of Black women. Am J Epidemiol 2001 Nov 1;154(9):845-853 [FREE Full text] [Medline: 11682367]
Abbreviations
GP: General Practitioners ILI: influenza-like-illness OR: odds ratio
Edited by G Eysenbach; submitted 10.10.13; peer-reviewed by R Chunara, J Olsen; comments to author 15.11.13; revised version received 17.01.14; accepted 03.02.14; published 10.03.14
Please cite as:
Bajardi P, Vespignani A, Funk S, Eames KTD, Edmunds WJ, Turbelin C, Debin M, Colizza V, Smallenburg R, Koppeschaar CE, Franco AO, Faustino V, Carnahan A, Rehn M, Paolotti D
Determinants of Follow-Up Participation in the Internet-Based European Influenza Surveillance Platform Influenzanet J Med Internet Res 2014;16(3):e78
URL: http://www.jmir.org/2014/3/e78/ doi:10.2196/jmir.3010
PMID:24613818
©Paolo Bajardi, Alessandro Vespignani, Sebastian Funk, Ken TD Eames, W John Edmunds, Clément Turbelin, Marion Debin, Vittoria Colizza, Ronald Smallenburg, Carl E Koppeschaar, Ana O Franco, Vitor Faustino, Annasara Carnahan, Moa Rehn, Daniela Paolotti. Originally published in the Journal of Medical Internet Research (http://www.jmir.org), 10.03.2014. This is an open-access article distributed under the terms of the Creative Commons Attribution License (http://creativecommons.org/licenses/by/2.0/), which permits unrestricted use, distribution, and reproduction in any medium, provided the original work, first published in the Journal of Medical Internet Research, is properly cited. The complete bibliographic information, a link to the original publication on http://www.jmir.org/, as well as this copyright and license information must be included.