Ki Chang Songa)and Sotiris E. Pratsinisb)
Institute of Process Engineering, Swiss Federal Institute of Technology, ETH-Zentrum, CH-8092 Zurich, Switzerland
(Received 1 December 1999; accepted 24 July 2000)
Bimodally porous titania powders with controlled phase composition and porosity were made by hydrolysis of titanium tetraisopropoxide (TTIP) and calcination. The extent of calcination was followed by thermogravimetric differential thermal analysis and Fourier transform infrared spectroscopy. The specific surface area (SSA) of the powders ranged from 10 to 500 m2/g as determined by nitrogen adsorption. The SSA
increased by decreasing either the water concentration during hydrolysis or the calcination temperature. The pore size distribution was bimodal with fine intraparticle pore diameters at 1–6 nm and larger interparticle pore diameters at 30–120 nm as determined by nitrogen adsorption isotherms. The particle phase composition as determined by x-ray diffraction ranged from amorphous to crystalline anatase and rutile largely proportional to the calcination temperature and to a lesser extent on the initial H2O/TTIP molar ratio.
I. INTRODUCTION
Titania powders are widely used as a white pigment, an adsorbent, and a major component in many electronic devices (e.g. capacitors and varistors) and have recently become of interest as functional materials such as a pho-tosemiconductor and a photocatalyst.1–5The most com-mon procedures of preparing the titania powders have been based on the hydrolysis of acidic solutions of Ti(IV) salts6,7 or by gas-phase oxidation reaction of TiCl4
at high temperatures.3,8 Recently, however, methods of vapor-phase hydrolysis,9pyrolysis,10and sol-gel synthe-sis2,11 of organic precursors (e.g., titanium tetraisopro-poxide, TTIP) have been developed to synthesize titania nanoparticles with high purity.
Sol-gel synthesis provides a way to make nanopar-ticles by a chemical reaction in solution starting with metal alkoxides as a precursor. An advantage of the sol-gel synthesis is that it is possible to obtain large amounts of powder with a high level of chemical purity.12In this
sol-gel synthesis two simultaneous reactions—hydrolysis and polycondensation—take place when TTIP reacts with water.13These two reactions are sensitive to water
concentration, pH, type and amount of solvent, reaction temperature, and mixing conditions. Among the reaction
variables, especially the water concentration significantly influences the properties of the titania powders as TTIP reacts quickly with water.
Ding et al.15 synthesized titania powders from tita-nium tetrabutoxide (TTB) by controlling the water con-centration during hydrolysis. They reported that the grain size of powders prepared at low H2O/TTB molar ratios
was smaller than that of powders made at high molar ratios. As a result, the anatase to rutile phase transfor-mation temperature for powders made at low H2O/TTB
molar ratios was less than that of powders at high H2O/
TTB ratios. Sasamoto et al.16 also prepared titania powders from TTIP by controlling the initial water concentration. However, they found that the water con-centration had no effect on the anatase to rutile transfor-mation temperature. In contrast, Kato17 reported that
anatase to rutile transformation rate and the specific sur-face area of titania powders increased with increasing H2O/TTIP molar ratios.
Recently, preparation of porous powders with con-trolled pore size and high surface area for uses such as filters, adsorbates, catalysts, and catalyst supports18 has
attracted much interest. The sol-gel synthesis is a very effective method to control pore sizes of inorganic oxide
powders.19 Although many research groups have
ex-plored the characteristics of titania powders prepared by controlling the water concentration during the hydrolysis reaction, to the best of our knowledge, none has exam-ined the influence of water concentration and calcination temperature on the titania pore characteristics. This paper
a)
On leave from Konyang University, Nonsan, South Korea.
b)
Address all correspondence to this author. e-mail: pratsinis@ivuk.mavt.ethz.ch
describes the effect of initial water concentration and calcination temperature on the characteristics of product porous titania powders by thermogravimetric differential thermal analysis, Fourier transform infrared spectroscopy (FTIRS), nitrogen adsorption, and x-ray diffraction (XRD).
II. EXPERIMENTAL A. Sample preparation
Titanium tetraisopropoxide [TTIP; Ti(OC3H7)4, 97%]
supplied by Aldrich was used as a precursor. To moder-ate the high reactivity of TTIP with wmoder-ater, the TTIP was first dissolved in anhydrous ethyl alcohol at a molar ratio of C2H5OH/TTIP ⳱ 5. Hydrolysis was carried out at
room temperature by adding controlled amounts of dis-tilled water slowly to the mixed solution (ethyl alcohol and TTIP) with a vigorous stirring for 1 h. Powders were prepared at molar ratios of H2O to TTIP of 5, 20, 200,
and 1000 and were labeled as R5, R20, R200, and R1000, respectively. On addition of the water into the mixed solution, a slurry containing white titanium hydroxide precipitate was formed. Clear liquid was removed from the flurry by filtering through a filter paper (MN 615, Macherey-Nagel, Du¨ren, Germany) with openings less than or equal to 2–3m in diameter.20The filtered
pow-der was dried at 150 °C for 24 h, followed by calcination at different temperatures ranging from 300 to 800 °C for 1 h at a heating rate of 10 °C/min.
B. Characterization
The powders were analyzed by thermogravimetric dif-ferential thermal analysis (TG-DTA; STA501, Bahr) at a heating rate of 10 °C/min in flowing air. The infrared (IR) spectra of the powders were measured in the range from 500 to 4000 cm−1, using FTIRS (IFS 66v, Bruker,
Karlsruhe, Germany). An x-ray diffractometer (D5000, Siemens, Karlsruhe, Germany) was used for identifica-tion of crystalline species in the calcined powders with Ni-filtered Cu K␣ radiation as the x-ray source for dif-fraction angles 2 between 20 and 60°. The weight frac-tion of rutile or anatase in the titania powders was calculated by21
X⳱ 1/(1 + 0.8IA/IR) ,
where X is the weight fraction of rutile in the powders, while IAand IRare the x-ray integrated intensities of the (101) reflection of anatase and the (110) reflection of rutile. The crystallite sizes (Dhkl) were calculated using Scherrer’s equation:22
Dhkl⳱ K/(Bhklcos ) ,
where is the wavelength and Bhklis the full width at
half maximum, while K is a constant, K ⳱ 1.4. The
specific surface area (SSA) of the powders was analyzed by nitrogen adsorption in a Brunauer–Emmett–Teller
analysis (BET) surface area analyzer (ASAP2010, Mi-cromeritics, Norcross, GA). All powders were degassed at 150 °C prior to actual measurement. The SSA was determined by the multipoint BET method using the adsorption data in the relative pressure (P/P0) range
0.05–0.25. The desorption isotherm was used to deter-mine the pore size distribution using the Barrett, Joyner, and Halender (BJH) method with cylindrical pore size.23
III. RESULTS AND DISCUSSION A. Thermal Analysis
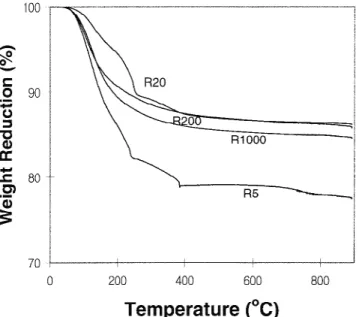
Figure 1 shows the themogravimetric (TG) curves for the R5, R20, R200, and R1000 powders dried at 150 °C. For the R5 and R20 powders, two main zones in weight loss are identified. The first zone from 50 to 250 °C corresponds to the removal of physically adsorbed water and alcohol.24The second zone from 250 to 380 °C
cor-responds to the oxidation of residual organic components and removal of chemically adsorbed water.24 However, for the R200 and R1000 powders, only the first zone is observed, which corresponds to the removal of physi-cally adsorbed water and alcohol.
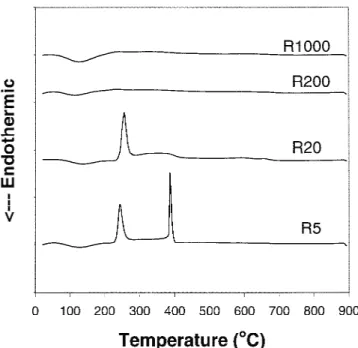
Figure 2 shows the differential thermal analysis (DTA) corresponding to Fig. 1. For the R5 and R20 powders that were prepared at low water concentrations, an intensive exothermic peak is observed at 260 °C, which is associ-ated with the elimination and burning of organic compo-nents. On the other hand, for the R200 and R1000 powders prepared at high water concentrations, no exothermic peak is observed at 260 °C. This indicates that the R5 and R20 powders contain more residual organic components
FIG. 1. Weight reduction of sol-gel made titania powders by TG analysis in flowing air. The powders were made at H2O/TTIP molar ratios of 5, 20, 200, and 1000 and dried at 150 °C.
than the R200 and R1000 powders possibly due to in-complete hydrolysis. For the R5 powder, another exo-thermic peak at 390 °C is observed, corresponding to crystallization24 of amorphous to anatase phase. How-ever, the exothermic peak is not observed for the R20, R200, and R1000 powders that have already had anatase phase before 390 °C which will be shown in the XRD patterns of Figs. 5(b)–5(d).
Figure 3 shows IR spectra of the R5 powder heat-treated at increasing temperatures. The peaks around 3410 and 1640 cm−1correspond to the OH stretching and
bending,25respectively. The intensity of these absorption bands decreases with increasing calcination temperature. The peak at 3172 cm−1for the powder dried at 150 °C is attributed to the hydroxyl group (≡Ti–OH).26 This indi-cates that this powder consists of amorphous titanium hydroxide. This peak does not exist for the powder cal-cined at 400 °C due to the formation of crystalline ana-tase which will be shown in the XRD pattern of Fig. 5(a). Weaker peaks are also observed at 1440 and 1355 cm−1
and at 1160 and 1063 cm−1, which are associated with
the bending of C–H bonds and C–O stretching in TTIP, respectively.25This spectrum indicates that a significant
amount of organic components remains in the R5 pow-der. However, the organic peaks disappear in the spec-trum for 400 °C and this is ascribed to the oxidation of organic components, as confirmed by DTA in Fig. 2. Further heating to 800 °C gives rise to peaks at 695 and 525 cm−1, attributed to rutile.27This is in agreement with the XRD pattern in Fig. 5(a).
Figure 4 shows the IR spectra of the powders made at different initial H2O/TTIP molar ratios and dried at
150 °C. The R5 and R20 powders show the peak at 3172 cm−1 corresponding to the hydroxyl group, while the R200 and R1000 powders do not show it. This is attributed to the different phase composition of the pow-ders dried at 150 °C: the R5 and R20 powpow-ders show amorphous titanium hydroxide [see Figs. 5(a) and 5(b)], while the R200 and R1000 powders exhibit anatase phase [see Figs. 5(c) and 5(d)].
B. Phase composition
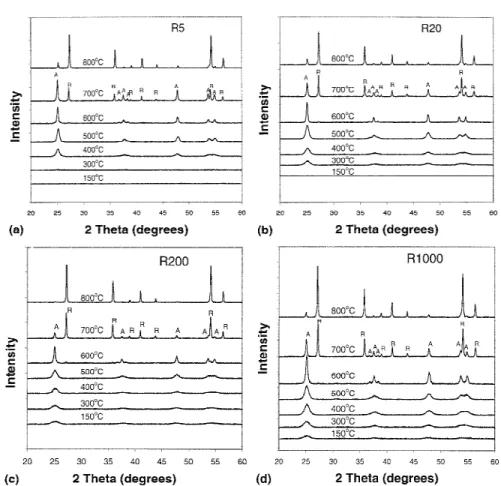
Figures 5(a)–5(d) show the XRD patterns of the R5, R20, R200, and R1000 powders, respectively, at various calcination temperatures. The R5 and R20 powders dried
FIG. 2. DTA curves of sol-gel made titania powders. The powders were made at H2O/TTIP molar ratios of 5, 20, 200, and 1000 and dried at 150 °C.
FIG. 3. FTIR spectra of the R5 powder at various calcination temperatures.
FIG. 4. FTIR spectra of the powders made at different initial H2O/ TTIP molar ratios and dried at 150 °C.
at 150 °C show an amorphous phase, while the R200 and R1000 powders exhibit an anatase phase. According to Terabe et al.,28when the water concentration during hy-drolysis reaction was small, large amounts of unhydro-lyzed alkyls remained in the powder. These alkyls prevent crystallization to anatase so that powders were amorphous. On the other hand, when the initial water concentration was large, the amount of residual alkyls preventing crystallization to anatase was small, so the molecular structure of the powder resembled that of the anatase phase which is more stable than the amorphous phase.28
It is also seen in Figs. 5(a) and 5(b) that the transfor-mation of amorphous to anatase phase occurs at 400 and 300 °C for the R5 and R20 powders, respectively. How-ever, in Figs. 5(c) and 5(d), pure anatase has already appeared at 150 °C for the R200 and R1000 powders and is maintained until 500 °C. It is apparent that the phase transformation temperature from amorphous to anatase depends on the initial H2O/TTIP molar ratio. This is in
agreement with the DTA analysis in Fig. 2. However, the phase transformation from anatase to rutile begins to ap-pear at 600 °C for all powders, regardless of the initial H2O/TTIP molar ratio.
At 700 °C, there is a major change in phase structure depending on the initial H2O/TTIP molar ratio for all
powders. With increasing initial H2O/TTIP ratio from 5
to 200, the intensities of rutile peaks corresponding to the planes (110), (101), and (211) (2 ⳱ 27.5°, 36.2°, and 54.4°, respectively) are bigger, while those of the anatase peaks corresponding to the planes (101), (004), and (200) (2 ⳱ 25.3°, 37.8°, and 48.1°, respectively) are smaller. This result indicates an enhancement of phase transfor-mation from anatase to rutile with increasing initial H2O/ TTIP molar ratio. It is interesting to note that the intensities of the rutile peaks in the R1000 powder are smaller than those in the R200 powder, while the inten-sities of the anatase peaks in the R1000 powder are big-ger than those in the R200 powder, in spite of the increase of the initial H2O/TTIP molar ratio.
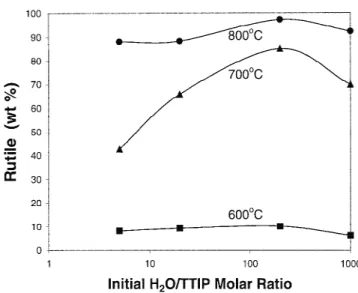
Figure 6 shows the calculated rutile weight fraction in the R5, R20, R200, and R1000 powders calcined at sev-eral temperatures for 1 h. The rutile weight fraction in-creases with the increase of temperature from 600 to 800 °C for all powders. This fraction first shows an ini-tial increase with increasing the iniini-tial H2O/TTIP molar
ratio from 5 to 200 and then exhibits a decrease for the R1000 powder at a constant calcination temperature.
FIG. 5. XRD patterns of sol-gel made titania powders calcined at various temperatures. The powders were made at H2O/TTIP molar ratios of (a) 5, (b) 20, (c) 200, and (d) 1000. The peaks marked A and R represent the anatase and rutile phases, respectively.
This means that the anatase to rutile transformation rate increases with increasing initial H2O/TTIP molar ratio
for the powders made at low water concentrations, but that increase has a limit for the powders made at high water concentrations. This is in disagreement with Ding et al.,15who found the inhibition of the phase transfor-mation of anatase to rutile with the increase of water concentration during the hydrolysis reaction. They car-ried out, however, the experiment under much smaller water concentrations (i.e., the initial H2O/TTIP molar
ratios⳱ 1, 2, 3, 4) compared to this study. Our result is also in disagreement with Kato,17 who reported that the transformation rate of anatase to rutile increased with increasing water concentration in the range of initial H2O/TTIP molar ratios of 20–1000. They investigated, however, the transformation rate on the powders calcined at 900 °C, while we examined that on the powders cal-cined between 600 and 800 °C. This transformation may be caused by the formation of rutile nuclei on the surface of anatase particles followed by the growth of rutile to-ward the interior.29The formation of rutile nuclei can be
accelerated as the grain size becomes smaller.30
Figure 7 shows the evolution of anatase crystal size with calcination temperature for titania powders made at various H2O/TTIP molar ratios. Between 500 and 600 °C
there is a steep increase of anatase crystal size for all powders regardless of initial H2O/TTIP ratio. Kumar et al.31reported that sol-gel made titania showed rapid growth of anatase crystals during the anatase to rutile phase transformation. It is apparent that the grain size of anatase crystals decreases with increasing initial H2O/
TTIP molar ratio from 5 to 200, but it shows a little increase for the initial H2O/TTIP molar ratio of 1000 for
a constant calcination temperature. According to Ding et al.,30 the number of nucleation sites increased with
decreasing grain size, because the surface area, and con-sequently the transformation rate, were increased. On the basis of this result, it is possible to explain that the rutile content increased for the initial H2O/TTIP molar ratios
from 5 to 200 due to the decrease of grain size in anatase crystals, but for the initial ratio of 1000, it decreased again as the grain size increased with increasing water concentration.
C. Specific surface area and porosity
Figure 8 shows the specific surface areas of the pow-ders made at different initial H2O/TTIP molar ratios as a
function of calcination temperature. All powders show a decrease of the specific surface area with increasing cal-cination temperature due to the phase transformation and crystallite growth. It is interesting to observe that the R5 and R20 powders show higher surface areas than the R200 and R1000 powders at 150 °C but exhibit smaller surface areas at 600 °C. This can be explained by the XRD and TG-DTA analyses as follows: At 150 °C, the R200 and R1000 powders had anatase phases, as con-firmed by XRD analysis in Figs. 5(c) and 5(d), and thus, the particle sizes of the powders are bigger than those of the R5 and R20 powders which showed amorphous Ti(OH)4by FTIRS and XRD. Hence, the specific surface areas of the R200 and R1000 powders are smaller than those of the R5 and R20 powders. However, the R5 and R20 powders go through the phase transformation of amorphous to anatase due to the removal of residual organics between 300 and 400 °C and between 150 and 300 °C, respectively, as confirmed by TG-DTA, FTIRS, and XRD analyses in Figs. 1–3 and 5. This results in a rapid reduction of the specific surface areas of the R5 and R20 powders. Thus, at calcination temperatures above
FIG. 6. Calculated rutile weight fractions of the powders made at different initial H2O/TTIP molar ratios and calcined at several tem-peratures for 1 h.
FIG. 7. Average crystallite size of anatase in the R5, R20, R200, and R1000 powders as a function of calcination temperature.
400 °C, the specific surface areas of the R5 and R20 powders become smaller than those of the R200 and R1000 powders.
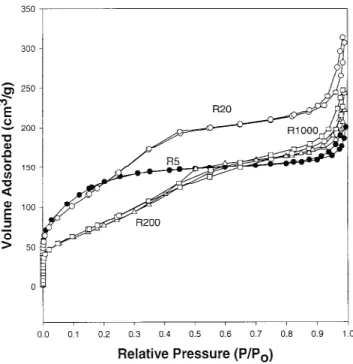
Figure 9 shows the adsorption isotherms of the powders dried at 150 °C and made at various H2O/TTIP
molar ratios. The isotherm of the R5 powder is a com-bination of types I and IV (BDDT classification)32,33 with two very distinct regions: At low relative pressures, the isotherm exhibits high adsorption, indicating that the powder contains micropores (type I). However, at high
relative pressures between 0.8 and 1.0, the curve exhibits a hysteresis loop indicating the presence of mesopores (type IV). The shape of the hysteresis loop is of a type H3, associated with narrow slitlike pores. On the other hand, the other powders (R20, R200, and R1000) have isotherms of type IV which exhibit hysteresis loops mostly of type H3. Thus, the powders are mesoporous and the pores have narrow slitlike shapes. Unlike the isotherm of the R5 powder with one hysteresis loop, the isotherms of the other powders have two hysteresis loops, indicating bimodal pore-size distributions in the mesoporous region.
Figure 10 shows the pore-size distributions of the powders prepared at various initial H2O/TTIP molar ra-tios and dried at 150 °C. All powders show bimodal pore-size distributions consisting of intraaggregated pores with maximum pore diameters from micropores to 3.3 nm and interaggregated pores with maximum pore diameters of ca. 60 nm. According to Kumar et al.,34the bimodal pore-size distributions arose from the hard ag-gregates in the powders. In addition, they reported that there are two types of pores present in the bimodal pore-size distributions. One is fine intraaggregated pores (rep-resented by the hysteresis loop in the lower P/P0range),
and the other is larger interaggregated pores (hysteresis loop in the higher P/P0range). In Fig. 10, the maximum
pore volume of the intraaggregated pores of the R5 pow-der lies in the microporous region (pore diameter less than 2 nm). With increasing of the initial H2O/TTIP mo-FIG. 8. The specific surface area of the R5, R20, R200, and R1000
powders as a function of calcination temperature.
FIG. 9. Nitrogen adsorption isotherms obtained from the powders made at different initial H2O/TTIP molar ratios and dried at 150 °C.
FIG. 10. Pore-size distribution curves of the powders dried at 150 °C after being made at different initial H2O/TTIP molar ratios.
lar ratio, the maximum pore size of the intraaggregated pores shifts into the mesoporous region. However, the maximum pore sizes of the intraaggregated pores in the R200 and R1000 powders do not exhibit significant change compared to those of the R5 and R20 powders. Apparently, for the R5 powder, the particles within the aggregates tend to be packed more closely compared to
those of the other powders and the interstitial voids of the packed primary particles within the aggregates increase with increasing initial H2O/TTIP ratio.
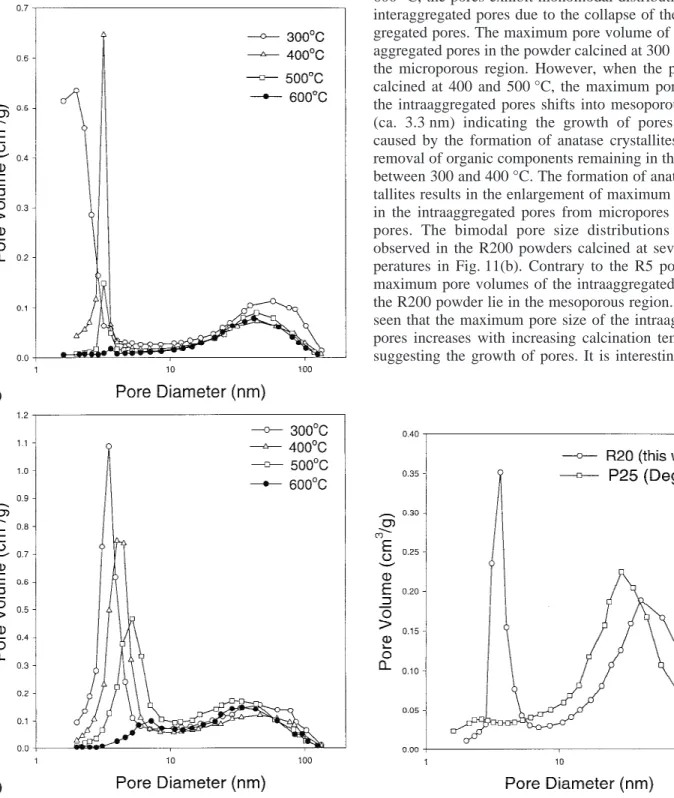
Figures 11(a) and 11(b) show the pore size distribu-tions of the R5 and R200 powders, respectively, calcined at several temperatures. For the R5 powder, the pores show bimodal distributions consisting of the intraaggre-gated and interaggreintraaggre-gated pores from 300 to 500 °C. At 600 °C, the pores exhibit monomodal distribution of the interaggregated pores due to the collapse of the intraag-gregated pores. The maximum pore volume of the intra-aggregated pores in the powder calcined at 300 °C lies in the microporous region. However, when the powder is calcined at 400 and 500 °C, the maximum pore size of the intraaggregated pores shifts into mesoporous region (ca. 3.3 nm) indicating the growth of pores. This is caused by the formation of anatase crystallites and the removal of organic components remaining in the powder between 300 and 400 °C. The formation of anatase crys-tallites results in the enlargement of maximum pore size in the intraaggregated pores from micropores to meso-pores. The bimodal pore size distributions are also observed in the R200 powders calcined at several tem-peratures in Fig. 11(b). Contrary to the R5 powder, all maximum pore volumes of the intraaggregated pores of the R200 powder lie in the mesoporous region. It is also seen that the maximum pore size of the intraaggregated pores increases with increasing calcination temperature suggesting the growth of pores. It is interesting to note
FIG. 11. Pore-size distribution curves of the (a) R5 and (b) R200 powders calcined at several temperatures.
FIG. 12. Comparisons of the pore-size distribution curves of the R20 powder calcined at 500 °C and Degussa’s P25 powder.
that the intraaggregated pores in the R200 powder have not disappeared completely at 600 °C, compared to those in the R5 powder.
Figure 12 shows the pore-size distributions of the R20 powder calcined at 500 °C and Degussa’s P25 tita-nia powder by flame hydrolysis of TiCl4. The P25
pow-der has similar specific surface area (51.2 m2/g) with the R20 powder (58.7 m2/g) but shows a totally different
pore size distribution. The pore structure of the P25 pow-der is monomodal with a maximum for the pore diameter at 31 nm. However, the pore size distribution of the R20 powder shows two maximum values at 3.8 and 50 nm.
IV. CONCLUSIONS
The water concentration during hydrolysis of TTIP plays an important role on the phase and pore structure of product titania powders. When the initial water concen-tration was small, the powder dried at 150 °C was amor-phous Ti(OH)4as residual organic components prevented the crystallization to anatase phase. However, when the initial water concentration was large, the powders dried at 150 °C were anatase. The phase transformation tem-perature of anatase to rutile was independent of the initial H2O/TTIP molar ratio.
All powders dried at 150 °C after being prepared with different H2O/TTIP molar ratios resulted in bimodal pore
size distributions consisting of fine intraaggregated and larger interaggregated pores. The maximum size of the intraaggregated pores in the R5 powder prepared with a low water concentration (H2O/TTIP ⳱ 5) lied in the
microporous region. With increasing water concentra-tion, the maximum size of the intraaggregated pores shifted into the mesoporous region.
The R200 and R1000 powders prepared at high water
concentrations (H2O/TTIP ⳱ 200 and 1000,
respec-tively) showed a gradual decrease of the surface areas with increasing calcination temperature. However, the R5 and R20 powders prepared at low water concentra-tions (H2O/TTIP⳱ 5 and 20, respectively) exhibited the rapid decrease of the specific surface areas between 300 and 400 °C and between 150 and 300 °C, respectively, due to the phase transformation of amorphous to anatase. This resulted in higher surface areas of the R200 and R1000 powders than those of the R5 and R20 powders at 600 °C.
ACKNOWLEDGMENTS
This research was sponsored in part by the SNF (Swiss National Science Foundation) and the KOSEF (Korea Science and Engineering Foundation).
REFERENCES
1. E.J. Mezey, Vapor Deposition (Wiley, New York, 1966), p. 423. 2. E.A. Barringer and H.K. Bowen, Langmuir 1, 414 (1985). 3. M.K. Akhtar, S.E. Pratsinis, and S.V.R. Mastrangelo, J. Am.
Ceram. Soc. 75, 3408 (1992).
4. G.P. Fotou, S. Vemury, and S.E. Pratsinis, Chem. Eng. Sci. 49, 4939 (1994).
5. B. O’Regan and M. Graetzel, Nature 353, 737 (1991).
6. U. Gesenhues and T. Rentschler, J. Solid State Chem. 143, 210 (1999).
7. A. Kato, Y. Takeshima, and Y. Katatae, in Processing Science of Advanced Ceramics, edited by I.A. Aksay, G.L. McVay, and D.R. Ulrich (Mater. Res. Soc. Symp. Proc. 155, Pittsburgh, PA, 1989), p. 13.
8. S.E. Pratsinis, W. Zhu, and S. Vemury, Powder Technol. 86, 87 (1996).
9. F. Kirkbir and H. Komiyama, Chem. Lett. 5, 791 (1988). 10. K. Morishige, F. Kanno, S. Ogawara, and S. Sasaki, J. Phys.
Chem. 89, 4404 (1985).
11. J.H. Jean and T.A. Ring, Langmuir 2, 251 (1986).
12. G.W. Koebrugge, L. Winnubst, and A.J. Burggraaf, J. Mater. Chem. 3, 1095 (1993).
13. M. Kallala, C. Sanchez, and B. Cabrane, Phys. Rev. E 48, 3692 (1993).
14. B.E. Yoldas, J. Mater. Sci. 21, 1087 (1986).
15. X.Z. Ding, Z.Z. Qi, and Y.Z. He, J. Mater. Sci. Lett. 14, 21 (1995).
16. T. Sasamoto, S. Enomoto, Z. Shimoda, and Y. Saeki, J. Ceram. Soc. Jpn. 101, 226 (1993).
17. K. Kato, Chem. Soc. Jpn. 65, 34 (1992).
18. S. Sato, S. Oimatsu, R. Takahashi, T. Sodesawa, and F. Nozaki, Chem. Commun. 22, 2219 (1997).
19. C.J. Brinker and G.W. Scherer, Sol-Gel Science (Academic Press, San Diego, CA, 1990).
20. M.F. Yan and W.W. Rhodes, Mater. Sci. Eng. 61, 59 (1983). 21. R.A. Spurr and H. Myers, Anal. Chem. 29, 760 (1957). 22. B.D. Cullity, Elements of X-ray Diffraction (Addison-Wesley,
Reading, MA, 1978).
23. K.S.W. Sing, D.H. Everett, R.A.W. Haul, L. Moscou, R.A. Pierotti, J. Rouquerol, and T. Siemieniewska, Pure Appl. Chem. 57, 603 (1985).
24. I.A. Montoya, T. Viveros, J.M. Dominguez, L.A. Canales, and I. Schifter, Catal. Lett. 15, 207 (1992).
25. J. Rubio, J.L. Oteo, M. Villegas, and P. Duran, J. Mater. Sci. 32, 643 (1997).
26. T. Lopez, E. Sanchez, P. Bosch, Y. Meas, and R. Gomez, Mater. Chem. Phys. 32, 141 (1992).
27. V.C. Farmer, Infrared Spectra of Minerals (Mineralogical Soci-ety, London, United Kingdom, 1974).
28. K. Terabe, K. Kato, H. Miyazaki, S. Yamaguchi, A. Imai, and Y. Iguchi, J. Mater. Sci. 29, 1617 (1994).
29. H.D. Jang, AIChE J. 43, 2704 (1997).
30. X.Z. Ding, X.H. Liu, and Y.Z. He, J. Mater. Sci. Lett. 15, 1789 (1996).
31. K-N.P. Kumar, K. Keizer, and A.J. Burggraaf, J. Mater. Chem. 3, 1141 (1993).
32. K.S.W. Sing, D.H. Everett, R.A.W. Haul, L. Moscou, R.A. Pierotti, J. Rouquerol, and T. Siemieniewska, Pure Appl. Chem. 57, 603 (1985).
33. S.J. Gregg and K.S.W. Sing, Adsorption, Surface Area and Po-rosity (Academic Press, London, United Kingdom, 1982). 34. K-N.P. Kumar, J. Kumar, and K. Keizer, J. Am. Ceram. Soc. 77,