Jürg Neuenschwander*, Sergio J. Sanabria
a, Philipp Schuetz, Robert Widmann and
Mareike Vogel
Delamination detection in a 90-year-old glulam
block with scanning dry point-contact ultrasound
Abstract: Glued laminated timber (glulam) is known
in timber constructions since more than 100 years. Glu-lam members can deGlu-laminate due to aging and exces-sive changes of temperature and humidity. This results in significantly reduced load bearing capability of the affected structural members. This contribution focuses on the ultrasonic point-contact inspection of gluing plane delamination as a nondestructive method. Ultrasonic measurements on a section of a 90-year-old roofing glu-lam member are presented. The results are compared with manual detection and evaluation of delamination with a feeler gauge, with X-ray computed tomography analyses, and with numerical simulations. Appropriate data evalu-ation of the mechanized ultrasonic results allows the determination of material separation that are deeper than 20 mm in the signature of the surface wave and large-scale delamination ( > 80% of the complete bonding width) in the back-wall echo. Numerical simulations based on the finite-difference time-domain method shed light into the details of the wave propagation and support the experi-mental findings.
Keywords: bonding quality, delamination, glue line, glued
laminated timber, integrity assessment, nondestructive evaluation, point-contact ultrasonics, X-ray computed tomography
aPresent address: Laboratory for Wood Physics and Non Destructive
Testing Methods, Institute for Building Materials, ETH Zurich, Schafmattstrasse 6, CH-8093 Zurich, Switzerland
*Corresponding author: Jürg Neuenschwander, Electronics/
Metrology/Reliability Laboratory, Empa, Swiss Federal Laboratories for Materials Science and Technology, Überlandstrasse 129, CH-8600 Dübendorf, Switzerland, Phone: +41 58 765 4320, e-mail: [email protected]
Sergio J. Sanabria and Philipp Schuetz: Electronics/Metrology/
Reliability Laboratory, Empa, Swiss Federal Laboratories for Materials Science and Technology, Überlandstrasse 129, CH-8600 Dübendorf, Switzerland
Robert Widmann: Structural Engineering Research Laboratory,
Empa, Swiss Federal Laboratories for Materials Science and Technology, Überlandstrasse 129, CH-8600 Dübendorf, Switzerland
Mareike Vogel: Architecture, Wood and Civil Engineering, Berne
University of Applied Sciences, Solothurnstrasse 102, CH-2500 Biel 6, Switzerland
Introduction
Glued laminated timber (glulam) is widely used in the construction of roofing and bridges. Functionality is only given with a sound bonding along the glue line between laminations. Delamination, however, may occur due to improper manufacturing, moisture-induced internal stresses, and long-term loading (Hansson and Larson 2005; Jönsson 2005; Angst and Malo 2010; Bucur 2011). A recent study of 550 failure cases showed that 70% of them were due to cracks in the grain direction and 62% of them occurred at the glue lines (Blass and Frese 2010). The effects of climatic conditions on bondlines can also be demonstrated by nanoindentation (Konnerth and Gindl 2008; Follrich et al. 2010). Nondestructive quality control of the bonding is presently done by visual inspection and with thin feeler gauges (Dietsch and Hösl 2010). The per-formance of ultrasound-based nondestructive techniques has been improved in the last decade (Casado et al. 2012). Conventional ultrasonic contact transducers were used on glulam without coupling agent for the detection of large planar cracks and lamination defects (Dimanche et al. 1994; Dill-Langer et al. 2005). The depth of edge open cracks was estimated with stress wave timing by putting transmitter and receiver transducers on both sides of the crack (Garab et al. 2010; Divos 2011). Recent developments in ultrasonics have led to the application of nondestructive testing methods such as air-coupled scanning (Sanabria et al. 2011a,b,c; Sanabria 2012) or with dry point-contact ultrasound (Hasenstab 2006, 2007; Aicher et al. 2010; Sanabria et al. 2011c). X-ray computed tomography (CT) was applied on solid wood with cracking (Niemz et al. 1997), and it was possible differentiating between glued and delaminated regions in glued structures by CT (Hu and Gagnon 2007). Limited-angle microfocus CT is able to detect air gaps larger than 150 μm in the joint of 100 mm broad spruce lamellas (Sanabria et al. 2011d).
In the study of Sanabria et al. (2011c), a glulam test-block containing artificial flaws (partial absence of glue) was investigated with point-contact ultrasound and large flaws could be detected and imaged. Both the surface wave (SW) C-scan and the back-wall echo C-scan gave
Materials and methods
Sample
An early application of glulam was found in the roofing support of an aircraft hangar that was erected in Lucerne, Switzerland, in 1922 (Figure 1). The whole structure was dismantled only recently. The glu-lam beams exhibit considerable deglu-lamination. The beam originally had been reinforced by external steel clamps, whose color remnants are still visible on the surface (Figure 2a). It was made of 14 lamel-las from Norway spruce (Picea abies Karst.) that were glued together with a Casein adhesive. The dimensions of the cutout and inspected sample was as follows: length (Y direction) 1020 mm, width 146 mm, and height 384 mm. Moisture content: 11.5%; average oven-dried density ρ0: 380 kg m-3. The definition of the lateral sides I and II of
the specimen and the lamella numbering are given in Figure 3a. The bottom-side lamellas (Nos. 1 and 2) had a height of 36 mm and the remaining lamellas (Nos. 3–14) had a height of 26 mm each. Delami-nations that were accessible from the outside were measured manu-ally with a 100-μm-thick and 12-mm-wide feeler gauge. All glue lines were investigated on the lateral sides I and II. The position, length, and depth of the delaminations were recorded.
X-ray CT
A part of the specimen was inspected in a X-ray CT system equipped with a 450 kV X-ray tube. Detection: flat-panel detector (scintillator screen from thallium-doped cesium-iodide with a thickness of 2 mm; scintil-lation light recorded with a CCD camera, Alta U32 from Apogee Imaging Systems (Roseville, CA, USA), via a 45° mirror). Acceleration voltage of the source: 200 kV (current of 3.0 mA; during flat field acquisition, the current was 2.5 mA). A total of 720 projections with an integration time of 2.0 s each were acquired, where the sample was rotated by 0.5° between consecutive images. The reconstructed 3D absorption image has a result-ing voxel size of 167 × 167 × 167 μm3 and contains 1900 × 1900 × 1300 voxels.
Ultrasound setup
A dry point-contact ultrasonic probe was used in conjunction with a mechanical scanner (Figure 2); for details, see Sanabria et al. (2011c)
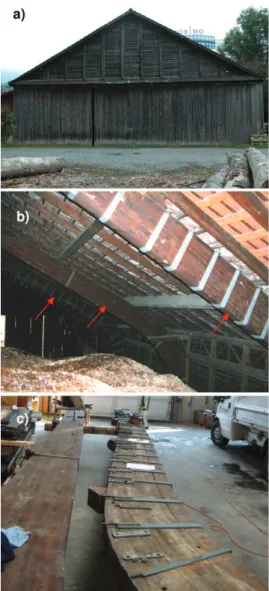
Figure 1 Photographs of aircraft hangar in Lucerne, Switzerland,
erected in 1922. (a) View from the outside. (b) View from the inside: three glulam beams (arrows), reinforced with steel clamps, support-ing the roof are visible. (c) Two glulam beams after dismantlsupport-ing of the construction.
and Sanabria (2012). Pulse-echo measurements: shear wave array transducer (M2502; Acoustic Control Systems Ltd., Moscow, Rus-sia). The transducer (Hasenstab 2006) consists of two groups of 12 point elements, the first acting as a transmitter (Tx) and the second as a receiver (Rx). The two 12 point element groups are electrically connected, so that the same signal is excited in all of them (Tx) and the signals captured in each element are added up (Rx). The elements have ceramic tips and are spring loaded, allowing a defined contact force with the sample even in the case of surface irregularities. A spe-cific scanning system was developed to perform automated lamination defect imaging in glulam. For each scanned position, the transducer was pressed down and then an ultrasound pulse was excited by the Tx and received by the Rx. Next, the transducer was moved up until there was no contact with the sample, and afterwards, it was moved to the next scanning position where the procedure was repeated. The transmitter Tx was excited with a high-voltage pulse (three 50 kHz
cycles, Gaussian, 220 Vpp). The receiver Rx signal (A-scan) was amplified by 40 dB and band-pass filtered (10–100 kHz). The com-puterized scanning system achieved a high repeatability, with < 10% amplitude error (Sanabria et al. 2011c).
The inspection was performed on the lateral surfaces side I and II. All bonding planes B1…B13 were tested individually by positioning all Tx elements on one side of the glue line and all the Rx elements on the other side. Profiles along the length of the beam (Y = 30–990 mm) were obtained by scanning the transducers with 5 mm steps in Y direction. The polarization vector p of the transducer elements was aligned with the fiber direction L (Y) to couple efficiently the shear wave horizontal mode. This mode is most attractive for wood inspection due to its low level of anisotropic energy flux shift from the defied normal insonifica-tion direcinsonifica-tion (Sanabria et al. 2011b; Sanabria 2012). For C-scan presen-tations, the positive maximum amplitude of the A-scan in the selected time gates was calculated and displayed as a 2D image. For the defini-tions of A-, B-, and C-scans, see standard EN 1330-4 (2010).
Numerical simulations
A 2D finite-difference time-domain simulation software was imple-mented in Matlab (Sanabria 2012). The simulations implement lin-ear elastic wave propagation across selected cross-sections of the glulam beam. A specific rotated staggered grid, based on the article of Saenger et al. (2000), allows the stable discretization of air-solid boundaries by direct definition of material properties at each voxel. Pulsed wave propagation is discretized in the time domain with a staggered stress-particle velocity scheme. Perfect matched layers, based on Drossaert and Giannopoulos (2007), allow reducing the discretized air domain around the sample to a two-voxel layer. The
20 b a 20 p||L Tx Rx
Figure 2 (a) Photograph of mechanical setup. Inspection of sample
on side I. The longitudinal axis Y is indicated by an arrow. (b)
Bottom view of point-contact ultrasound transducer. Figure 3 (a) Photograph of cross-section of sample after cutting at
Y = 640 mm. Indicated are the lateral sides (I and II) and the lamella
numbers. A white line was added to the figure giving the definition of the simulated delamination with depth VD in the bonding plane B7 together with the position of transmitting (Tx) and receiving (Rx) elements. (b) Example of a nondestructive X-ray CT cut through the sample at Y = 240 mm. The bonding plane numbers are indicated. A gap of approximately 2 mm is obvious in bonding planes B2 and B3. In lamellas No. 2 and 3, two dark line artifacts due the presence of steel nails are visible (indicated by white arrows).
anisotropic properties of wood were treated as follows: first, an optic scan of a cross-section of the sample was obtained (Figure 3a), then the growth rings at each lamella were fitted to cylinders with cent-ers C1…C14, and the stiffness tensor was locally transformed using the acoustic parameters of spruce from Hörig (1935). In the bonding plane B7, several simulations were run, each simulating a delamina-tion with depth VD in the range of 0 mm to the full width in 10 mm steps. The pixel size was 0.2 mm and the time step was 0.2 μs. The transducer was positioned over B7 with the three transmitting points (Tx) being on one side and the three receiving points (Rx) and on the other side of the delaminations (Figure 3a). The transmitting points (Tx) were implemented as point sources consisting of seven nonzero voxels defining a Gaussian window with σ = 0.1 mm.
Results and discussion
X-ray CT
The main purpose of these measurements was the detec-tion of structural details such as growth rings, nails, and
plete cross-section. This delamination is both detected with the feeler gauge and by ultrasonic inspection (see next section). The present straightforward analysis of the CT data reveals large gaps more than 1 mm. More elabo-rate evaluations would have been necessary to take into account the amplitude modulation due to the growth rings and the nonplanarity of the glue lines. It is estimated that such a sophisticated data treatment could reveal gaps down to approximately 0.5 mm. A few internal steel nails were observed; some of their artifacts are also visible in Figure 3b (white arrows). Other delaminations were too thin to be visible in this image. Overall, the feeler gauge is thinner than the CT pixel size; thus, it is able to detect even thinner delaminations than CT will reveal.
Ultrasonic inspection
The first step of interpretation involves the identification of the ultrasonic echoes. Figure 4 displays the ultrasonic
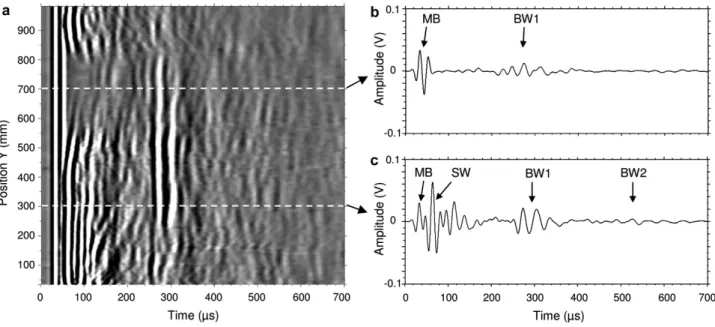
Figure 4 Ultrasonic data of scan along bonding plane B4, insonified from lateral side II. (a) B-scan along the length of the sample. (b) A-scan
at position 700 mm. (c) A-scan at position 300 mm. MB, main bang; SW, surface wave; BW1, first back-wall echo; BW2, second back-wall echo.
back-wall echo (BW2) is observed. Obviously, at certain positions, the SW is present (Figure 4c), and at others, it is absent (Figure 4b). Also, the back-wall echo shows some variation with the Y-position. The wave propagation is influenced by the natural variability of wood. Relevant effects are, for example, variations in (a) mechanical prop-erties between lamellas, (b) energy flux shifts from insoni-fication direction that lead to partial fading at the receiver, (c) wave interference of waves transmitted through early-wood/latewood channels, and (d) wave scattering at knots and to a minor extent at nails (Sanabria 2012).
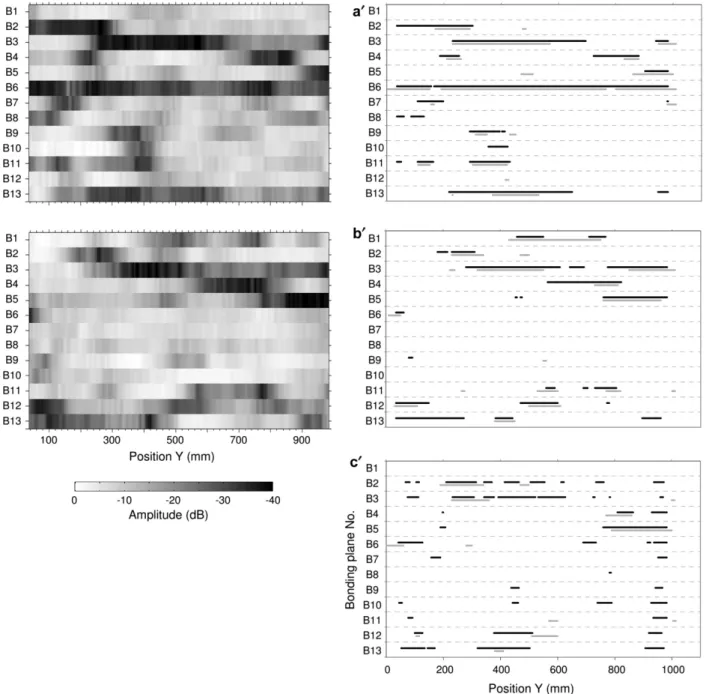
The whole picture of the SW amplitudes is given in the C-scans of Figures 5a and b for both sides I and II of the sample. The data were normalized to the maximum amplitude and are displayed logarithmically in a 40 dB amplitude range. The presence of bonding plane delami-nations at the surface reduces the SW amplitude, which is obvious from Figure 6, where a selection of measurements at four bonding planes is displayed. The thin lines are the SW amplitudes as a function of the length position (Y) and
Figure 5 Ultrasonic C-scans of SW echo (60–110 μs): (a) side I and (b) side II. Comparison between ultrasonic surface echo amplitude with
delamination depth measured with feeler gauge (black lines: echo amplitude < -22 dB, gray lines: delamination depth ≥ 20 mm): (a′) side I and (b′) side II. (c′) Comparison between ultrasonic back-wall echo amplitude with delamination depth measured with feeler gauge (black lines: side II echo amplitude < -21 dB; gray lines: total delamination depth > 80% of total width). Abscissa, length position Y; ordinate, bonding plane number.
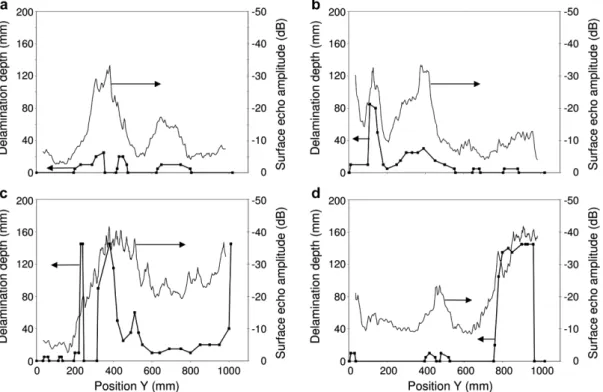
the thick lines are the results of the corresponding feeler gauge measurements of the delaminations. The correla-tion between the two measurement techniques is obvious and it is further displayed in Figure 7 for three bonding planes. The natural variability of the echo amplitude is approximately 15 dB (due to knots, other wood irregulari-ties and surface imperfections). From 0 to 20 mm deep delaminations, there is an amplitude drop from 0 down
to -20 dB. For deeper delaminations, the drop levels off at approximately -30 dB corresponding to the noise floor of the electronics. There are a few outliers at large delami-nations where the measured SW amplitude seems to be too large; if one has a closer look to Figure 6c, one real-izes that there is a short (20 mm long) full delamination at Y = 230 mm. This delamination, however, is too short to be measured with the used transducer array, which has
a total length of 60 mm (four point probes with separa-tion of 20 mm; see Figure 2b). Moreover, the wavelength along the longitudinal direction is approximately 120 mm [f = 50 kHz and c = 5800 m s-1 (Hörig 1935)], which gives an
Figure 6 Comparison of ultrasonic surface echo amplitude (thin line) and depth of delaminations measured with feeler gauge (thick lines).
Arrows point to the appropriate axes. (a) Bonding plane B9 side I. (b) Bonding plane B11 side I. (c) Bonding plane B3 side II. (d) Bonding plane B5 side II.
Figure 7 Correlation between ultrasonic surface echo amplitude
with delamination depth measured with feeler gauge for three different bonding planes (open triangles: B11 side I, open squares: B3 side II, and filled squares: B5 side II). The scattering of the amplitudes of approximately 15 dB is due to the natural variability (knots, other wood irregularities, and surface imperfections). The continuous curve reflects the main trendline. It was determined with a clustering algorithm (20 consecutive points).
order of magnitude for the lateral resolution along the fiber direction. An overview and a comparison of the results of both measurement techniques are given in Figure 5a′ and b′. It shows as black lines the positions where the SW amplitude is below -22 dB together with gray lines where the delamination depth measured with the feeler gauge exceeds 20 mm. On both sides, there is a good agreement (∼80%) between the two measurement techniques. Gaps down to the detection limits by the feeler gauge (100 μm) were easily visible. According to simulations (Sanabria 2012), gaps of 10 μm still provide a contrast more than 20 dB based on longitudinal waves. Shear wave propaga-tion is essentially not supported by fluid media; thus, a higher contrast is to be expected (Krautkrämer and Krau-tkrämer 1986). Therefore, in practice, delaminations are expected to be detected as long as a physical separation between lamellas exists.
Glue line delaminations are also expected to reduce the back-wall echo, which could be verified in the prelimi-nary study of Sanabria et al. (2011c) on a test block with artificial flaws. The reduction of the echoes, however, was less pronounced compared with the SW. Similar results are found on the present glulam block with natural delamina-tions. Again, the ultrasonic results are compared with the feeler gauge data (Figure 5c′). Large ( > 80% of the bonding width) delaminations as found by the feeler gauge are
also indicated by a reduced back-wall echo ( < -21 dB). However, the ultrasonic data reveal additional positions with reduced amplitudes. Large signal attenuation values caused by the heterogeneous material structure can lead to false defect hits. The main anatomic features introduc-ing ultrasound were qualitatively identified in the X-ray CT images. The year ring structure leads to uncertainties in the wave propagation paths, which lead to amplitude fading at the receiver. The higher the ring curvature, the more critical are these effects. Wood knots and strongly cracked solid wood lamellas introduce additional scatter-ing in the ultrasound fields. The metallic nail elements introduced a negligible scattering amount.
Numerical simulation
To understand the experimental results in more detail, numerical simulations of the wave propagation were
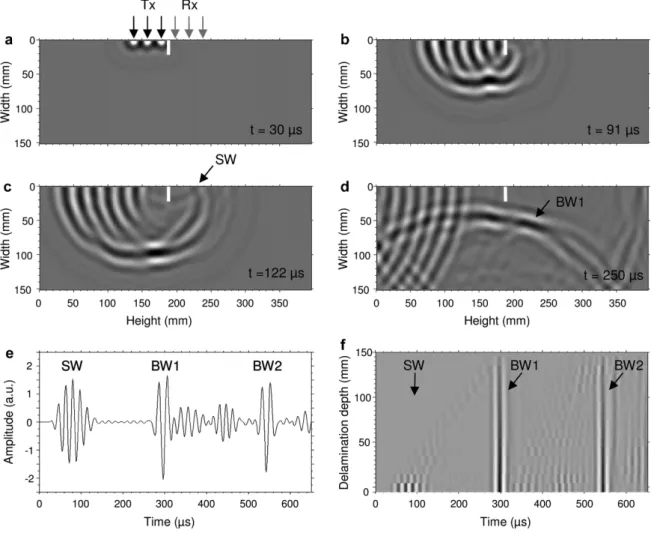
performed for the specific cross-section at Y = 640 mm for several depths of delaminations in bonding plane B7. Figures 8a–d display time snapshots of the wave propaga-tion at four successive instants for a delaminapropaga-tion depth of 20 mm. At 30 μs (a), one perceives the emerging waves from the three transmitter points, which then, at 91 μs (b), have propagated into the bulk and diffracted around the delamination tip to reach the surface. The SW propagates further (c), and in the image at 250 μs (d), the main bulk wave is bounced back from the back-wall (BW1) toward the receiver Rx.
For simulating the receiver signal Rx, the time signals at the three individual receiver positions were added, giving, for example, the A-scan shown in Figure 8e, where the SW and two back-wall echoes (BW1 and BW2) are discernible (depth of delamination = 0 mm). If there is a delamination present, part of the wave travels around the discontinuity giving the first echo (SW). The deeper the crack is the later the echo arrives at Rx and the
Figure 8 Results of numerical simulation of wave propagation. (a–d) Time snapshots of propagating wave in the glulam cross-section with
a delamination depth of 20 mm. The SW and the back-wall reflection (BW1) are indicated (a) 30 μs, (b) 91 μs, (c) 122 μs, and (d) 250 μs). (e) A-scan of receiver Rx in the case of absence of delaminations. (f) B-scan presentation of results with delamination depth as ordinate.
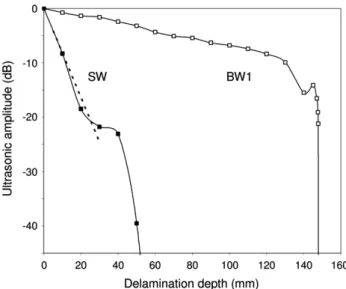
smaller is the amplitude, mainly due to an increased dif-fraction loss. Concurrently, the back-wall echo is reduced in amplitude but much less pronounced. Figure 8f illus-trates the detailed evolution of the surface and the back-wall echoes in function of the depth of the delaminations. Evaluating these data in the same intervals as applied for the experimental data (surface echo: 60–110 μs, BW1: 230–310 μs) leads to Figure 9. This shows that a 20 mm deep delamination reduces the SW amplitude by approxi-mately -20 dB, which very much agrees with the experi-mental findings (Figure 7). For comparison, a linear fit of the experimental data in the range of 5–30 mm is added into Figure 9 (dashed line); the slope is -0.8 dB mm-1.
Deeper delaminations reduce the amplitude further, and at 60 mm, it is below -80 dB. In the experiment, the noise floor is reached already at -30 dB. The back-wall echo is reduced at a much lower rate with increasing delamina-tions depth. Only toward complete width delaminadelamina-tions it drops below -20 dB, being again in agreement with the experimental findings. The small back-wall echo reduction is hence much more sensitive to be masked by natural variability of the wood components. The slight structures in the curves (SW at 40 mm and BW1 at 140 mm) are due wave interference effects. The simula-tions were done assuming zero damping of the ultrasonic waves. The effect of damping on the results in Figure 9 would not be relevant and can be estimated separately. An attenuation coefficient of approximately 0.5 dB cm-1
for the shear horizontal waves can be obtained under the following conditions: two echoes are transmitted through
Conclusion
It was demonstrated experimentally on a section of a 90-year-old glulam member, which contained delami-nations, that point-contact ultrasonic imaging is well suited for detecting these delaminations. The size of the damages is also indicated to a certain degree. Flaw depths larger than 20 mm reduce the SW amplitude by more than -20 dB, which is beyond amplitude variations due to the natural variability of wood (15 dB) and thus is a signifi-cant hint for the presence of a delamination. The back-wall echo is also reduced, but it diagnoses only very deep delaminations ( > 80% gluing plane width). The results of the ultrasonic investigations were compared with detailed feeler gauge measurements and a reasonable good cor-relation was found between the data. The findings were additionally supported by X-ray CT measurements and numerical simulations of the wave propagation in the identical cross-section for varying delamination depths.
More sophisticated analysis of X-ray CT data is planned for further comparison with the ultrasonic results. This will be done especially in view of internal delaminations that are not accessible to the feeler gauge. In situ ultra-sonic inspections are now to be performed. We envisage to address material variations with difference imaging or normalization with respect to reference sections.
Acknowledgements: This research was supported by
the Swiss National Science Foundation under contract 200021-115920. The authors would like to acknowledge the support of Roman Furrer and Tino Loop for the ultrasonic data acquisition, Pascal Keller for the help with numerical simulations, and Daniel Heer and Roland Stäuble for the handling and cutting of the glulam sample.
Received November 14, 2012; accepted March 22, 2013; previously published online April 13, 2013
Figure 9 Results of numerical simulation of wave propagation.
Echo amplitude as a function of delamination depth. Solid dots: surface echo (SW); open dots: back-wall echo (BW1). The dashed line gives a linear fit of the experimental data from Figure 7 in the range of 5–30 mm.
References
Aicher, S., Dill-Langer, G., Stritzke, C. Qualitätsprüfung von Klebefugen in Brettschichtholz mittels Ultraschall, Jahres-bericht MPA, Universität Stuttgart, Germany, 2010. Angst, V., Malo, K.A. (2010) Moisture induced stresses
perpen-dicular to the grain in glulam: review and evaluation of the relative importance of models and parameters. Holzforschung 64:609–617.
Blass, H.J., Frese, M. Schadensanalyse von Hallentragwerken aus Holz. Tech. Rep., Karlsruher Institut für Technologie (KIT), Karlsruhe, Germany, 2010.
Bucur, V. Delamination in Wood, Wood Products and Wood-Based Composites. Springer, New York, USA, 2011.
Casado, M., Acuña, L., Basterra, L.-A., Ramón-Cueto, G., Vecilla, D. (2012) Grading of structural timber of Populus × euramericana clone I-214. Holzforschung 66:633–638.
Dietsch, P., Hösl, M. (2010) Mapping of cracks. In: Methods for the Assessment of Timber Structures, COST Action E55. Modelling of the Performance of Timber Structures. Eds. Dietsch, P., Köhler, J. TUM Munich, Germany. pp. 52–54.
Dill-Langer, G., Bernauer, W., Aicher, S. (2005) Inspection of glue-lines of glued laminated timber by means of ultrasonic testing. In: Proc. 14th Int. Symp. NDT Wood, Eberswalde,
Germany. pp. 49–60.
Dimanche, M., Capretti, S., Del Senno, M., Facaoaru, I. (1994) Validation of theoretical approach for the detection of delamination in glued laminated beams. In: 1st Eur. Symp. NDE Wood. University of Forestry and Wood Science, Sopron, Hungary. pp. 250–260.
Divos, F. (2011) Delamination evaluation of in-service glulam beams and other structural members via ultrasonics. In: Delamination in Wood, Wood Products and Wood-Based Composites. Ed. Bucur, V. Springer, New York, USA. Chapter 17. pp. 353–364.
Drossaert, F.H., Giannopoulos, A. (2007) Complex frequency shifted convolution PML for FDTD modelling of elastic waves. Wave Motion 44:593–604.
EN 1330-4. (2010) Non-destructive testing—Terminology. Part 4: terms used in ultrasonic testing.
Follrich, J., Stöckel, F., Konnerth, J. (2010) Macro- and microme-chanical characterization of wood-adhesive bonds exposed to alternating climate conditions. Holzforschung 64:705–711. Garab, J., Toth, A., Szalai, J., Bejo, L., Divos, F. (2010) Evaluating
glued laminated beams using a nondestructive testing technique. Trans. Famena 34:33–46.
Hansson, M., Larson, H. (2005) Recent failure in glulam structures and their causes. Eng. Fail. Anal. 12:808–818.
Hasenstab, A. (2006) Integritätsprüfung von Holz mit dem zerstörungsfreien Ultraschallechoverfahren, Dissertation (Ph.D. Thesis), Technische Universität Berlin, Germany. Hasenstab, A. (2007) Ultraschall-Echo zur Ortung von Rissen in
Brettschichtholz (BSH). Tagungsband DGZfP Jahrestagung, Fürth, Germany.
Hörig, H. (1935) Anwendung der Elastizitätstheorie anisotroper Körper auf Messungen an Holz. Arch. Appl. Mech. 6:8–14. Hu, L.J., Gagnon, S. (2007) X-ray based scanning technique for
non-destructive evaluation of finger-joint strength. In: Proc. 15th
Int. Symp. NDT Wood. Forest Products Society, Duluth, MN, USA. Jönsson, J.H. (2005) Internal stresses in glulam due to moisture
gradients in the grain direction. Holzforschung 59:18–22. Konnerth, J., Gindl, W. (2008) Observation of the influence of
temperature on the mechanical properties of wood adhesives by nanoindentation. Holzforschung 62:714–717.
Krautkrämer, J., Krautkrämer, H. Werkstoffprüfung mit Ultraschall, Springer, Berlin, Germany, 1986.
Niemz, P., Kucera, L.J., Flisch, A., Blaser, E. (1997) Application of computer tomography (CT) on wood defects and decay. Eur. J. Wood Wood Prod. 55:279–280.
Saenger, E.H., Gold, N., Saphiro, S.A. (2000) Modeling the propagation of elastic waves using a modified finite-difference grid. Wave Motion 31:77–92.
Sanabria, S.J. (2012) Air-coupled ultrasound propagation and novel non-destructive bonding quality assessment of timber composites, Dissertation (Ph.D. Thesis), No. 20404, ETH Zurich, Switzerland.
Sanabria, S.J., Mueller, C., Neuenschwander, J., Niemz, P., Sennhauser, U. (2011a) Air-coupled ultrasound as an accurate and reproducible method for bonding assessment of glued timber. Wood Sci. Technol. 45:645–659.
Sanabria, S.J., Furrer, R., Neuenschwander, J., Niemz, P., Sennhauser, U. (2011b) Air-coupled ultrasound inspection of glued laminated timber. Holzforschung 65:377–387. Sanabria, S.J., Furrer, R., Neuenschwander, J., Niemz, P.,
Sennhauser, U. (2011c) Monitored assessment of structural integrity of multilayered glued laminated timber beams with air-coupled ultrasound and contact ultrasound imaging. In: 17th
International Nondestructive Testing and Evaluation of Wood Symposium. University of West Hungary, Sopron, Hungary, Conf. Proc. pp. 359–366.
Sanabria, S.J., Wyss, P., Neuenschwander, J., Niemz, P.,
Sennhauser, U. (2011d) Assessment of glued timber integrity by limited-angle microfocus X-ray computed tomography. Eur. J. Wood Prod. 69:605–617.