Experimental approach to measuring functional food
consumption for risk factor surveillance
Sigrid Beer-Borst
1,2,*, Michael C Costanza
1and Alfredo Morabia
1,31Division of Clinical Epidemiology, Department of Community Medicine, Geneva University Hospitals, Geneva,
Switzerland:2Bern University of Applied Sciences, Section of Health, Applied R&D in Nutrition and Dietetics, Murtenstrasse 10, CH-3008 Bern, Switzerland:3Center for the Biology of Natural Sciences, School of Earth and
Environmental Sciences, Queens College, City University of New York, New York, USA Submitted 9 April 2007: Accepted 5 January 2008: First published online 7 March 2008
Abstract
Objective: To develop and integrate the assessment of functional foods (FuF; manufactured foods with altered composition carrying a health claim) con-sumption into an existing risk factor surveillance system.
Design: FuF market research followed by an experimental FuF intake study incorporated into an ongoing community-based survey. Concurrent completion of a self-administered semi-quantitative FFQ and a self-administered, qualitative FuF frequency questionnaire (FuFFQ) followed by a face-to-face control step using FuF photographs and combined food group-based data analyses.
Setting: ‘Bus Sante´’ risk factor surveillance programme, Geneva/Switzerland. Subjects: Population-based random sample of 639 residents (52 % women, aged 35–74 years) surveyed from September 2003 to April 2004.
Results: Local Geneva/French neighbourhood market research identified 148 FuF in five major FuF food groups which were compiled into a functional ingredient database. Prior to the face-to-face verification, 210 (33 %) individuals categorized themselves as FuF consumers, 429 (67 %) as non-consumers. The control step revealed that 70 % of the 639 participants were already familiar with the FuF concept, and thus were correctly self-categorized as FuF consumers or non-consumers. For the remaining 30 % of participants the true FuF consumption status was established, resulting in a final number of 285 FuF consumers (45 %; 12 % net increase) and 354 (55 %) non-consumers.
Conclusions: The developed self-administered, brief, qualitative food group-based FuF frequency check list in combination with an FFQ and a photo-assisted control step provides a flexible assessment tool for measuring FuF consumption in the context of a specific fluctuating FuF market and may be applicable to other population settings and times.
Keywords Functional food Dietary assessment methodology Photographs
Functional food (FuF) is a complex, scientifically driven nutritional concept for which no simple, universally accepted definition exists(1). In Europe, the FuF concept includes foods and food components whose composition has been changed and that have been demonstrated to beneficially affect body functions beyond adequate nutritional effects, thus contributing to the promotion of health and well-being and/or the reduction of disease risk(2). FuF does not represent a well-characterized food entity, but instead comprises foods of specific composition from a variety of food groups. The intake of FuF is therefore not necessarily captured and/or identi-fied with currently used dietary assessment instruments, particularly those based on closed food lists such as an FFQ. Moreover, many national food composition tables
do not systematically list FuF and functional non-nutrient ingredients, such as phytosterols or pro- and prebiotics. Food safety researchers usually simulate prospective FuF component intakes on the basis of previously existing population food consumption data and
hypo-thesized functional component concentrations in
specific carrier products(3–5). However, with a steadily growing FuF market(6,7) it is becoming increasingly important to include an assessment of FuF consumption when monitoring diet and health. When queried about their consumption of FuF the general public may be uncertain about the kinds of products being
investi-gated. Special assessment procedures are needed
to identify FuF consumers and to estimate their FuF consumption.
The present report shows how a multistage FuF assessment procedure using FuF photographs was suc-cessfully integrated in the ‘Bus Sante´’ risk factor surveil-lance system (Geneva, Switzerland) without changing existing instruments nor greatly increasing the survey burden on participants.
Methods
The present experimental study (n 639: 332 women, 307 men) was conducted from September 2003 to April 2004 in the Swiss canton of Geneva as an integral part of the community-based Bus Sante´ surveillance programme. From 1993 to 2004, annual random, population-based, cross-sectional samples of the non-institutionalized residents of the canton of Geneva, ages 35–74 years, were monitored for the prevalence of cardiovascular risk factors. Data collection was based on three self-administered ques-tionnaires on health, diet and physical activity that were checked for completeness during an individual appoint-ment at a mobile epidemiological unit and combined with a series of anthropometric, clinical and biological measures, as described elsewhere(8).
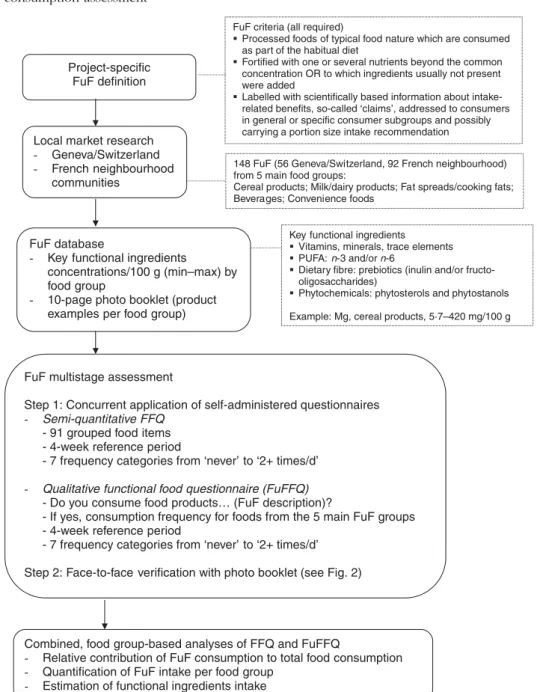
In a first step the project basis was established and the general assessment procedure was planned, including a project-specific FuF definition (Fig. 1). Although many conventional foods such as cereals, fruits and vegetables contain functional ingredients, corresponding to a general understanding of functional food in Europe(1,2)the present study focused on foods for which the composition was altered in such a way that an additional health-promoting effect was claimed for the product by the manufacturer(s). In April 2003 target population food market research was conducted. The Swiss city and canton of Geneva is surrounded by France, and study participants may shop in Geneva and across the border in the nearby French communities. Hence, the two largest and much frequented supermarkets close to major border crossings, out of seven regionally represented French supermarkets, were included in the FuF market research. After screening all marketed food items corresponding to the project-specific FuF definition, the following infor-mation was systematically assessed and food photographs were taken: (i) manufacturer and brand/trademark; (ii) product name and description; (iii) package and portion sizes; (iv) price; (v) functional ingredient(s) per 100 g, with indication if derived from a naturally nutrient-rich food component (e.g. specific fatty acid-rich oils) or from fortification beyond the usual concentration (not considering re-vitamination) or from the addition of supplemental ingredients usually not present; and (vi) detailed specification of the type of nutrition or health
claim(9), including the claim text and any other
health-related labelling. Subsequently the major FuF food groups were identified, a corresponding food
group-based FuF composition database for key functional ingredients was compiled, and a FuF photo library was established.
Because the existing validated, self-administered, semi-quantitative FFQ (ninety-one food items, 4-week refer-ence period, seven frequency categories from never to at least twice a day)(10) did not explicitly consider FuF and could not be modified during the survey, a supplemental, self-administered, qualitative FuF frequency question-naire (FuFFQ) was developed. Assessing consumption of FuF from the identified main food groups, it employed exactly the same reference period and frequency categories employed in the Bus Sante´ FFQ (Table 1). A pre-paratory pilot test, conducted during May–June 2003 in a general Bus Sante´ survey sub-sample of thirty women and thirty men, had shown that 97 % did not know what FuF was. We therefore used in the FuFFQ the single best-understood of several pilot-tested descriptions of the FuF concept as utilized by the lay press (Table 1). In a multi-stage approach, the potential impact of FuF consumption on nutritional balance was estimated by first applying the self-administered FFQ and FuFFQ concurrently, followed by a face-to-face verification step using FuF photographs (Fig. 2). This in-person control step was intended to identify true FuF consumers and non-consumers and to assess each participant’s awareness of the FuF concept. For FuF consumers who had completed both ques-tionnaires, combined food group-based individual data analyses of the FFQ and the FuFFQ were performed assuming the following: (i) when completing the FFQ for type, frequency and quantity of food consumption, participants did not distinguish between conventional foods and their functional food equivalents; (ii) when completing the FuFFQ, participants exclusively reported their FuF consumption; (iii) FuF consumers ate a selection of different foods within and across FuF food groups; and (iv) the corresponding intake of functional ingredients per food group was within the range of concentrations per 100 g of FuF as identified in the FuF market research described above.
McNemar’s two-tailed test(11)of the null hypothesis of being familiar with the FuF concept and thus of the marginal homogeneity of being categorized as a FuF consumer or non-consumer before and after the face-to-face control step using FuF photographs was employed.
Results
Overall 148 FuF were identified, of which 62 % (ninety-two) were found in the French and 38 % (fifty-six) in the Geneva grocery stores and supermarkets. The market research confirmed that the identified FuF did not represent a specific food entity but were parts of the following five major food groups: cereal products (54 %), milk and dairy products (21 %), beverages (12 %), fat
spreads and cooking fats (9 %) and convenience foods, such as soups, fruit preparations, etc. (4 %). Consequently these five food groups were chosen as the actual FuF consumption assessment units.
The key functional ingredients provided by the 148 FuF were: vitamins A, C, E, D, B1, B2, B6, B12, niacin,
pan-tothenic acid, biotin and folic acid; minerals Ca and Mg; trace elements Fe and Zn; n-3 and n-6 PUFA; prebiotics fructo-oligosaccharides and inulin (which are recognized as having dietary fibre properties); and phytochemicals, i.e. plant sterols and plant stanols. The compiled functional ingredient composition table listed the food group-specific range of the ingredient concentrations per 100 g(12).
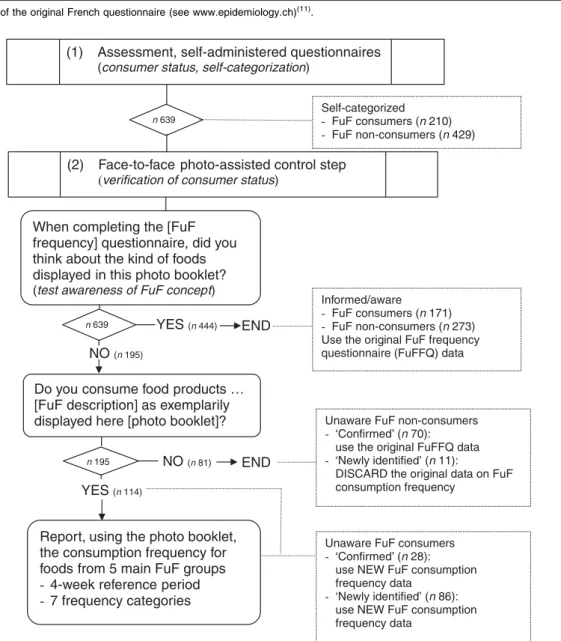
The use of the specifically prepared, food group-based FuF photo booklet in the face-to-face control step of the multistage assessment helped to successfully identify different consumer subgroups (Fig. 2 and Table 2). Prior to the face-to-face verification, 210 (32?9 %) individuals categorized themselves as FuF consumers and 429
(67?1 %) as FuF non-consumers. However, among
these 639 study participants, the photo-assisted control procedure could identify two principal categories of individuals, comprising both FuF consumers and non-consumers: (i) 444 individuals (69?5 %) who had actually been previously aware of the FuF concept and products as shown in the photo booklet, for whom the originally assessed FuFFQ data were used in the subsequent Project-specific
FuF definition
Local market research - Geneva/Switzerland
- French neighbourhood
communities
FuF database
- Key functional ingredients
concentrations/100 g (min–max) by food group
- 10-page photo booklet (product examples per food group)
FuF multistage assessment
Step 1: Concurrent application of self-administered questionnaires - Semi-quantitative FFQ
- 91 grouped food items - 4-week reference period
- 7 frequency categories from ‘never’ to ‘2+ times/d’ - Qualitative functional food questionnaire (FuFFQ)
- Do you consume food products… (FuF description)?
- If yes, consumption frequency for foods from the 5 main FuF groups - 4-week reference period
- 7 frequency categories from ‘never’ to ‘2+ times/d’ Step 2: Face-to-face verification with photo booklet (see Fig. 2)
Combined, food group-based analyses of FFQ and FuFFQ
- Relative contribution of FuF consumption to total food consumption - Quantification of FuF intake per food group
- Estimation of functional ingredients intake
FuF criteria (all required)
Processed foods of typical food nature which are consumed as part of the habitual diet
Fortified with one or several nutrients beyond the common concentration OR to which ingredients usually not present were added
Labelled with scientifically based information about intake-related benefits, so-called ‘claims’, addressed to consumers in general or specific consumer subgroups and possibly carrying a portion size intake recommendation
148 FuF (56 Geneva/Switzerland, 92 French neighbourhood) from 5 main food groups:
Cereal products; Milk/dairy products; Fat spreads/cooking fats; Beverages; Convenience foods
Key functional ingredients Vitamins, minerals, trace elements PUFA: n-3 and/or n-6
Dietary fibre: prebiotics (inulin and/or fructo-oligosaccharides)
Phytochemicals: phytosterols and phytostanols
Example: Mg, cereal products, 5·7–420 mg/100 g
Fig. 1 Flow chart of the general project plan for the assessment of functional food (FuF) consumption at the population level, Bus Sante´ survey, Geneva, Switzerland, 2003–2004
Table 1 Functional food frequency questionnaire (FuFFQ) key elements*, Bus Sante´ survey, Geneva, Switzerland, 2003–2004 Question 1 using a
FuF description
Do you eat or drink foods enriched with nutrients or other specific ingredients (e.g. vitamins, minerals, dietary fibres, probiotics), that are particularly suitable for the nutrition of women, the elderly, physically active people, individuals with elevated cholesterol levels, etc.?
Answer Yes or No- If YES, question 2
Question 2 During the last four weeks, at what frequency have you consumed enriched foods from the following food groups?
Answer Frequency grid
Frequency Enriched foods
Never during the last 4 weeks 1 time per month 2 to 3 times per month 1 to 2 times per week 3 to 4 times per week 1 time per day 2 times or more per day
’Cereal products 1 2 3 4 5 6 7
’Milk and dairy products 1 2 3 4 5 6 7
’Fat spreads and cooking fats 1 2 3 4 5 6 7
’Beverages 1 2 3 4 5 6 7
’Convenience foods
(e.g. soups, fruit preparations, etc.)
1 2 3 4 5 6 7
*English translation of the original French questionnaire (see www.epidemiology.ch)(11).
YES(n 114)
END NO(n 81)
END YES(n 444)
When completing the [FuF frequency] questionnaire, did you think about the kind of foods displayed in this photo booklet? (test awareness of FuF concept)
n 639
NO(n 195)
Do you consume food products … [FuF description] as exemplarily displayed here [photo booklet]?
n 195
Report, using the photo booklet, the consumption frequency for foods from 5 main FuF groups - 4-week reference period - 7 frequency categories
Informed/aware - FuF consumers (n 171) - FuF non-consumers (n 273) Use the original FuF frequency questionnaire (FuFFQ) data
Unaware FuF non-consumers - ‘Confirmed’ (n 70):
use the original FuFFQ data - ‘Newly identified’ (n 11):
DISCARD the original data on FuF consumption frequency
Unaware FuF consumers - ‘Confirmed’ (n 28):
use NEW FuF consumption frequency data
- ‘Newly identified’ (n 86): use NEW FuF consumption frequency data
n 639
(1) Assessment, self-administered questionnaires (consumer status, self-categorization)
Self-categorized - FuF consumers (n 210) - FuF non-consumers (n 429) (2) Face-to-face photo-assisted control step
(verification of consumer status)
Fig. 2 Flow chart of the multistage assessment of functional food (FuF) consumption. Self-administered assessment (1) and face-to-face control step (2) with FuF photo booklet, Bus Sante´ survey, Geneva, Switzerland, 2003–2004
analyses; and (ii) 195 individuals (30?5 %) who had been unaware of the FuF concept and products at the time of the survey. For the latter unaware individuals the control step further permitted assessing via the photo booklet whether they were really FuF consumers (n 114) or not (n 81), as well as distinguishing between the two further subgroups of individuals who were: (i) ‘unaware but confirmed’ and (ii) ‘unaware newly identified’ consumers and non-consumers, respectively. The FuFFQ was completed again by the unaware FuF consumers.
Thus, after verification, a final 285 FuF consumers (117 men, 168 women) (44?6 %) and 354 FuF non-consumers (190 men, 164 women) (55?4 %) were identified. Overall, eighty-six (13?5 %) of the participants actually were categorized as FuF consumers after seeing the photo booklet despite having first reported being FuF non-consumers, compared with eleven (1?7 %) of the partici-pants actually categorized as FuF non-consumers after seeing the photo booklet despite having first reported being FuF consumers (McNemar P 5 1?4 3 10–15, Table 2). Another twenty-eight (4?4 %) and seventy (11?0 %) of the participants were confirmed as being ‘unaware consumers’ and ‘unaware non-consumers’, respectively, since they had reported being FuF consumers or non-consumers prior to verification without being familiar with the FuF concept.
Discussion
Assessing FuF intake in Switzerland is challenging because it shares borders with several European coun-tries, i.e. France (as is the case for the Geneva study centre), Italy, Germany, and Austria. Certain consumers shop across borders and benefit from a different and, as was shown here, a larger than the local or national FuF market. Furthermore, different food legislation in Switzerland(13)compared with the EU(14)concerning FuF and/or the specific national enforcement and authoriza-tion related to fortificaauthoriza-tion/addiauthoriza-tion practices render functional ingredient intake assessment and evaluation even more difficult. One of the largest challenges for food authorities and nutrition researchers will be to continuously survey the local/national and adjacent international FuF markets in order to update existing (international) food composition tables/functional ingre-dients databases, thus permitting more realistic intake analyses. In the face of diverse, fluctuating and/or growing FuF markets characterized by different food formulations and new product developments, flexible FuF intake assessment tools are required.
In the present study FuF was defined from a practical point of view. The project-specific definition (see Fig. 1, top right), which relied on the main principles of the FUFOSE (Functional Food Science in Europe) Consensus
Document working definition(2) and included as an
Ta ble 2 M cNem ar test of the null hypo thes is (H 0 ) o f marg inal ho mogene ity* of being cate gorized as a func tiona lf o o d (FuF ) consume r o r non-co nsume r b e fore and after the face -to-fa ce con trol step usin g F u F photogr aphs -: Bus Sante ´surv ey, Gen eva, Switzerland, 2003– 2004 After face-to -face cont rol step Fu F consum er status Consu mer Non-consume r T o tal 199 (31 ?1% ) -11 (1 ?7% ) Consu mer aware– informe d unawa re but confirme d – unawa re–new ly ident ified 21 0 (32 ?9% ) 171 (26 ?8% ) 2 8 (4 ?4 % ) – 11 (1 ?7% ) 86 (13 ?5 % ) 3 4 3 (53 ?7% ) Non-consume r – unaware– newly identifi ed awar e–informe d u n aware but confirme d 4 2 9 (67 ?1% ) – 8 6 (13 ?5 % ) 273 (42 ?7 % ) 7 0 (11 ?0% ) Tota l 285 (44 ?6 % ) 3 5 4 (55 ?4% ) 6 3 9 (1 0 0% ) M cNemar test (two -taile d) P y5 1 ?4 3 10 –15 *H 0 : % of participants who reported being FuF non-consume rs before the control step but who were identified a s a ctually having been FuF consumers a fter the control s tep 5 % o f participants who reported being FuF consumers before the c ontrol step but who were identified a s a ctually having been FuF non-consumers after the control s tep. -See Fig. 2 for consumer and non-consumer subcategories. --n( % of 639). yCalculation based on the table entries in bold. Befo re face-to -face cont rol step (self -cate goriz ation)
additional identification mark a labelling/communication aspect (claim, consumption recommendation), provided a useful tool for the local market research.
The developed FuF food group-based, self-adminis-tered, brief qualitative frequency check list provided the needed flexibility with regard to the FuF market and is thus a tool that may be applicable across different population settings and times. The food group approach is in line with other reports which highlighted that FuF are not perceived as an independent food group but as parts of food groups or product categories such as cereal products or snack bars(15,16). Also, the perception of a FuF health benefit tends to be related to the nutritional quality or healthy image of the base product as such, e.g. a dairy product, rather than with any health claim or functional ingredients content(17).
The application of the FuFFQ, which supplemented the existing FFQ, involved a small additional time investment for the participants. Although the photo-assisted face-to-face control step also required additional specific training of the survey staff, the extra burdens on staff and participants were acceptable because the multistage assessment procedure could be integrated and covered within the regular appointment time.
Nevertheless, the present FuF intake assessment showed that even when using a straightforward descrip-tion of FuF (see Table 1) instead of the poorly under-stood, scientifically driven term ‘functional food’, the study participants still had diverse perceptions about the specific types of foods being investigated. The identifi-cation of individuals who were unaware about their actual FuF consumption or non-consumption – almost a third of the present study sample – had an important impact on the evaluation of this population’s nutrient/ functional ingredient intakes. The same issue may arise for researchers who do not share the same perception/ definition of FuF but would like to compare FuF intake data across studies in different populations.
In summary, individuals responding to a FuF ques-tionnaire must not only be presented with a definition or description of the types of foods being investigated, but also need visual aids to help them identify FuF. In the current study, presenting food photographs in a specific face-to-face control step enabled us to identify an addi-tional eighty-six FuF consumers and eleven non-con-sumers who would have been misclassified otherwise. Thus, the overall observed net increase in the number of FuF consumers was seventy-five or 12 %.
Conclusion
In assessment of FuF, the use of product photographs, or alternatives such as product packages, should become standard for maximizing the identification of true FuF consumers.
The methodological approach of asking about FuF consumption frequency by food groups appears to be applicable across different population settings and times, and thus offers the flexibility to respond to changes in the FuF market. The combination of the brief FuF food group-based, qualitative frequency questionnaire with an existing (semi-)quantitative dietary assessment instrument such as an FFQ allows for further quantification of ingredient intakes, and thus for monitoring and evaluat-ing any potential protective or harmful impacts related to regular FuF consumption. A remaining key issue, an important area requiring cooperation with food manu-facturers, will be to conduct ongoing FuF market surveys to continuously update existing food composition tables.
Acknowledgements
Authors’ contributions: S.B.-B. designed and performed the study, interpreted the results, supervised the Bus Sante´ data collection activities and performed the litera-ture search. M.C.C. performed the statistical analysis. A.M. originated and developed the Bus Sante´ surveys. All of the authors contributed equally to the origination and writing of the article.
Conflict of interest: The authors have no conflict of interest or any financial interests related to the presented work.
Sources of funding: The present study was conducted on behalf of the Swiss Federal Office of Public Health, contract no. 02.001081 and 04.000228, for data presenta-tion in the 5th Swiss Nutripresenta-tion Report, BAG/OFSP Bern, 2005.
References
1. Roberfroid MB (2002) Global view on functional food: European perspectives. Br J Nutr 88, Suppl. 2, S133–S138. 2. Diplock AT, Aggett PJ, Ashwell M, Bornet F, Fern EB & Roberfroid MB (editors) (1999) Scientific concepts of functional foods in Europe: consensus document. Br J Nutr 81, Suppl. 1, S1–S27.
3. Touvier M, Volatier JL & Martin A (2003) Assessment of the impact of fortification on nutrient intakes: a Monte Carlo approach (abstract PS.Q22). Ann Nutr Metab 47, 613. 4. Kuhlmann K, Lindtner O, Bauch A, Ritter G, Woerner B &
Niemann B (2005) Simulation of prospective phytosterol intake in Germany by novel functional foods. Br J Nutr 93, 377–385.
5. Kloosterman J, Bakker M, De Jong N & Ocke´ M (2006) A general methodology for simulation of fortified food intake. Presented at 6th International Conference on Dietary Assessment Methods, Copenhagen, Denmark, 27–29 April, abstract SY17-03.
6. Menrad M, Hu¨sing B, Menrad K, Reiß T, Beer-Borst S & Zenger ChA (2000) Technology Assessment: Functional Food. TA 37/2000. Berne: Centre for Technology Assess-ment of the Swiss Science and Technology Council. 7. Holm F (2003) New Functional Food Ingredients.
8. Galobardes B, Costanza MC, Bernstein MS, Delhumeau C & Morabia A (2003) Trends in risk factors for lifestyle-related diseases by socio-economic position in Geneva, Switzerland, 1993–2000: health inequalities persist. Am J Public Health 93, 1302–1309.
9. Ashwell M (2002) Concepts of Functional Foods. ILSI Europe Concise Monograph Series. Washington, DC: ILSI Press.
10. Morabia A, Bernstein M, Kumanyika S, Sorenson A, Mabiala I, Prodolliet B, Rolfo I & Luong BL (1994) De´veloppement et validation d’un questionnaire alimentaire semi-quatitatif a` partir d’une enqueˆte de population. Soz Praventiv Med 39, 345–369.
11. McNemar Q (1947) Note on the sampling error of the difference between two correlated proportions or percen-tages. Psychometrika 12, 153–157.
12. Beer-Borst S, Costanza MC & Morabia A (2005) Die Bedeutung von ‘Functional Food’ in der Erna¨hrung der erwachsenen Genfer Bevo¨lkerung – eine Bestandesauf-nahme (The role of ‘functional food’ in the nutrition of the Geneva adult population – an exploratory study). In: Fifth Swiss Nutrition Report, pp. 751–766 [M Eichholzer,
E Camenzind-Frey, A Matzke et al., editors]. Berne: Swiss Federal Office of Public Health. English summary and Annex available at www.epidemiology.ch, select Surveil-lance of risk factors/Diet/5th Swiss Nutrition Report/ Annexe pp. 9–12 (accessed October 2007).
13. Verordnung des EDI u¨ber die Kennzeichnung und Anprei-sung von Lebensmitteln (LKV) vom 23 November 2005 (Stand am 12 Dezember 2006). SR 817.022.21.
14. Regulation (EC) No. 1924/2006 of the European Parliament and the Council of 20 December 2006 on nutrition and health claims made on foods. Official Journal of the European Union L 404 of 30 December 2006.
15. Urula N & La¨hteenma¨ki L (2003) Reasons behind con-sumers’ functional food choices. Nutr Food Sci 33, 148–158.
16. Korzen-Bohr S & O’Doherty Jensen K (2006) Heart disease among post-menopausal women: acceptability of func-tional foods as a preventive measure. Appetite 46, 152–163. 17. Bech-Larsen T & Grunert KG (2003) The perceived healthiness of functional foods. A conjoint study of Danish, Finnish and American consumers’ perception of functional foods. Appetite 40, 9–14.