The Author 2011. Published by Oxford University Press on behalf of The Review of Economic Studies Limited. Advance access publication 8 August 2011
Shifting the Blame: On
Delegation and Responsibility
BJÖRN BARTLING
University of Zurich
and
URS FISCHBACHER
University of Konstanz
First version received October 2009; final version accepted March 2011 (Eds.)
To fully understand the motives for delegating a decision right, it is important to study responsi-bility attributions for outcomes of delegated decisions. We conducted laboratory experiments in which subjects could either choose a fair allocation or an unfair allocation or delegate the choice, and we used a punishment option to elicit responsibility attributions. Our results show that, first, responsibil-ity attribution can be effectively shifted and, second, this can constitute a strong motive for the del-egation of a decision right. Moreover, we propose a simple measure of responsibility and show that this measure outperforms measures based on inequity aversion or reciprocity in predicting punishment behaviour.
Key words: Delegation, Responsibility, Punishment, Decision rights JEL Codes: C91, D63
“Princes should delegate to others the enactment of unpopular measures and keep in their own hands the means of winning favours.” – Machiavelli1
1. INTRODUCTION
Who is held responsible for the outcome of a delegated decision, the person who delegated the decision right or the person who ultimately made the decision? In this paper, we report data from economic experiments that allow some players to delegate a decision right and others to impose monetary punishment, which we interpret as a measure of responsibility attribution. We provide clean evidence that, first, along with the decision right the responsibility for the resulting outcome is also delegated and, second, responsibility shirking to avoid punishment is a strong motive for delegating a decision right.
The economics literature proposes a number of explanations for why decisions are delegated. The delegate might have lower opportunity costs, be better informed, or equipped with more ad-equate skills (for an overview of the principal-agent literature see, e.g. Bolton and Dewatripont,
1. From “The Prince”, originally published in 1532; see Machiavelli, 2003, Chapter 19, p. 61. 67
2005). Further explanations include delegation as commitment device Schelling (1960)2 and incentive provision by delegation (Aghion and Tirole 1997). The question of responsibility at-tribution for delegated decisions and responsibility shirking by delegation caught little attention. This paper aims to fill the gap. Our experimental design abstracts deliberately from the existing explanations for delegation. While these reasons certainly play important roles in many delega-tion decisions, being able to eliminate confounding factors of influence is the virtue of controlled laboratory experiments. Our design makes it possible to isolate responsibility shirking to avoid punishment as one additional motive. The results of this paper thus complement the existing knowledge of why decision rights are delegated.
To see the importance of responsibility attributions for the decision whether or not to dele-gate a decision right, consider the following examples. Companies like AlixPartners or Alvarez & Marsal make their living by offering interim management to firms in financial distress. In such cases, a chief restructuring officer (CRO) temporarily replaces the CEO of a troubled firm. CROs are equipped with extensive decision rights to shepherd, in the most severe cases, a com-pany through an insolvency process. Clearly, CROs bring specific expertise and experience, an outside perspective, and supplement incumbent managers in times of intensive work load. Yet, these well-established explanations for the delegation of decision rights are not exhaustive. The McShane Group, for example, offering “Turnaround Consulting & Crisis Management”, frankly advertises its services by stressing that blame can be shifted to CROs: “Moreover, change fre-quently requires difficult choices and unpopular decisions. The use of an interim executive to move through these decisions and then move on, allows new, permanent leadership to take the helm untainted by any residual negative feelings toward his or her predecessor”.3 Man-agement consultants can serve as another example. Even though consultants do not—in contrast to CROs—make decisions themselves, their advice often directly results in unpopular decisions. Blame shifting can thus be one important motive for engaging external advisors.
In the political science literature, blame avoidance strategies have been discussed since the 16th century when Machiavelli published his famous book “The Prince” from which the quo-tation at the beginning of the paper is taken. In this tradition, Herring (1940) introduced the classic “lightning rod” metaphor. To be effective, he argued, the American president must act “as a generalissimo who devolves upon his generals the responsibility for the attainment of par-ticular objectives. If they fail they can be disgraced and removed; or kicked upstairs to posts of less crucial importance.” (p. 112). In modern public choice theory, Fiorina (1982, 1986), e.g. applied the concept of blame shifting to regulatory agencies. Under the presumption that actual benefits of regulation can exceed constituents’ perceived benefits, he argues that “by charging an agency with the implementation of a general regulatory mandate, legislators [. . . ] avoid or at least disguise their responsibility for the consequences of the decisions ultimately made.” (1982, p. 47). International agencies are another application. Vaubel (1986) claims that national politi-cians “try to get rid of their ‘unpleasant’ activities, their ‘dirty work’ ” (p. 48). He argues, among other examples, that the International Monetary Fund “relieves its members of unpleasant tasks as well: it imposes policy conditions on borrowing governments which want to evade the respon-sibility of unpleasant measures; by serving as a bogeyman or scapegoat, it enables the individual lending governments to escape the nationalist resentment which such policy conditions would otherwise create” (p. 49).
2. Applications are output and pricing decisions in oligopolistic markets (Vickers, 1985), inflation targeting (Rogoff, 1985), and bargaining (Jones, 1989). Huck, Müller and Normann (2004) provide experimental evidence on strategic delegation in oligopolistic markets, Schotter, Zheng and Snyder (2000) and Fershtman and Gneezy (2001) in bargaining situations.
Despite the frequent use and intuitive appeal of the blame shifting motive for delegation, our paper is—to the best of our knowledge—the first study to provide clean behavioural measures of, first, responsibility attribution for delegated decisions and, second, blame shifting as a motive for delegating a decision right. Our paper reports data from incentivized choice experiments that are designed to measure responsibility attribution in games allowing for delegation and punishment. We study a game in which a first player (the dictator) can decide between an equal (fair) and an unequal (unfair) allocation of a given endowment. Or—instead of taking the decision himself— he can delegate the decision right to a second player (the delegee), who must then decide between the two allocations. The monetary pay-offs of the first and second player are perfectly aligned; both receive a higher monetary pay-off if the unfair allocation is chosen. Third players (two receivers) are, however, adversely affected if the unfair allocation is chosen. They can assign costly punishment points either to the dictator or the delegee, or both (or even to the other receiver).
Our results show that punishment can be effectively shifted. If the dictator delegates the de-cision right and the delegee makes the unfair choice, then mainly the delegee is punished, while the dictator is almost spared. This finding does not necessarily imply that delegating the decision right maximizes the dictator’s expected pay-off because delegating means losing control over the allocation choice. In our experiment, however, sufficiently many delegees choose the unfair al-location to render delegation the pay-off maximizing choice for dictators. Consistent with this finding, relatively few dictators choose the unfair allocation themselves. The majority of dicta-tors either delegate the decision right or choose the fair allocation. By conducting treatments with and without punishment opportunities of the receivers, the experimental design allows to test whether the avoidance of punishment is indeed a motive for the delegation of a decision right. This is strongly confirmed as the share of delegated decisions is three times higher in the treatment with punishment than in the treatment without punishment opportunities.
To address the limits and temporal stability of responsibility shifting, we conducted three additional variants of the delegation treatment with punishment. In one treatment, dictators can delegate to a die but not to another player. We find that some responsibility can be shifted to chance but less than to a player. In another treatment, dictators can only be fair or delegate. We find that dictators are less able to shift responsibility if the unfair outcome can be implemented via delegation only, but the effect is small. In the final treatment, the game is played repeatedly; all other treatments are one-shot. We find that the punishment pattern of the one-shot game is replicated and, importantly, that it is stable over time. The receivers do not punish dictators more when gaining experience with the situation in which the unfair allocation results after delegation. Rather, the dictators seem to learn that delegation maximizes pay-offs because the fraction of delegated decisions is higher on average and increasing over time. The last observation shows that the punishment avoidance motive for delegation is also stable over time.
In the final part of the paper, we conduct an econometric comparison of different punish-ment motives. We consider the motives inequity aversion (Fehr and Schmidt, 1999; Bolton and Ockenfels, 2000) and reciprocity (Rabin, 1993; Levine, 1998; Charness and Rabin, 2002; Dufwenberg and Kirchsteiger, 2004; Falk and Fischbacher, 2006). In addition, we propose a measure of a player’s responsibility for the unfair allocation. The measure captures the relative impact of a player’s action on the probability that the unfair allocation resulted. We hypothesize that a player’s punishment is increasing in his responsibility. The analysis shows that the respon-sibility measure is able to explain more of the variation in punishment levels in the different treatments than measures based on outcome or intention or the interaction of both.
Our paper is related to a small collection of experimental papers that study delegation in ultimatum and dictator games. Fershtman and Gneezy (2001) find that a proposer’s pay-off in an ultimatum game is higher if he uses a delegee who can be incentivized to make unfair offers. The
existence of the delegee increases the responder’s willingness to accept unfair offers. One reason might be that not only the proposer but also the delegee suffers a loss (the incentive payment) if the responder rejects. Hamman, Loewenstein and Weber (2010) show that delegation in dictator games leads to more unfair outcomes. This is explained by responsibility diffusion: the dictator feels less responsible, while the delegee feels that he is just carrying out orders.4The papers have in common that they analyse the effect of delegation on outcomes. In contrast, our paper does not focus on allocative consequences of delegation but on measuring responsibility attributions. Coffman (2011) analyses an experimental design in which a dictator can either share $10 with a recipient or take all or some of this amount from an “intermediary”. If the dictator takes money from the intermediary, the latter has to share $10 with the recipient but must keep at least the amount the dictator took from him. A fourth player, who observes all moves, can punish the dictator. The paper shows that intermediation reduces punishment: even if the dictator takes $10 from the intermediary, who then cannot share anything with the recipient, he is punished less compared to playing the dictator game and keeping everything directly. This finding corroborates our results because it shows that even though (1) the dictator restricts the intermediary’s choice and (2) punishment is restricted to the dictator, some punishment can nevertheless be avoided.
Our treatment in which the dictators can delegate to a die is related to Blount (1995) who studies the effect of causal attributions on social preferences. She finds that small ultimatum game offers are accepted more often if the offer was made by a random device rather than by an agent with intention. Andreoni and Bernheim (2009) study audience effects and conduct a dictator game where nature sometimes intervenes, choosing an unfavourable outcome for the recipient who cannot observe whether nature intervened. They find that dictators tend to hide behind the possibility that nature chose the unfair outcome.5 Our results are consistent with these findings, but there is an important difference: our paper shows that a player can shift responsibility by intentionally delegating a decision to a random device.
The remainder of the paper is organized as follows. Section 2 describes our experimental design in detail. Section 3 discusses the punishment predictions of the self-interest model, of outcome and intention-based models of social preferences, and of a measure of responsibility for the unfair allocation. Section 4 presents our main results on punishment patterns and on the frequency of delegation and allocation choices. Section 5 provides an econometric comparison of different punishment motives. Section 6 concludes.
2. EXPERIMENTAL DESIGN
We implemented dictator games with a delegation and a punishment option. In our games, there are groups of four players. Each group consists of one player A (the dictator), one player B (the potential delegee), and two player Cs (the receivers). A or B can decide between an equal and an unequal allocation of 20 points among the four players in the group. The equal (fair) allocation assigns 5 points to each of the four players; the unequal (unfair) allocation assigns 9 points each to A and B and 1 point each to both Cs.
We consider treatment variations along two main dimensions: with or without delegation and with or without punishment. In treatments without delegation, A decides between the fair and
4. Another related experimental paper is that of Ellman and Pezanis-Christou (2010). They show how organiza-tional structures and communication influence responsibility diffusion in groups, which in turn affect decisions about negative externalities imposed on outsiders.
5. See Dana, Weber and Kuang (2007) for a similar result. Also related, Charness (2000) finds that workers in a gift-exchange experiment respond with more generosity if wages are determined by a random process rather than by a neutral third party. He argues that workers cannot avoid accepting full responsibility for the final allocation if wages are random, while a high wage that is assigned by a third party may be perceived as a personal entitlement.
the unfair allocation. B cannot take a decision. In treatments with delegation, A can—instead of making the decision himself—delegate the decision right to B. If A delegates, then B makes the decision. He cannot refuse to make the decision nor delegate it to yet another player. If A does not delegate, then B cannot make any decision. In treatments without punishment, the Cs cannot make decisions. In treatments with punishment, one of the two Cs is randomly selected. The selected C can—after having observed A’s and if applicable B’s decisions—assign costly punishment points to A, B, and also the other C (to avoid experimenter demand effects). He can spend one of his points to reduce the other players’ pay-offs by up to seven points. The seven punishment points can be assigned to a single player or they can be split and assigned to two or to all three other players, but it is not possible to reduce a player’s pay-off below zero. The selected C can also decide to assign less than seven punishment points and leave the unassigned points void. The C that is not selected cannot take a decision. Subjects were unaware of the treatment variations, but in each treatment the experimental conditions were common knowledge.
The pay-off functions are summarized as follows. A’s and B’s pay-off is either 9 or 5 points, depending on the chosen allocation, minus the, respectively, assigned punishment points. If a C is selected to be able to punish, his pay-off is either 1 or 5 points, minus 1 point if he pun-ishes. If a C is not selected, his pay-off is either 1 or 5 points, minus assigned punishment points.
We applied the strategy method for Cs. In the respective treatments, Cs had to decide how many punishment points to allocate to A, B, and the other C in all possible situations (in a randomized order) before they knew how A and—in case of delegation—B decided and before they knew whether they were selected to be able to punish or not. In the treatment without delegation but with punishment (noD&P) there are two situations: A is either fair or unfair. In the delegation treatment with punishment (D&P), there are four situations: A does not delegate and is either fair or unfair, or A delegates and B is either fair or unfair. The reason to have two Cs in a group is that with two Cs and the use of the strategy method, we are able to elicit punishment decisions from half of our subjects. We did not use the strategy method for Bs; they made a decision only when the decision right was in fact delegated. We wanted B to know for sure that his decision would be implemented because this matches A’s situation.
Since the focus of this paper is the punishment assignment for delegated decisions, we con-ducted three additional variants of treatment D&P: random, asymmetric, and repeated. Under different assumptions about players’ preferences, treatments random and asymmetric give rise to different punishment predictions than treatment D&P, which is discussed in detail in Section 3 below. Treatment repeated is conducted to analyse the temporal stability of the punishment pattern and the delegation and allocation decisions.
In treatment random, A can delegate the decision between the fair and the unfair allocation to a computerized random device (die) but not to B. It is common knowledge that the die chooses the unfair allocation with probability 0∙4. The participants were not aware that 0∙4 matches the share of unfair Bs in treatment D&P. B cannot make a choice in treatment random. As in treatment D&P, we used the strategy method to elicit Cs’ punishment choices. The only difference is that in the two delegation situations, Cs have to state their punishment assignments to A, B, and the other C when the die—and not B—is either fair or unfair.
In treatment asymmetric, A can choose the fair allocation or delegate to B, but he cannot choose the unfair allocation. As in treatment D&P, B can decide between the fair and the unfair allocation if A delegates. Cs’ punishment options and the elicitation method are again as in treatment D&P. The only difference is that the situation in which A is unfair cannot occur. Note that in comparison to treatment D&P, in treatment asymmetric delegation is A’s least kind action.
TABLE 1
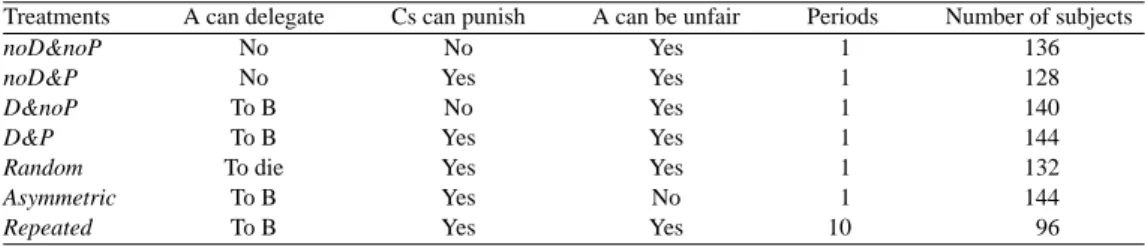
Treatments
Treatments A can delegate Cs can punish A can be unfair Periods Number of subjects
noD&noP No No Yes 1 136
noD&P No Yes Yes 1 128
D&noP To B No Yes 1 140
D&P To B Yes Yes 1 144
Random To die Yes Yes 1 132
Asymmetric To B Yes No 1 144
Repeated To B Yes Yes 10 96
In treatment repeated, subjects play the treatment D&P repeatedly for 10 periods.6All other treatments are played one-shot. While the subjects keep their roles as A, B, or C in all periods, the groups of four players are randomly rematched in each period.7Cs’ assignment of punishment points is elicited in each period, again with the strategy method. Within groups, full feedback is given at the end of each period. The stage game thus exactly coincides with the one-shot D&P treatment. All details of the game such as the matching protocol and the feedback rules were common knowledge. Table 1 gives an overview of our treatments.
2.1. Procedural details
The experiments were computerized with the software “z-Tree” (Fischbacher, 2007). The re-cruitment was conducted with the software “ORSEE” (Greiner, 2004). Subjects were students from the University of Zurich and the Swiss Federal Institute of Technology in Zurich. Eco-nomics or psychology students were not eligible to participate. All sessions took place at the In-stitute for Empirical Research in Economics at the University of Zurich. The treatments
noD&noP, noD&P, D&noP, and D&P were conducted in June and November 2006; treatments random and asymmetric in May and June 2007, and treatment repeated in April and May 2010.
Each subject participated in one of the treatments only.
Subjects were randomly assigned a role as A, B, or C upon arrival at the laboratory. They re-ceived written instructions including comprehension questions that had to be answered correctly before the experiment could begin. A summary of the instructions was read aloud to ensure com-mon knowledge of the respective treatment conditions. An English translation of the instructions for our main treatment D&P is included in the supplementary data appendix (Supplementary Material) that is available on the journal’s web pages.
Sessions without punishment lasted for about 45 minutes, sessions with punishment for about 60 minutes, and treatment repeated for about 75 minutes. Each experimental point was converted into CHF 3 (about $2∙40 at that time) at the end of the experiment. On average, subjects earned CHF 25 in the sessions without punishment and CHF 22∙90 in sessions with punishment, which included a show-up fee of CHF 10. In treatment repeated, each experimental point was con-verted into CHF 0∙50, a lower exchange rate than in the other treatments, to account for both the duration of the experiment and the fact that subjects played repeatedly. On average, subjects earned CHF 31∙50. We also conducted an incentivized belief elicitation session with 32 subjects
6. We thank an anonymous referee and the editor for suggesting this treatment.
7. Since we had only 32 subjects per session and implemented two independent matching groups in each session, a perfect stranger protocol was not feasible. Due to the large number of subjects and the random matching protocol, repeated game effects should not play a role.
(see Section 5). This session took place in September 2007, lasted for about 60 minutes, and subjects earned CHF 23∙10 on average. All subjects received their payments privately.
3. PUNISHMENT PREDICTIONS: OUTCOMES, INTENTIONS, AND RESPONSIBILITY The punishment predictions for our games depend on the assumptions concerning players’ pref-erences. If players are purely self-interested, then Cs will never incur the cost to punish, irre-spective of the chosen allocation and the player who made the choice. There is ample evidence, however, that many people are not purely self-interested but have social preferences.
3.1. Outcome-based models of social preferences
Outcome-based models of inequity aversion (e.g. Fehr and Schmidt, 1999) predict that strongly inequity averse Cs incur costs to reduce pay-off inequality. The models thus predict some amount of punishment for A and B if the unfair allocation is chosen, irrespective of whether A, B, or the die chose the allocation. But linear models like the Fehr–Schmidt model, e.g. make no predictions as to who is punished. It does not matter whether a given amount of punishment is targeted at A or B, or if it is divided between the two. If the fair allocation is chosen, outcome-based models of inequity aversion predict no punishment.
3.2. Intention-based models of social preferences
Social preference models based on intention and reciprocity (e.g. Rabin, 1993) predict that re-ciprocal Cs respond to unkind actions by A or B by assigning punishment points. If A or B chooses the unfair allocation—an unkind action—then the respective player will be punished. If A or B chooses the fair allocation, then there will be no punishment for this player. As how unkind do Cs perceive delegation by A to B? If C believes that A believes that B will choose the (un)fair allocation with certainty, then delegating is as (un)kind as choosing the (un)fair al-location. For less extreme second-order beliefs, models of intention-based reciprocity predict an intermediate level of punishment for a delegating A because delegating is believed to result with an intermediate probability in the unfair allocation.
Our variants of treatment D&P give rise to further predictions. In treatment random, we matched the commonly known randomization probability of the die with Bs’ allocation choices in treatment D&P (subjects were not aware of this). Predicted punishment levels for A when delegating to B and when delegating to the die thus coincide, given subjects hold correct beliefs in treatment D&P. Moreover, since C’s belief about A’s intention when delegating to the die— determined by the randomization probability—cannot depend on the subsequent realization of a random draw, predicted punishment for A does not depend on the draw. The same applies in treatments where A can delegate to B.8 Finally, in models of intention-based reciprocity, the kindness of an action is judged relative to a player’s action space. This has implications in treatment asymmetric, where A cannot be unfair. Since delegation is now the least kind action by A, predicted punishment for delegating is, ceteris paribus, higher than in treatment D&P.
8. However, if C’s belief about A’s belief about B’s behaviour depends on B’s actual choice, the following second-order beliefs can be constructed. C does not punish A if B is fair because if B is fair, C believes that A believed that B is fair. But C punishes A if B is unfair because C then believes that A believed that B is unfair. These beliefs might be reasonable if one assumes that C believes that A is better informed about the distribution of types of Bs because C could then update his second-order belief by observing B’s actual choice. Since we had random and anonymous role assignment, it is however unreasonable that C believes that A is better informed about B.
3.3. A simple measure of responsibility
Responsibility is another possible motive for punishment. If the unfair allocation is chosen, the Cs might ask: Who is responsible for this outcome? And they might choose punishment levels according to their responsibility assignments. How can a player’s responsibility for the unfair allocation be captured? We suggest a simple measure that assigns most responsibil-ity to the player whose action had the largest impact on the probabilresponsibil-ity that unfair allocation results.9
We assume that C, who evaluates the responsibility of A and B, holds a belief about how players decide on average at the different nodes of the game. This belief determines at each node the probability of the unfair allocation. In an actual play of the game, a player’s action can change this probability and a player takes on responsibility if and only if his action raises the probability of the unfair allocation. The ex ante probability of the unfair allocation is de-termined by C’s beliefs at the initial node of the game. In case the unfair allocation finally prevails, the probability equals one. We assume that a player’s responsibility is assigned accord-ing to his share in the sum of the probability increases that result from the individual players’ moves.
If A chooses the unfair allocation, he caused all of the probability increase and is thus fully responsible. The prediction is that only A is punished. If both A and B increase the probability of the unfair allocation—A by delegating and B by choosing the unfair allocation—each player’s share in the increase is calculated, and this determines their shares in punishment.10In treatment
asymmetric, we vary A’s and B’s relative impact on the probability of the unfair allocation. In
contrast to treatment D&P, A is now definitely responsible to some degree if he delegates, unless there is no heterogeneity in behaviour.11
Moreover, we assume that a player’s responsibility is not diluted by moves of nature. This captures the idea that only people but not chance can be responsible for an outcome. In treatment
random, therefore, if the probability of the unfair allocation increases by delegating to the die
and if the unfair allocation is realized, A is the only player who increased the probability and he is then fully responsible.
Finally, if the unfair allocation does not realize in any of the treatments, each player’s respon-sibility is zero. This captures the idea that nobody must be held responsible and thus punished for an outcome that did not happen, i.e. “no harm, no foul”.12 In the Appendix, we provide a more general and formal definition of the responsibility measure.
9. In the economics literature, the term responsibility is used with diverse meanings. For example, Prendergast (1995) proposes a theory of responsibility in organizations and defines responsibility as “span of managerial control” (p. 388). Manove (1997) analyses how remuneration should be related to job responsibility that is defined as “the varia-tion in the value of job outcomes over the feasible range of worker effort” (p. 86). Charness and Jackson (2009) analyse the role of responsibility in strategic risk taking and call a player responsible if his action determines the pay-off also of another passive player. The papers have in common that they define responsibility ex ante. In contrast, we are interested in the ex post responsibility assignment for outcomes that are the result of one or many players’ actions.
10. Consider treatment D&P and let Cs’ beliefs about the fraction of As and Bs who are unfair be given byα and β, respectively, and of As who delegate by δ. The ex ante probability of the unfair allocation is then α+ δβ. Suppose A delegates and B is unfair. Ifα+δβ < β, A’s share in the probability increase is (β −α −δβ)/(1−α −δβ) and B’s share is (1−β)/(1−α −δβ). B is thus more responsible for the unfair allocation if β < (1+α)/(2−δ). If α +δβ > β, A reduces the probability of the unfair allocation by delegating. If B chooses the unfair allocation, B is then fully responsible.
11. In treatment asymmetric, the ex ante probability of the unfair outcome isδβ. Hence, if the unfair outcome results after delegation, A’s responsibility is(β− δβ)/(1 − δβ) and B’s responsibility is (1 − β)/(1 − δβ). A is thus always responsible to some extent unlessδ= 1.
4. RESULTS 4.1. Punishment patterns
The focus of this paper is the elicitation of punishment patterns for allocation choices, especially in situations in which A delegated the decision right. In our main punishment treatments noD&P and D&P, we find a clear pattern of punishment. When the fair outcome results, then there is almost no punishment. When the unfair outcome results, then mainly the player who chooses the unfair allocation is punished, while the other players are almost spared. Most importantly, this pattern holds if A delegates and B subsequently chooses the unfair allocation. Thus, assigned punishment points can be effectively shifted by delegating the decision right.
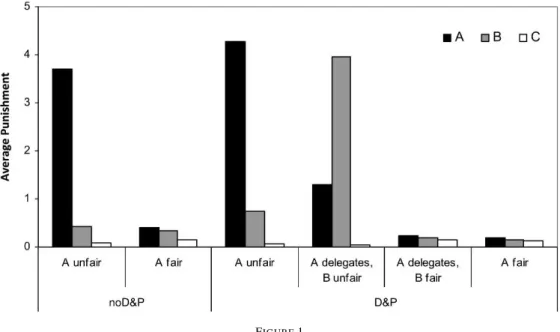
Figure 1 shows the average punishment points that were assigned to A, B, and the other C in the different situations in treatment noD&P and D&P. The exact values for As and Bs can be read from Table 2. For instance, the left black bar shows that in treatment noD&P A is punished by 3∙70 points on average if he chooses the unfair allocation. From the figure it is immediately evident that the average punishment for the player with the decision right is higher if he chooses the unfair allocation than if he chooses the fair allocation. This is statistically confirmed by comparing the respective punishment for the fair and the unfair allocation choice. In all three comparisons, two-sided Wilcoxon signed-rank tests are highly significant (p< 0∙01). Moreover,
in all three situations in which the unfair allocation is chosen, average punishment is highest for the player who made the allocation choice. This is statistically confirmed by comparing the punishment for the player who made the allocation choice with the punishment for the respec-tive other two players. In all three situations, two-sided Wilcoxon signed-rank tests are highly significant (p< 0∙01).
The important finding is that in treatment D&P, A receives an average punishment of 4∙27 points if he chooses the unfair allocation, but a much lower average punishment of only 1∙31 points if he delegates and B subsequently chooses the unfair allocation. Inversely, B receives an average punishment of only 0∙75 points if A chooses the unfair allocation, but a much higher average punishment of 3∙96 points if he chooses the unfair allocation after delegation by A. In
FIGURE1
TABLE 2
Average punishment points for player As and Bs
A unfair B/die unfair B/die fair A fair
noD&P A 3∙70 — — 0∙41 B 0∙42 — — 0∙34 D&P A 4∙27 1∙31 0∙24 0∙19 B 0∙75 3∙96 0∙20 0∙15 Random A 4∙64 2∙98 0∙56 0∙18 B 0∙35 0∙68 0∙27 0∙23 Asymmetric A — 1∙53 0∙47 0∙11 B — 2∙85 0∙13 0∙10 Repeated A 3∙43 0∙86 0∙25 0∙45 B 0∙50 3∙09 0∙19 0∙19
both comparisons, two-sided Wilcoxon signed-rank tests are highly significant (p< 0∙01). This
result shows that by delegating the decision right to B, A also delegates most of the punishment for the unfair outcome to B.
This finding is further illustrated in Figure 2. The figure shows the individual Cs’ assignments of punishment points to A and B in treatment D&P. The left panel shows the situation in which A chooses the unfair allocation. The right panel shows the situation in which A delegates and B chooses the unfair allocation. Grey circles above (below) the 45-degree line indicate Cs who punish A more (less) than B. For instance, the top left circle in the left panel shows that in the situation in which player A chooses the unfair allocation, 29 (out of 71) Cs assign all seven punishment points to A and no punishment points to B; the circle on the origin indicates that 19 Cs did not punish at all.13 Figure 2 clearly shows that if A makes the unfair allocation choice, then of those Cs who punish, almost all punish A more than B. In contrast, if A delegates the decision right and B makes the unfair allocation choice, then of those Cs who punish, the vast majority punish B more than A.
Furthermore, from Figure 1 it can be seen that in treatment D&P, A and B receive more punishment if the respective other player makes the unfair than if he makes the fair allocation choice. We find that B is punished more if A chooses the unfair allocation (0∙75 points) than if A chooses the fair allocation (0∙15 points). A is also punished more if B chooses the unfair allocation (1∙31 points) than if B chooses the fair allocation (0∙24 points). In both comparisons, two-sided Wilcoxon signed-rank tests are highly significant (p< 0∙01). Indeed, if B chooses
the fair allocation after delegation by A, then A is not punished more than if A chooses the fair allocation directly (one-sided Wilcoxon signed-rank test, p= 0∙65).
Importantly, A is punished significantly more if he delegates and B chooses the unfair allo-cation (1∙31 points) than B if A chooses the unfair allocation (0∙75 points); two-sided Wilcoxon signed-rank test (p< 0∙01). This observation can also be made in Figure 2. There are more Cs
in the right panel who assign a relatively large share of total punishment to A (i.e. Cs that are located close to the 45-degree line), than there are Cs in the left panel who assign a relatively large share of total punishment to B. After all, if B chooses the unfair allocation, A could have chosen the fair allocation but instead decided to delegate. In contrast, if A chooses the unfair allocation directly, B did not have the opportunity to secure the fair allocation, hence did not ne-glect that opportunity. This finding indicates that there are limits to shifting the punishment—an observation that is addressed by our variants of treatment D&P to which we turn next.
13. Due to a programming error we lost the punishment assignment of a single C in the situation in which A is unfair. As a result, we have only 71 observations in the left panel of Figure 2 but all 72 observations in the right panel.
FIGURE2
Individual player Cs’ assignments of punishment points in treatment D&P. The left panel shows the situation in which A is unfair in treatment D&P. The right panel shows the situation in which A delegates and B is unfair. Numbers in circles
indicate the number of observations
Figure 3 shows the average punishment points that were assigned to A, B, and the other C in treatments random and asymmetric. The exact values for As and Bs can be read from Table 2. These treatments were designed to study the change in the punishment pattern in the situation in which A delegates and the unfair allocation results, relative to the benchmark treatment D&P. Notice first that in the other situations, the basic findings from treatment D&P are replicated. In both treatments, if A chooses the fair allocation, there is almost no punishment. And if A chooses the unfair allocation in treatment random (recall that A cannot be unfair in treatment
asymmetric), essentially only A is punished. We also observe, again, that A’s punishment after
delegation depends on the subsequent allocation choice. In both situations, after delegation to the die and to B, A is punished significantly less if the fair allocation results than if the unfair allocation results; two-sided Wilcoxon signed-rank tests ( p< 0∙01).
The first new finding is that the punishment patterns when the unfair outcome results af-ter delegation are strikingly different in treatments random and D&P. A is punished signifi-cantly more in treatment random if he delegates to the die and the die is unfair (2∙98 points) than in treatment D&P if he delegates to B and B is unfair (1∙31 points); two-sided rank sum test ( p< 0∙01). Moreover, A is the player who is punished most if the unfair outcome results
after delegation; two-sided rank sum tests ( p< 0∙01). However, A is punished significantly less if he delegates to the die and the unfair allocation results (2∙98 points) than if he chooses the unfair allocation directly (4∙64 points); two-sided Wilcoxon signed-rank test (p < 0∙01). This shows that some punishment can nevertheless be avoided by delegation to the random device.
The second new finding is that in treatment asymmetric A is punished more if the unfair allocation results after delegation (1∙53 points) than in treatment D&P (1∙31 points). Inversely, B is punished less in treatment asymmetric (2∙85 points) that in treatment D&P (3∙96 points). While the difference is not significant for A (rank sum test, p= 0∙46), it is significant for B (rank sum test, p= 0∙012). This result indicates that A’s action space affects his ability to
FIGURE3
Punishment pattern in treatments random and asymmetric
avoid punishment by way of delegation. The basic insight from treatment D&P is, however, replicated. The player who makes the allocation choice is punished most. If B is unfair, B is punished significantly more than A; two-sided Wilcoxon signed-rank test ( p< 0∙01).
Finally, our treatment repeated addresses the stability of the punishment pattern that is ob-served in treatment D&P. As Cs gain more experience, do they continue to punish mainly B and spare A when the unfair allocation is chosen after delegation? Figure 4 illustrates the two main findings. First, the punishment pattern in treatment repeated very closely replicates the pattern in treatment D&P. If A is unfair, then the average punishment for A (3∙43 points) is significantly higher than the average punishment for B (0∙50 points); OLS regression, standard errors cor-rected for correlations in matching group clusters ( p< 0∙01). If B is unfair after delegation, then
the average punishment for B (3∙09 points) is significantly higher than the average punishment for A (0∙86 points); test as above (p = 0∙01). Moreover, A’s punishment if B is unfair is higher than B’s punishment if A is unfair; test as above ( p= 0∙056). Second, this pattern is stable over time. There is no period trend in punishment either for A or for B.14 The average punishment points over the periods for As and Bs can be read from Table 2.15
4.2. Frequency of delegation and allocation choices
We now turn to As’ and Bs’ delegation and allocation decisions. To begin with, our treatments replicate two well-established experimental results. First, some people exhibit fair behaviour
14. We use OLS regressions with punishment as dependent variable and period as regressor; standard errors cor-rected for correlations within matching group clusters. In separate regressions for As and Bs and the four different situations, we find that in all 8 regressions, period is insignificant (the lowest p-value equals 0∙223). To increase power, we also conducted regressions for As and Bs in which we control for the four situations with dummies and find that the period coefficient is insignificant ( p= 0∙90 for As and p = 0∙76 for Bs).
15. We find somewhat lower average punishment levels compared to treatment D&P. For example, if A is unfair, he receives 4∙27 punishment points in treatment D&P and 3∙43 in treatment repeated. Similarly, if A delegates and B is unfair, B receives 3∙96 punishment points in treatment D&P and 3∙09 in treatment repeated. However, none of these differences is significant, based on OLS regressions with standard errors corrected for dependency within matching groups in the repeated treatment.
FIGURE4
Punishment pattern in treatment repeated. The left panel shows the situation in which player A chooses the unfair allocation in treatment repeated. The right panel shows the situation in which player A elegates and player B chooses
the unfair allocation
in dictator games and, second, the threat of punishment increases the share of fair choices be-cause punishment can render this choice optimal also for purely self-interested players (e.g. Forsythe et al., 1994). In treatment noD&noP, 35% of As choose the fair allocation. In treat-ment noD&P, the share rises to 63%, which is significantly higher (two-sided Fisher exact test,
p= 0∙048). The same pattern holds in the treatments with delegation. In treatment D&noP,
20% of the players choose the fair allocation. In treatment D&P, 61% choose the fair allocation, which is again significantly higher (two-sided Fisher exact test, p< 0∙01). Table 3 gives an
overview.
The important new result is that the share of delegated decision is more than three times higher in treatment D&P than in treatment D&noP. In treatment D&noP, 17% of As del-egated the decision right. In treatment D&P, the share of deldel-egated decisions rises to 56%, which is significantly higher (Fisher exact test, p< 0∙01). This finding demonstrates that
avoid-ing punishment is an important motive for the decision whether or not to delegate a decision right.
Comparing the punishment patterns in treatments D&P and random, we found that As suc-ceed less in avoiding punishment by delegating to the die. Consistent with this finding, only 39% of As delegate in treatment random as compared to 56% in treatment D&P. This difference
TABLE 3
Delegation and allocation choices
A unfair (%) B unfair (%) B fair (%) A fair (%) Delegation to die (%) Number of observations
noD&noP 65 — — 35 — 34 noD&P 38 — — 63 — 32 D&noP 66 14 3 17 — 35 D&P 17 22 33 28 — 36 Random 33 — — 27 39 33 Asymmetric — 50 28 22 — 36 Repeated 30 27 32 10 — 240
is however not significant (one-sided Fisher exact test, p= 0∙14). In treatment asymmetric, even though As’ average punishment is slightly (but not significantly) higher than in treatment
D&P, we find that 78% of As delegate. But the number of delegated decisions is not
compa-rable to treatment D&P because in treatment asymmetric, As who want the unfair allocation to be chosen must delegate. In treatment repeated, on average As delegated in 59% of the cases, which closely matches the fraction of 56% in treatment D&P. Looking at the average of the 10 periods however masks that the fraction of delegated decisions increases over time. In the first five periods, the fraction is 53% and rises to 66% in the last five periods (probit regres-sion of deciregres-sion to delegate on period, p< 0∙01; standard errors corrected for correlations in matching group clusters).16 Hence, not only does the treatment show the stability of the pun-ishment pattern. Our second main finding—that punpun-ishment avoidance is a strong motive to delegate a decision right—is even reinforced as the participants gain more experience with the game.
The finding that A can delegate most of the punishment for the unfair allocation to B does not imply that delegating the decision right maximizes A’s expected pay-off. Delegation means los-ing control, i.e. A’s pay-off also depends on B’s allocation choice. We find that sufficiently many Bs choose the unfair allocation to render delegation the pay-off maximizing choice for As. In treatment D&P, delegation is highly significantly more profitable than making either allocation choice oneself (Wilcoxon signed-rank tests, p< 0∙01, two-sided). Delegation led to an expected
pay-off of 5∙93, while the choice of the fair and unfair allocations led to expected pay-offs of 4∙80 and 4∙73, respectively. Our three variants of treatment D&P all confirm that delegation is A’s most profitable choice. In treatment asymmetric, delegation resulted in an expected pay-off of 6∙42, while the choice of the fair allocation resulted in an expected pay-off of 4∙89 (Wilcoxon signed-rank test, p< 0∙01). In treatment random, delegation leads to an expected pay-off of
5∙07, while the choice of the fair and unfair allocation resulted in expected pay-offs of 4∙82 and 4∙36, respectively. These differences are however only significant at the 5% and 10% level, re-spectively; two-sided Wilcoxon signed-rank test, p= 0∙02 (fair vs. delegation) and p = 0∙07 (unfair vs. delegation). In treatment repeated, we find that delegation led to an expected pay-off of 6∙08, while the choice of the fair and unfair allocations led to expected pay-offs of 4∙64 and 5.82, respectively. The expected delegation pay-off is weakly significantly higher than being fair but not significantly different from being unfair ( p= 0∙083 and p = 0∙738, respectively; OLS regressions, standard errors corrected for correlations in matching group clusters).17
In contrast, in our delegation treatment without punishment, the pay-off maximizing choice is choosing the unfair allocation because not all Bs are unfair (i.e. delegation is weakly domi-nated). As an aside, it is interesting to observe that a fraction of As nevertheless delegated the decision right—even though avoiding punishment cannot be the reason.18 Choosing the unfair
16. Neither A’s nor B’s allocation choices change over time. In a probit model with allocation choice as dependent variable (for A the data are restricted to the non-delegation cases, for B to the delegation cases) and period as single regressor, we find p= 0∙62 for A and p = 0∙21 for B; standard errors corrected for correlations in matching groups.
17. We calculate expected pay-offs given Bs’ average choices and the punishment pattern in the respective treat-ments, i.e. we use the decisions of all Cs and not only of the randomly chosen ones. In treatment random, the random-ization probability 0∙4 and not the realized one is used. In treatment repeated, we use the average realized pay-off and not the expected pay-off based on all decisions of Bs and Cs because these decisions could be time dependent. Using all decisions of Bs and Cs leads to very similar numbers of 6∙25, 4∙75, and 5∙57 for delegation, the fair, and the unfair allocation choice, respectively.
18. Assuming common knowledge of rationality and selfishness, A is indifferent between being unfair and delegat-ing. Yet, when adding a tiny amount of uncertainty about B’s subsequent action, A strictly prefers being unfair himself,
i.e. only being unfair oneself is trembling hand perfect. Models of inequity aversion also do not predict delegation. Only
allocation might however involve psychological costs, which could be avoided by delegating. This interpretation is in line with economic models in which decisions are not only governed by preferences over outcomes but also by the desire to avoid cognitive dissonance or guilt, or to maintain a positive self-image (Konow, 2000; Benabou and Tirole, 2002; Prelec and Bodner, 2003; Battigalli and Dufwenberg, 2007). It is in A’s self-interest to choose the unfair allocation, but making the unfair choice might be in conflict with his resolution to divide fairly or he might reveal (to himself) that he is a selfish and greedy person. If instead B chooses the unfair allo-cation, A might receive the higher pay-off without experiencing cognitive dissonance between self-interest and fairness or without sending a signal that he is a person who increases his pay-off at the expense of others.19
5. AN ECONOMETRIC COMPARISON OF THE DIFFERENT PUNISHMENT MOTIVES In this section, we evaluate the predictive power of the punishment motives outcome, intention, and responsibility that we discussed in Section 3. The results presented in Section 4 show, e.g. that models of inequity aversion correctly predict that there is some amount of punishment if the unfair allocation is chosen and no punishment if the fair allocation is chosen. But they do not predict that punishment depends on who chose the unfair allocation. The latter observation is better captured by models of intention-based reciprocity. But these models also predict that punishment depends neither on whether A delegates to B or to the die, nor on the finally prevail-ing outcome. We however find that the punishment patterns are fundamentally different in these cases. To evaluate the different models in a systematic and comprehensive way, we introduce simple measures for the intensity of the respective punishment motives. The measure values are normalized in the interval from zero to one, and a measure value of one (zero) indicates the rela-tively strongest (weakest) punishment prediction for a player in a given situation. The measures are used, one by one, as regressors in OLS regressions with the punishment points for As and Bs in the different situations as dependent variable. The predictive power of the models is then judged by the proportion of the explained variance.
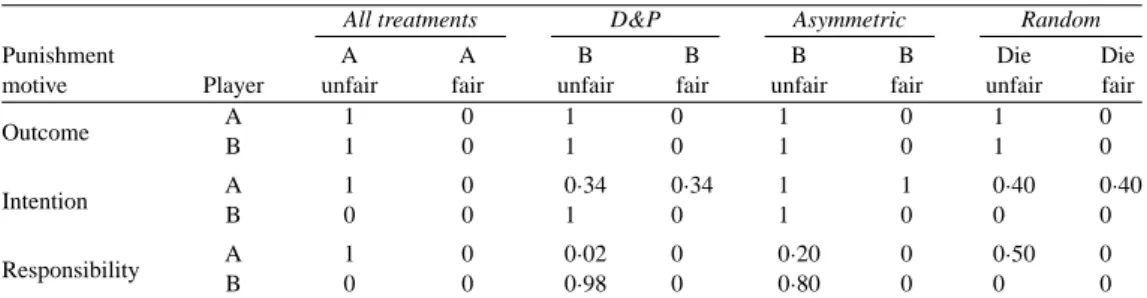
Table 4 shows the values of the outcome, intention, and responsibility measures in all situa-tions of the treatments. The derivation of the values of the outcome measure is simple. The more unequal the outcome, the higher the predicted punishment for players with favourable outcomes. Hence, the values of the outcome measure for As and Bs are 1 if the unfair allocation is cho-sen (relatively strongest punishment prediction) and 0 if the fair allocation is chocho-sen (relatively weakest punishment prediction). Importantly, predicted punishment does not depend on whether A, B, or the die chooses the allocation because only outcomes matter.
The intention measure indicates the unkindness of a player’s action. The more unkind a player’s action, the higher the predicted punishment for the player. The unkindness of an action depends on a player’s action space and, in situations with delegation, potentially also on second-order beliefs. The measure values for players who choose the allocation are simple. The action space ranges from being fair to being unfair and the resulting outcome is certain. Hence, if A or B chooses the unfair allocation, he chooses his relatively most unkind action, which results in a measure of 1. If a player chooses the fair allocation, the respective measure is 0. If A delegates, his intention measure in treatment D&P depends on second-order beliefs. To learn about the
19. For related experimental findings see, e.g. Dana, Cain and Dawes (2006), Broberg, Ellingsen and Johannesson (2007), and Lazear, Malmendier and Weber (2010).
TABLE 4
Punishment motives
All treatments D&P Asymmetric Random
Punishment A A B B B B Die Die
motive Player unfair fair unfair fair unfair fair unfair fair
Outcome A 1 0 1 0 1 0 1 0 B 1 0 1 0 1 0 1 0 Intention A 1 0 0∙34 0∙34 1 1 0∙40 0∙40 B 0 0 1 0 1 0 0 0 Responsibility A 1 0 0∙02 0 0∙20 0 0∙50 0 B 0 0 0∙98 0 0∙80 0 0 0
beliefs, we conducted a separate belief elicitation session.20The value of 0∙34 follows from the average belief that 34% of Bs choose the unfair allocation, which is a reasonable value since the true fraction is 40%. In treatment random, second-order beliefs are controlled for by the com-monly known randomization probability 0∙40, hence this probability determines the intention measure. In treatment asymmetric, delegation is A’s most unkind action (recall that he cannot be unfair), hence the intention measure is 1.21Importantly, in all three treatments, A’s intention measure in case of delegation does not depend on the final outcome. Otherwise A’s intention when delegating would depend on the subsequent realization of a probabilistic outcome (see footnote 8). If A chooses the allocation or delegates to the die, B cannot make a decision. B’s intention measure is then 0 because he did not take an unkind action.
Our measure of responsibility equals a player’s share in the probability increase of the unfair outcome. The higher a player’s responsibility for the unfair outcome, the higher the predicted punishment for this player. The measure ranges between zero and one by design and the values in Table 4 follow directly from its definition in Section 3.3 and in situations with delegation po-tentially also from beliefs about average play. In the following cases, the measure is independent of beliefs. First, if the unfair outcome does not realize, the measure is always 0 for both A and B. Second, if A is unfair, his measure is 1. Third, if B cannot make a decision, his measure is 0. If A delegates and the unfair allocation results, however, beliefs are important. If B is unfair in treatment D&P, A’s and B’s responsibility measures are derived by averaging over the measure values that result from the individual subjects’ beliefs in the belief elicitation session. The val-ues of 0∙02 for A and of 0∙98 for B result because most subjects believe that As and Bs choose very similarly, which is reasonable since there is no significant difference in the choice data.22 Therefore, if A delegates he either lowers the probability of the unfair allocation and is then
20. In the belief elicitation session we explained the different treatments to the subjects, who did not participate in any of our other sessions, and informed them that we had conducted the treatments in the past. The subjects had to guess the frequencies with which As and Bs delegated or chose the different allocations. Answers were incentivized as the subjects earned the more, the better their beliefs matched actual play. We use the elicited beliefs as second-order beliefs because there is no reason why Cs’ beliefs about As’ beliefs about Bs’ strategies should differ systematically from the beliefs of the subjects in our belief elicitation session about Bs’ strategies. We did not elicit beliefs for treatment repeated (notice that the beliefs can differ from period to period) and we therefore do not use this treatment for the analysis in this section. Importantly, our results do not depend on the exact belief values; we can replicate the results in Table 5 below using uniform beliefs.
21. Delegation is as kind as being fair only if Cs’ second-order beliefs are such that As believe that Bs are always fair. Our belief elicitation session however reveals the belief that 39% of Bs are unfair; the true value of 64% is even higher. Hence, delegating is an unkind action and in this treatment it is the most unkind action A can take.
22. On average, subjects believe that 49% of As delegate, that 38% of As are unfair if they do not delegate, and that 34% of Bs are unfair if they have to decide.
TABLE 5
The predictive power of different punishment motives
(1) (2) (3) (4) (5) Outcome 2∙041 ∗∗∗ 0∙512∗∗∗ (0∙105) (0∙097) Intention 2∙738 ∗∗∗ 0∙314∗∗ (0∙161) (0∙140) Outcome× intention 3∙189 ∗∗∗ −0∙194 (0∙170) (0∙304) Responsibility 3∙760 ∗∗∗ 3∙262∗∗∗ (0∙199) (0∙362) Constant 0∙253∗∗∗ 0∙286∗∗∗ 0∙356∗∗∗ 0∙396∗∗∗ 0∙213∗∗∗ (0∙043) (0∙042) (0∙041) (0∙041) (0∙042) Observations 1788 1788 1788 1788 1788 R2 0∙21 0∙29 0∙37 0∙42 0∙43
Notes: The dependent variables are punishment levels of player As and Bs. The table shows results of OLS regressions.
Robust standard errors are reported in parentheses, allowing for clustering at individual Cs. Due to a programming error, we lost four punishment observations in our first session of treatment D&P so that we have only 1788 instead of 1792 observations.
not responsible at all or he increases it only slightly. The bulk of the probability increase thus results from B’s action. In treatment random, if A delegates to the die and the result is unfair, the value of 0∙50 for A results from the fact that exactly half of the subjects in the belief elicitation session believe that As who do not delegate select the unfair allocation with a probability ex-ceeding 0∙40. This belief results in a measure value of 0 because A decreases the probability of the unfair outcome if he delegates. All other beliefs result in a value of 1 because A is then the only player who increases the probability. Averaging thus results in the value 0∙50. In treatment
asymmetric, averaging over the responsibility measures of the individual subjects in the belief
elicitation session results in the values of 0∙20 for A and of 0∙80 for B if B is unfair.23
Table 5 reports the results from OLS regressions that predict assigned punishment points for As and Bs with the three measures outcome, intention, and responsibility. To combine the strengths of the outcome and intention models—outcome-based models are successful in predicting when there is punishment, intention-based models are better in explaining who is punished—we also consider the interaction of the outcome and intention measures (see Falk and Fischbacher, 2006). The exact values of the regressors can be read from Table 4.
Since all models are translated into one parameter, the R2 in regressions (1) to (4) can be compared directly. They provide a clear picture: the predictive power of the outcome motive is lowest (R2= 0∙21), the intention motive is third (R2= 0∙29), the interaction of outcome and intention is second (R2= 0∙37), and the responsibility motive is best (R2= 0∙42). In regression (5), all models are included simultaneously. The regression shows that outcome, intention, and responsibility significantly contribute to the explanation of the punishment pattern. However, the comparison with regressions (1) to (4) shows that the coefficient of responsibility is rather robust, while the coefficients of the other variables are affected by introducing the other controls, and outcome and intention add quantitatively little explanatory power on top of responsibility (R2= 0∙43).24
23. On average, subjects believe that 62% of As delegate and that 39% of Bs are unfair.
24. Ordered probit, tobit, and fixed-effect models all confirm that responsibility is the best single predictor. In Model (5), outcome and responsibility are always significant, while intention and the outcome–intention interaction are sometimes insignificant and sometimes even have a negative sign.
6. CONCLUSION
This paper provides experimental evidence on punishment assignment for outcomes of delegated decisions, which we interpret as a measure of responsibility attribution. If along with the decision right the responsibility attribution for the resulting outcome is also delegated, then responsibility shirking and punishment avoidance can be important motives for the delegation of a potential unpopular decision. As an example, we discussed the business of interim managers that not only bring specific knowledge and support to firms undergoing a restructuring process but—as asserted by a company offering such services—also take the blame for unpopular decisions that often have to be made in that process. This paper provides clean evidence that blame shifting by way of delegation indeed works and that decision rights are delegated on exactly this account. These results show that delegation can also be motivated by reasons other than those usually given in the economics literature, such as skills, work load, commitment, or incentives.
Moreover, our paper proposes a simple measure of a player’s responsibility for an outcome of a game. The measure attributes most responsibility to players who increased the probability of that outcome most. In our experiments, the responsibility measure outperformed measures based on inequity aversion or reciprocity in predicting punishment assignments. This result lends support to our interpretation that punishment reflects responsibility attributions.
The flip side of our main result—the possibility that someone can be rewarded for making a decision—might explain why in some cases decisions are not delegated, possibly even though there is, e.g. an agent with more adequate skills or superior information. While in this paper we restrict ourselves to studying punishment, we hope that future research studies reward and corroborate our general point that responsibility attributions are important to understand why decisions are delegated in some cases but not in others.
APPENDIX
A formal measure of responsibility
In Section 3 of this paper, we introduced a simple measure of a player’s responsibility for the unfair outcome in our games. In this appendix we provide a more general and formal definition of the responsibility measure. The measure is not meant to be comprehensive of the complex meaning of the notion of responsibility. It is rather meant to be simple but nevertheless to capture some basic understanding of what it means to be responsible for an outcome of a game.
The measure assigns most responsibility for an outcome to the player whose action(s) had the largest impact on the probability that this outcome results. We assume that a player or an outside observer who evaluates a player’s responsibility holds a belief about how people who play the game decide on average at the different nodes, i.e. about the distribution of players’ strategies. This belief determines at each node of the game the probability that the outcome of interest will be reached. In an actual play of the game, a player’s action at a node can change this probability. A player takes on responsibility for an outcome if and only if his action(s) increase the probability of the outcome. If more than one player increases the probability, each player’s share in the overall increase is calculated. In the calculation of the overall increase, moves of nature are not included. This captures the idea that only people but not chance can be responsible for an outcome. Finally, if the outcome of interest is not realized, the measure is zero. This captures the idea that nobody must be held responsible for an event that did not happen.
Consider a multi-player extensive form game with complete and perfect information and a finite number of stages. Let= = {1, ..., I } be the set of players and i be a player in the game. Let N denote the set of nodes and Nithe set of nodes where player i has the move. Let m, n∈ N be nodes of the game. If node n follows node m (directly or indirectly), we denote this by m≺ n. Given m ≺ n, let ν(m,n) be the unique node that directly follows node m on the path from m to n. Let F be the set of end nodes and f a single end node. The pay-off function for player i be defined asπi: F→ R, whereR is the set of real numbers. Let Anbe the set of actions at node n. Let P( An) be the set of probability distributions over the set of actions at n. Si= 5n∈NiP( An) is player i’s behavioural strategy space, si∈ Sia behavioural strategy of
player i , and S= 5i∈=Sithe behavioural strategy space of the game. Letβ∈ S denote a player’s or an outside observer’s belief (at the time of his responsibility assessment) about the strategies of people who play the game. This belief is meant to reflect the average behaviour of players in the game.β can thus be interpreted as a probability distribution over pure behavioural strategies. Furthermore, let g be a probability distribution over S, being the space containing beliefs. One can
think about g as capturing an observer’s belief uncertainty. That is, in contrast to usual game theoretical models, we do not introduce an equilibrium notion that imposes a restriction on beliefs. Finally, assume an outcome indicator function ω : F→ {0,1}. In our games, we are interested in a player’s responsibility for the unfair allocation, so the outcome function equals 1 if the unfair allocation is chosen and it equals 0 if the fair allocation is chosen. Let Prβ[ω= 1|n] denote the probability of reaching the unfair allocation at node n given beliefβ. Since β is defined as an element of a behavioural strategy space, it also defined when node n is reached with probability zero. For simplicity, we do not account for how unfavourable an outcome is for certain players. The measure could however be generalized to contain a more general outcome functionω. Instead of Prβ[ω= 1|n], we would then write Eβ[ω|n] to denote the expected value of ω at node n givenβ.
We now define the responsibility of a player i for (the probability of) the unfair outcome at node n. It captures how much player i affected the probability of that outcome before node n was reached. We define this responsibility measure in three steps. First, player i ’s raw responsibility for (the probability of) the unfair outcome at node n, given beliefβ, is defined as ri0(n|β ) = max X m∈ Ni m≺ n (Prβ[ω= 1|ν(m,n)] − Prβ[ω= 1|m]),0 , (A.1)
the sum of changes in Prβ[ω= 1|n] that resulted from a player’s move(s) along the path to n. If player i’s moves resulted in a net decrease of the expectation of the unfair outcome, then his raw responsibility is defined to be zero. In our games, if a player reduces the probability that the unfair outcome is realized, he is not responsible should it nevertheless finally realize.
Second, player i ’s share in total raw responsibility for (the probability of) the unfair outcome in node n, given beliefβ, is defined as ri(n|β) = ri0(n|β) P j∈=r 0 j(n|β) (A.2)
if the denominator is strictly positive and as zero otherwise. This expression measures a player’s share in the proba-bility change of the unfair outcome. If the probaproba-bility of the unfair outcome is not increased, then no player takes on responsibility. A player’s share lies between 0 and 1. Notice that the denominator sums up all players’ raw responsibil-ities, but that it does not include nature. This is to capture that responsibility can only be borne by people but not by chance.
Finally, player i ’s responsibility for (the probability of) the unfair outcome at node n, given probability distribution
g over beliefs, is defined as
Ri(n)= Eg[Prβ[ω= 1|n] ∙ri(n|β)]. (A.3)
There are two features to notice in the definition of Ri(n). First, player i’s share in total raw responsibility is weighted by Prβ[ω= 1|n], the probability of the unfair outcome at node n, given belief β. In our games, if n is a node where C makes his punishment decisions, then irrespective ofβ this probability is either 1 or 0, i.e. the event of interest did either happen or not. Thus, if the unfair outcome is not realized, a player’s responsibility is defined to be zero, even if his action(s) increased the probability of the unfair outcome. Second, the responsibility measure allows for belief uncertainty, i.e. it does not require that an observer holds a point belief about the players’ strategies but allows for a non-degenerate distribution over beliefs.
We introduce belief uncertainty also to increase the measure’s robustness. This can be seen as follows. Suppose that As who do not delegate and Bs who can decide between the two allocations are equally fair on average, and that this is also the point belief of an observer. Then, by delegating, A does not take on responsibility. But if the observer is to some extent uncertain about As’ and Bs’ average behaviour, then the responsibility measure assigns some responsibility to A in case of delegation. In this sense, allowing for a non-degenerate g “smoothes” the responsibility measure when small changes inβ occur.
A player’s responsibility from the point of view of the observer is then given by taking the expectation over this distribution. Equation (A3) can also be interpreted as averaging over heterogeneous beliefs of multiple observers whose responsibility attributions are to be captured. Equation (A3) then captures the average responsibility assignment of multiple observers. Indeed, this is how we calculate the players’ responsibility measures in Table 4 of the paper.