HAL Id: insu-00347919
https://hal-insu.archives-ouvertes.fr/insu-00347919
Submitted on 2 Jan 2009HAL is a multi-disciplinary open access archive for the deposit and dissemination of sci-entific research documents, whether they are pub-lished or not. The documents may come from teaching and research institutions in France or abroad, or from public or private research centers.
L’archive ouverte pluridisciplinaire HAL, est destinée au dépôt et à la diffusion de documents scientifiques de niveau recherche, publiés ou non, émanant des établissements d’enseignement et de recherche français ou étrangers, des laboratoires publics ou privés.
Chemical patterns of erupting silicic magmas and their
influence on the amount of degassing during ascent
Alain Burgisser, Bruno Scaillet, Harshvarhan Harshvarhan
To cite this version:
Alain Burgisser, Bruno Scaillet, Harshvarhan Harshvarhan. Chemical patterns of erupting silicic mag-mas and their influence on the amount of degassing during ascent. Journal of Geophysical Research : Solid Earth, American Geophysical Union, 2008, 113 (B12204), 14 p. �10.1029/2008JB005680�. �insu-00347919�
Chemical patterns of erupting silicic magmas and
their influence on the amount of degassing during
ascent
Alain BURGISSER1 burgisse@cnrs-orleans.fr Bruno SCAILLET bscaille@cnrs-orleans.fr HARSHVARDHANISTO-CNRS, 1a rue de la Férollerie, 45071 Orléans cedex 2, France
1Corresponding author
Word count: Abstract 210, Main text 6550 3 Tables, 13 Figures
Abstract
We present a chemical model of magma degassing based on nine volatile species part of S-O-H-C-Fe-bearing rhyolitic melts. It is based on equilibrium, closed-system degassing, and does not take in account the crystallization of mineral phases. For given initial conditions at depth, the model calculates the gas composition as pressure decreases, as well as physical variables controlling conduit flow. We conducted a parametric study of degassing by varying initial conditions at depth within the range typical of arc magmas and characterizing the chemical evolution of the volatile components during the ascent to the surface. The resulting complex patterns of chemical changes are controlled by four groups of interrelated parameters: 1) redox state, f H2, and H2S/SO2 ratio in the gas phase, 2) gas amount, 3) melt water content and f H2O, and 4) relative melt sulfur content, f CO2, and C/S ratio in the gas phase. The others degrees of freedom (temperature, initial pressure, and melt iron content) alter the amplitude of the chemical fluctuations during ascent, but do not change the general degassing patterns. When degassing starts at depth, volatile chemistry has little effect on the amount of degassing as measured by the evolution of porosity. Magma expansion at shallow levels, however, can be greatly affected by degassing chemistry.
Introduction
1 2 3 4 5 6 7 8 9 10 11 12 13 14 15 16 17 18 19 20 21 22 23 24 25Monitoring of gas plumes is a major tool to mitigate volcanic eruptions (e.g., Young et al. 1993). Volcanologists have long noted that not only the chemical composition of the gases emitted at the vent during eruptions varies widely from volcano to volcano, but also that it often changes during the course of a single eruption (Symonds et. al, 1994). In parallel, recent progresses in experimental petrology and thermodynamic modeling have made possible to calculate the gas composition that coexists with a given magma at depth (e.g., Ghiorso and Sack, 1995; Papale, 1999; Moretti et al., 2003; Scaillet & Pichavant, 2003; Moretti and Ottonello, 2005; Papale et al., 2006). It has recently been shown that chemical modeling of degassing has the potential to bridge the apparent discrepancy between gas compositions calculated at depth and measured at the surface, as it shows that similar initial conditions at depth can lead to very different chemical evolution during ascent. Modeling of magmatic degassing (e.g., Papale and Polacci, 1999; Newman and Lowenstern, 2002; Moretti and Papale, 2004; Papale, 2005; Aiuppa et al., 2007; Burgisser and Scaillet, 2007) has largely benefited from the recent expansion of carefully controlled experimental databases, and their outputs show such complex degassing patterns that it is impossible to predict the gas composition at vent without actually performing the full calculation.
In this work, we use such a degassing model to map out the evolution of natural, volatile-bearing rhyolitic melts in order to asses the effects of intensive parameters on the chemical evolution of the magmas during their ascent to the surface. We build on previous work, which focused on O-H and S-O-H-Fe systems (Burgisser and Scaillet, 2007), by extending our chemical model of magma ascent to nine volatile species: H O, H , O , SO , H S, S , CO , CO, and CH . These species comprise >99 mole% of
26 27 28 29 30 31 32 33 34 35 36 37 38 39 40 41 42 43 44 45 46 47 48 49
the volatiles commonly measured in arc volcanoes (Delmelle and Stix, 2000). The role of dissolved iron and the possibility of precipitating graphite in the gas phase are also taken in account. Altogether these species belong to the S-O-H-C-Fe system, which controls the redox state of the ascending magma we model.
We assume degassing occurs at equilibrium and in a closed system, which allows us to calculate gas composition by mass balance using a combination of chemical reactions in the gas phase and solubility laws. This model explores a research venue by which the conserved quantities during decompression are the total amount of atomic C, S, O, and H. As a result, the redox state of the ascending magma is calculated by the model as pressure decreases, relaxing the constraint of imposing a given redox buffer, thus inaugurating an approach complementary to that of, e.g., Moretti and Papale (2004). One shortcoming is that species activities in the melt are not calculated, which prevents our model to solve for the crystallization of mineral phases. In particular, we cannot consider the role of iron in crystals as redox buffer, which restricts us to cases where either magma ascent is fast enough to avoid extensive crystallization, or melt chemistry does not allow Fe- or S-bearing crystals to precipitate. On the other hand, our assumption of equilibrium implies that the model does not capture the diffusion-controlled chemical evolution occurring in the near-fragmentation region of the Plinian regime (Gardner et al., 1999).
For given conditions at depth, the model calculates the gas composition as pressure decreases. After laying out the model inner workings, we present its calibration against experimental data and review key assumptions. We then conduct a parametric study of degassing by varying initial conditions within the range of values commonly found in arc magmas, so as to tally the degassing behavior of these natural
50 51 52 53 54 55 56 57
systems. We finally explore how the chemistry of degassing influences the development of porosity during ascent.
Chemical model of the C-S-O-H-Fe system
The chemistry formulation is based on that of Burgisser & Scaillet (2007) and Clemente et al. (2004). The gas phase is composed of n=9 species, each with a molar fraction mi: 1 1 =
∑
= n i i m (1)Conversion between molar fraction and weight fraction is:
∑
= j j j i i i M m M m x (2) 58 59 60 61 62 63 64 65 66 67where Mi are molecular weights of each species. The total weight fraction of each
species (wTi) is the sum of its exsolved part and its dissolved part:
( )
b(1 gT) i i i gT Ti w x a f w w = + i − (3)where wgT is total gas weight fraction, ai and bi are solubility constants determined
experimentally (Table 1), and fi is species fugacity. Equation (3) assumes Henrian-like
behavior of the volatile species, with a temperature dependence on solubility for H2O, H2S, and CO2. As shown in the next section, the total gas weight fraction in the second term on the right-hand-side of Equ. (3) can be neglected so as to simplify the numerical resolution:
( )
bi i i i gT Ti w x a f w = + (3a) 68 69 70We assume the gas phase is an ideal mixture of non-ideal gases, which yields the following expression for fugacities:
P m
fi =γi i (4)
where P is total pressure, and coefficients γi are calculated at each pressure step
following Holland & Powell (1991) for H2O, Shaw & Wones (1964) for H2, and Shi and Saxena (1992) for the other species. Using (2) and (4), (3a) can be written as: 72 73 74
(
bi i i i j j i i gT Ti a mP M m M m w w = + γ∑
)
75 76 (5) The gas phase is composed of 9 species that are in equilibrium at all times:(
)(
) (
)
1/2 2 1 2 2 1 − − = f H O f H f O K (6) 77)
78 K2 =(
f SO2)(
f S2) (
−1/2 f O2 −1 (7)(
)(
) (
) (
)
1 2 2 / 1 2 2 / 1 2 2 3 − − = f H S f O f S f H O K (8) 79 80 K4 =(
f CO2)(
f CO) (
−1 f O2)
−1/2 (9)(
) (
)(
) (
)
1 2 2 / 1 4 2 2 / 1 2 5 − − = f CO f H O f CH f O K (10) 81 82 83 84 85 86where K1, K2, K3, K4, and K5 are equilibrium constants following an Arrhenian
dependence of the type A+B/T by adopting the 1-bar temperature of interest as standard state (Ohmoto and Kerrick, 1977). The total weight percents of atomic oxygen (wTO), atomic hydrogen (wTH), atomic sulfur (wTS), and atomic carbon (wTC)
are given by:
CO TCO CO2 TCO2 SO2 TSO2 O2 TO2 H2O TH2O O TO M w M w M w M w M w M w + + + + = 2 2 2 (11) 87 CH4 TCH4 H2S TH2S H2 TH2 H2O TH2O H TH M w M w M w M w M w 2 2 = + + + (12) 88 SO2 TSO2 H2S TH2S S2 TS2 S TS M w M w M w M w + + = 2 (13) 89 CH4 TCH4 CO2 TCO2 CO TCO C TC M w M w M w M w + + = (14) 90
3 2 2 2 1 2FeO+ O =Fe O (15) 92 93 94 95 96 97 98
Instead of accounting for the activities of FeO and Fe2O3 dissolved into a rhyolitic melt (such as in Ghiorso and Sack., 1995; Gaillard et al., 2003a; Moretti et al., 2003; Ottonello et al., 2001; Moretti, 2005), we included the redox effects of iron into our thermodynamic model by using an empirical relationship that links, at constant temperature, the molar ratio of FeO and Fe2O3 to the oxygen fugacity (Kress and Carmichael, 1991):
( )
T P h T P f m d c T b fO a m m KC KC k k k KC KC KC KC FeO O Fe 2 2 3 2 ln ln ⎟⎟= + + + + + ⎠ ⎞ ⎜⎜ ⎝ ⎛∑
(16) 99 100 101 102 103 104 105 106 107 108 109 110 111 112 113 114where k is one of (FeO*, Al2O3, CaO, Na2O, and K2O), mk is the total molar
fraction of these species, and aKC, bKC, cKC, dKC k, fKC, hKC are constants given in Kress
and Carmichael (1991). We calculated the redox effect of iron in the C-S-O-H system by using (16) and keeping track of the total amounts of iron (wTFe), oxygen in the FeO
and Fe2O3 form (wTO(Fe)), and oxygen in the O2, H2O, SO2, CO, and CO2 form (wTO).
At each pressure step, graphite activity in the gas phase is calculated, so as to test for its precipitation.
Resolution
The resolution is carried out in two steps. First, P, T, wgT, fH2O, fH2, fCO2, and
FeO* are set at depth so that the composition of the gas phase and the total amounts of each element could be determined. Because the relation (16) contains the total molar fraction of several oxides and the mass balance of the gas phase (11-14) is in weight fraction, conversions between the two units are needed, and the total composition of the melt should also be fixed. Thus, we used the total weight fraction of 9 major oxides of a typical rhyolite (SiO2, Al2O3, TiO2, CaO, Na2O, K2O, MgO, MnO, and
P2O5). These initial values add up to 100%, and need to be corrected to take in account the amounts of volatiles and iron. Although the initial quantity of FeO* (wTFeO*) is set, the initial amount of oxygen in the FeO and Fe2O3 form is not known and should be determined using the empirical equation (16). This renormalization imposes to first calculate the total amount of volatile elements, and the oxygen fugacity. 115 116 117 118 119 120 121 122 123 124 125 126 127 128 129
The molar composition of the gas phase can be determined by using (4) to calculate mH2O, mH2, and mCO2, by using (4, 6, 9-10) to calculate mO2, mCO, mCH4, and
fO2, and by using (1), (4), and (7-8) to calculate mSO2, mH2S, and mS2. Converting
molar fractions to fugacities, and using the solubility laws (5) and the total gas fraction gives us the total amounts of sulfur, hydrogen, carbon and “free” oxygen wTO.
Now, the initial quantities of the 9 major oxides can be normalized so that the 9 oxides, plus the volatile elements (wTO, wTS, wTH, and wTC), plus the total iron (wTFeO*)
add up to 100%. Then, the total molar fraction of FeO*, Al2O3, CaO, Na2O, and K2O are calculated using:
∑
= j j Tj i Ti i M w M w m 1 (17) 130 131 132The total amounts of iron and oxygen fixed by the iron can be expressed as:
3 2 2 Fe O FeO Fe m m m = + 3 2 ) (Fe FeO 3 Fe O O m m m = + (18) 133
134 The oxygen fixed by the iron is thus:
F F m mO Fe Fe 2 1 3 1 ) ( + + = (19) 135
where the symbol FeO O Fe m m
F = 2 3 has been used. Using Fe
FeO TFeO TFe M M w w = * and the
conversion (17) for wTFe and wTO(Fe) yields the total amount of oxygen fixed by the
iron: 136 137 138 F F M w M w Fe TFe O Fe TO 1 2 3 1 ) ( + + = (20) 139 140 141 142 143 144 145 146 147 148
The mass balance can now be rigorously carried out by adding the 9 oxides, the volatiles species (wTO, wTS, wTH, and wTC), the total iron (wTFe) and the oxygen fixed
by the iron (wTO(Fe)). The total molar fractions mk can be updated using (17) and are
used in (16) for the rest of the simulation. Because the system is closed, all the quantities involved in the mass balance, except wTO and wTO(Fe), are considered
constant. The reaction (15) imposes an exchange of oxygen between that locked in the iron-bearing species and that involved in the C-S-O-H redox reactions. The sum wTO +
wTO(Fe) = wTO(Total), however, remains constant. Thus, using (20), the total amount of
“free” oxygen wTO can be related to f O2:
F F M m M m w w j j j O Fe Total TO TO 2 1 3 1 ) ( + + − =
∑
(21) 149 150 151 152 153 154 155 156 157 158The second step of the resolution is to solve the system each time pressure decreases. Mass conservation (1) and (11-14), chemical equilibrium (6-10), and solubility laws (5) are used jointly to solve for the eleven unknowns (molar fractions
mi, the total gas weight fraction wgT, and the oxygen fixed by iron wTO(Fe)).
The numerical resolution of (21) needs to be coupled with that of the C-S-O-H system. For each pressure step, solving for the redox equilibrium of the volatile species yields an fO2. After algebraically reducing the redox system to three conservation equations on wTO, wTS, and wTH, respectively, we use a globally
these three quantities are conserved to a precision typically <10-6. This fugacity is used in (16) and (21) to obtain a new amount of “free” oxygen. The redox equilibrium of the volatile species is solved again with the updated wTO, and the process is
conducted iteratively until desired precision (typically <10-6 on wTO) is reached. In
most cases, an under-relaxation factor of 0.2 is applied to the updated wTO to ensure
convergence in 10 to 20 iterations, but some fine-tuning is needed for cases with strong redox gradients. Precision lower than 10-4 on wTO tend to cause numerical
oscillations on f O2, highlighting the sensitivity of the redox state to small variations of the mass balance. Runs without Fe generally take less than an hour on a standard PC computer, whereas Fe-bearing runs can take up to a few hours.
159 160 161 162 163 164 165 166 167 168 169 170 171 172 173 174 175 176 177 178 179 180 181 182
Model assumptions and calibration against experimental data
The approach we followed in building the present model arises from three concerns: (1) relax the need to assume a redox buffer during decompression, (2) tailoring the complexity of the thermodynamic model to the amount and precision of experimental data available to calibrate it and (3) simplify the mathematics so as to yield a computationally efficient code.The first point brought us to carry out calculations at each pressure step by mass conservation so that the redox state of the magma stems from chemical equilibrium in the gas phase, solubility laws, and mass conservation. The existence of a chemical liquid in which volatile species are dissolved is taken in account by the double assumption of thermodynamic equilibrium between gas and liquid (i.e., fugacities of species in the gas phase equal those in the liquid phase) and that species solubilities are not interdependent. As mentioned earlier, the drawback is the inability to solve for the crystallization of redox-controlling mineral phases such as magnetite or pyrrhotite.
183 184 185 186 187 188 189 190 191 192 193 194 195 196 197 198 199 200 201 202 203 204 205 206 207
The second point is illustrated by Fig. 1, which shows the predicted vs. measured amounts of volatiles in the melt using our solubility laws. The parameter ranges covered by the experimental data we used for model calibration are indicated in Table 2. Although simple, the model displays the ability to satisfactorily reproduce the behavior of H2O, H2S, and CO2. We considered the solubility of SO2 temperature independent because experimental data lack the trend necessary to derive such dependence (see Clemente et al., 2004), as apparent in the greater scatter of the SO2 data (Fig. 1). The choice of coupling empirical relationships on iron redox state (16) and experimentally-calibrated solubility laws (3a) partially accounts for cross-effects of species that were not considered in our model. For instance, interactions between gaseous and liquid species of the H2O-S system (e.g., Moretti and Ottonello, 2005) are empirically represented through the calibration of our sulfur solubility laws with data obtained on hydrous rhyolite (Table 2).
The assumptions of Henrian-like behavior of the volatile species and their ideal mixing in their gaseous state imply that we neglect any cross-effects of the species in determining their saturation content and their fugacities. As a result, our model has been calibrated on a dataset centered around 2000 bars (Table 2), and is not expected to give good results at higher pressure (>3000 bars), unlike more sophisticated thermodynamic models (e.g., Papale, 1999; Moretti and Papale, 2004).
The last point led us, for instance, to choose Equ. (3a) over (3), so as to ease the future integration of such a code into more realistic degassing and magma ascent models (e.g., Dufek and Bergantz, 2005). The small impact of such a simplification is illustrated by a typical decompression run, where differences between Equ. (3) and (3a) are less than 0.2, 0.02 0.004, 3, 3, 0.06, 0.03, 0.04, and 0.04 percent on mH2O,
208 209 210 211 212 213 214 215 216 217 218 219 220 221 222 223 224 225 226 227 228 229 230 231 232
occur at high pressure (i.e. 1000 bars for a run starting at 2000 bars) for all species but O2, for which the maximum error occurs at the lowest pressure.
Effects of decompression on the chemistry of arc magmas
Decompression causes profound changes in the volatile distribution between melt and gas. As a result, the chemical evolution of gas phase is complex, with the various species changing their relative proportions by orders of magnitudes (Fig. 2). In this work we highlight the general degassing patterns arising from decompressing arc magmas instead of focusing on particular cases. The fundamental observation sustaining such an approach is the recognition that Nature favors certain combinations of intensive parameters at depth (e.g., restricted range of oxygen fugacities) and that such combinations are not necessarily equally represented by the various experimental studies (Table 2). We thus use our calibrated model to explore the range of natural parameters so as to gather a general, first-order understanding of the geochemical trends arising from magma decompression, ascent, and eruption in subduction arc setting. We performed a parametric study that covers the natural range of conditions at depth for arc volcanoes reported by Scaillet & Pichavant (2003, Table 2). Note that we excluded Pine Grove (P=4050 bars, T=675 °C) from the list reported by Scaillet & Pichavant (2003) so as to limit our scope to P≤3000 bars and T≥720 °C and avoid extrapolating the model beyond the domain for which it was calibrated (see Model assumptions and calibration against experimental data). Lower-than-calibrated temperatures are used in some runs, as the linear trends we parameterized make such extrapolation reasonable (Table 1).
The chemistry of the rhyolitic melt is based on that of the Panum Crater Dome (in wt%: SiO2=77.44, Al2O3=12.88, TiO2=0.07, CaO=0.6, Na2O=4.14, K2O=4.76, MgO=0.03, MnO=0.05, P2O5=0.03, Mangan & Sisson, 2000). We present the results
by first fixing total initial pressure to 2000 bars, the temperature to 825 °C, and FeO* to 1 wt%. Two sets of runs were carried out under these common initial conditions. The first set has an initial water fugacity of 1000 bars, which allows 4.43 wt% of water to dissolve in the melt. The second set has an initial f H2O of 1450 bars, or 5.41 wt% of water in the melt. In each set, we varied the initial H2 and CO2 fugacities so as to cover the natural range of redox state, from NNO-0.5 to NNO+1.7, and C/S ratio from 0.3 to 300 (Scaillet & Pichavant, 2003). Table 3 summarizes these 32 initial conditions. Each of the simulations was run with little (0.1 wt%) and a large amount (5 wt%) of initial gas, yielding 64 runs. Note that changing the initial gas content affects the total amounts of elemental C, S, O, and H, as well as total amount of each species, but does not influence other variables listed in Table 3. We then chose representative runs from Table 3 and varied the initial pressure between 1000 and 3000 bars, the temperature between 720 and 930 °C, and the FeO* between 0 and 3 wt%, once again covering the range of values commonly found in arc volcanism (Table 2). Water contents can be used to divide runs into two groups. Within each group, when carbon is added at the expense of sulfur, the C/S ratio increases and systems become depleted in sulfur. Thus, systems will be referred to indifferently by their initial C/S ratios in the gas and by the relative amounts of S dissolved in the melt (e.g., run 1 in Table 3 belongs to the H2O-poor group and represents a S-rich system with a low C/S ratio). As decompression progresses, important chemical changes take place. We use three indicators to track the magnitude of those changes: the redox state of the magma as measured by fO2, the H2S/SO2 and C/S ratios of the gas phase. At a fixed pressure, the redox state of the magma is insensitive to the amount of carbon present in the system. Thus, there is a direct relationship between the redox state as measured by ∆NNO and H2S/SO2 when initial conditions are being set. Although this 233 234 235 236 237 238 239 240 241 242 243 244 245 246 247 248 249 250 251 252 253 254 255 256 257
258 259 260 261 262 263 264 265 266 267 268 269 270 271 272 273 274 275 276 277 278 279 280 281 282
ceases to be true when magma decompresses as a closed system, it is convenient to consider these two indicators together.
Decompressions starting with little gas in the reservoir show one of the most complex patterns of chemical variations. The redox evolution with decreasing pressure of these gas-poor runs can be quite elaborate with the trend at high-pressure often opposite to that at lower pressure, which causes characteristic S-shaped curves that remind of those noted by Moretti and Papale (2004, Fig. 3A). We first use the water-poor group (runs 1-16, Table 3) to further describe these trends. S-rich systems (low C/S ratios) generally tend to converge towards the NNO buffer, changing their initial redox state by as much as 1 log unit in doing so (thick lines, Fig. 3A). In other words, initially oxidized systems (above the NNO buffer) tend to reduce, whereas systems initially below NNO have weak redox variations. In S-poor systems, the redox trend reverses such that it diverges from the NNO buffer; initially oxidized systems become more oxidized at shallow pressure, whereas initially reduced systems reduce further (stippled lines, Fig. 3A). The H2S/SO2 ratio shows a somewhat similar pattern. S-rich systems display a quasi-monotonic decrease of their H2S/SO2 ratio, but the amount of decrease is again controlled by the initial redox state (thick lines, Fig. 3B). H2S/SO2 typically drops less than an order of magnitude for oxidized systems and two orders of magnitude for reduced systems. S-poor systems also decrease their H2S/SO2, but the redox sate acts in the opposite way (stippled lines, Fig. 3B). Oxidized, S-poor systems see their H2S/SO2 drop by more than a factor 1000 at low pressure, whereas reduced systems decrease theirs by only a factor 10.
Decompressions starting with high water content in the melt display behaviors similar to water-poor decompressions (gray areas, Fig. 3). The most notable difference between the two groups of runs is that variations are less pronounced in the
283 284 285 286 287 288 289 290 291 292 293 294 295 296 297 298 299 300 301 302 303 304 305 306 307
water-rich group. As a result, initially reduced systems tend to remain close to the NNO buffer regardless of S content.
At high gas fraction in the reservoir, trends simplify remarkably; the magma reduces itself monotonically of about 2 log unit, except for S-poor, oxidized magmas, for which the reduction dampens at low pressure (Fig. 4A). The H2S/SO2 ratio remains relatively constant, except once again in the case of S-poor, oxidized magmas, for which the ratio decreases up to 2 orders of magnitude (Fig. 4B). We note that the reducing trends are most pronounced for water-poor, reduced systems, which translates into a slight increase in their H2S/SO2 ratio.
The C/S ratio of the gas phase shows a pattern quite distinct from the two previous variables. In gas-poor systems, changes in C/S occur only at high pressure, between 2000 and 1000 bar, and C/S remains constant until atmospheric pressure is reached (Fig. 5). rich systems have C/S variations of less than 65% (~0.2 log units), and S-poor systems see their C/S ratio decrease systematically from 300 down to at least 100 and at most 20, depending on the initial redox state and water content. There is a critical redox state above which C/S decreases and below which it increases. It is mainly controlled by the initial C/S ratio, and weakly by the initial H2O content. S-rich systems display a critical state around NNO+0.5 for H2O-poor systems and NNO+1 for H2O-rich systems, whereas it is always above NNO+1.7 for S-poor systems.
At high gas fraction in the reservoir, buffering effects of the gas phase have the greatest effects on the C/S ratio, which remains constant throughout the decompression regardless of initial water content. This is because C/S varies only at high pressure, where the initial increase of gas is felt the most: a decompression starting with 0.1 wt% gas at 2000 bars has 2.2 wt% gas when it reaches 400 bars,
308 309 310 311 312 313 314 315 316 317 318 319 320 321 322 323 324 325 326 327 328 329 330 331
whereas a decompression starting with 5 wt% gas reaches only 7.3 wt% gas at 400 bars. In other words, changing the initial gas content from 0.1 to 5 wt% corresponds to a 50 times increase at 2000 bars, whereas it translates into an increase of only 3 times at the lower pressure of 400 bars.
We assessed the role of iron dissolved in the melt by varying its amount from 0 to 3 wt%. Figure 6 shows runs for which iron content has the largest impact on degassing chemistry. As expected, iron acts as a buffer with respect to oxygen, dampening somewhat the changes in redox during decompression. This buffering effect is systematically less than 0.75 log unit.
Varying the initial pressure from 1000 to 3000 bars causes little changes in degassing patterns. At higher starting pressure, the initial trend reversal that forms the base of the S-shaped curves in the ∆NNO vs. P and H2S/SO2 vs. P plots (Fig. 3) becomes more distinct. Changes in C/S ratio during decompression become also more pronounced with higher initial pressure.
Varying the magma temperature from 720 to 930 °C was done such that the initial pressure, ∆NNO, and C/S in gas were identical to those of run 10 (Table 3). As a result, the initial H2S/SO2 in gas decreased with increasing temperature chiefly because H2S becomes more soluble at higher temperatures while SO2 solubility remains constant (Table 1). High temperatures smooth the S-shape described by the redox state as a function of pressure (Fig. 7A). The low-pressure convergence towards NNO is maximal at the mid-temperature range (i.e. 825 °C). Temperature exerts some control over the critical redox state above which C/S decreases and below which it increases (Fig. 7B). Here again, the critical state occurs at a higher value (more oxidized) value when the temperature is at mid-range (825 °C). These non-monotonic
behaviors are mostly due to the fact that H2S and CO2 have solubility trends opposed to that of H2O (Table 1). 332 333 334 335 336 337 338 339 340 341 342
Finally, we computed graphite activity using the equilibrium constant of the reaction C + O2 = CO2 given by Ohmoto and Kerrick (1977). In all runs this activity remains largely below unity, thus ruling out the presence of graphite under arc magma conditions.
Effects of chemical changes on the development of porosity
during magma ascent
If a melt density is fixed, say ρl=2200 kg/m3 for a typical rhyolitic melt, the gas
volume fraction of the ascending magma, α, can be calculated from our model outputs at each pressure according to:
1 ) 1 ( 1 − ⎥ ⎥ ⎦ ⎤ ⎢ ⎢ ⎣ ⎡ − + = gT l gT w RT w MP ρ α (22) 343 344 345 346 347 348 349 350 351 352 353
where R is the universal gas constant (8.3144 J/mole °K), and M is the average molar mass of the gas phase:
∑
= = n i i iM x M 1 (23) Our initial conditions at depth are such that gas density varies by a factor ~2,depending on how much sulfur and carbon species are present. At atmospheric pressure, gas density is always close to that of water vapor because the molar proportion of H2O is always >95%. One can thus expect that the effect of chemistry on the evolution of magma density during closed-system ascent from a deep reservoir to the surface is negligible because the largest density changes occur when gas volume fraction is the lowest.
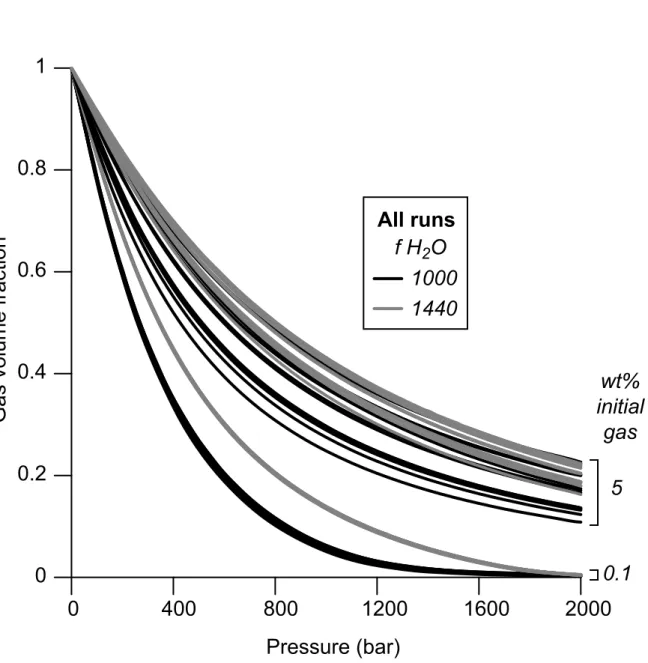
At low initial f H2O, water dominates the composition of the gas phase more rapidly when there is little initial gas (mH2O>0.9 when P<1150 bars) than when there
is a large amount of gas (mH2O<0.9 regardless of pressure). Thus, the effect of initial
chemistry is controlled at low initial gas content by the initial melt water content, which is directly fixed by the initial value of f H2O (Fig. 8). By contrast, varying the initial chemical conditions mostly affects the development of porosity of magmas starting their ascent with a large amount of initial gas in the reservoir. As expected, at equal pressure, magmas with more heavy gaseous species such as SO2 or CO2 will be less porous. 354 355 356 357 358 359 360 361 362 363 364 365 366 367 368 369 370 371 372 373 374 375 376 377 378
These considerations brought us to study closely a specific case in which initial chemistry has major effects on the development of porosity. It necessitates initiating the ascent from shallow depth with a low amount of gas and a water-poor gas phase. To illustrate this phenomenon, we choose to first fix the initial conditions of the reference run close to the equilibrium composition of run 11 at 400 bars (Table 3). Water depletion can be achieved by high amounts of either S- or C-bearing species. Here we use CO2, but similar results can be obtained using SO2 instead. The reference run thus starts with f H2O = 350 bars, f H2 = 0.64 bar, and f CO2 = 25.27 bars, and we impose 0.1 wt% gas (i.e. about 2 vol% porosity). FeO* was set to zero so as to speed calculations up. This corresponds to a gas phase composed of 93.9 mol% H2O, 5.6 mol% CO2, and 0.5 mol% of the remaining 7 species, which allows us to simply use the H2O/CO2 ratio as a proxy for gas composition. We then compare this reference run to three simulations with initial gas composition progressively richer in CO2: 37, 53, and 72 mol%, respectively (Fig. 9A). Note that the H2O/CO2 ratio of these simulations covers the natural range of deep basaltic fluids encountered below silicic systems (Scaillet, unpub. data, 2007).
379 380 381 382 383 384 385 386 387 388 389 390 391 392 393 394 395 396 397 398 399 400 401 402 403
In these shallow decompressions, the porosity profile changes dramatically as a function of the initial chemistry (Fig. 9B). The lower the H2O/CO2 ratio is, the more porosity increases in a sharp manner. At low H2O/CO2, a pressure threshold forms above which magma density changes little and below which magma rapidly foams. The same threshold exists for viscosity and ascent speed, which both increase super-exponentially when crossing it. The threshold occurs roughly when total pressure reaches the initial f H2O. Taking that correlation as a rule, a magma starting with 72 mol% CO2 reaches ~15 vol% porosity at 100 bars, whereas the reference run already reaches that porosity at ~270 bars. This is corroborated by the way both H2O and CO2 exsolve during ascent (Fig. 10). The water content of the melt remains stable until the threshold pressure, while the exsolution rate of CO2 has an inflexion point at that pressure. The relation between total pressure and f H2O is not exact because we assume a mixture of real gases, which causes fugacities to diverge somewhat from partial pressures.
Discussion
Volatile exsolution in ascending magmas follows complex patterns inherited from the initial conditions under which decompression started. Our results show that both solubility laws and chemical reactions occurring in the gas phase have a first-order effect on volatile exsolution. We found that temperature, initial pressure, and melt iron content alter the amplitude of the chemical changes during ascent, but do not change the general degassing patterns.
These patterns are controlled by the amount of gas, the amount of water in the melt (and thus f H2O), and two other degrees of freedom. Because of the way the various chemical parameters are correlated in our model at fixed pressure, one of these degrees of freedom is either of redox state, f H, or H S/SO , whereas the other
degree is either of f CO2 or C/S. It is known that the H-O-S system also display changes in the redox state of the magma during ascent (Burgisser & Scaillet, 2007). When C/S<1, the H-O-S-C system reacts in a similar way to that of the H-O-S system. This is consistent with f CO2 acting as an independent variable. Note that another set of seven independent, initial variables could have been chosen to initialize the model. Not singling out the total content of each species (e.g., H2O and CO2, Table 3) has the advantage to enable the use of the total amount of initial gas as a free, independent parameter, which is a pertinent choice when addressing the behavior of natural systems. 404 405 406 407 408 409 410 411 412 413 414 415 416 417 418 419 420 421 422 423 424 425 426 427 428
The role of initial water content can be understood by looking at simpler chemical systems. The end-member of the water-rich systems studied herein is the O-H system, which bears only H2O, H2, and O2. Burgisser & Scaillet (2007) showed that this system oxidizes greatly upon decompression, and that, as sulfur is added into the magma at the expense of water, the melt becomes depleted in water and the resulting S-O-H system reduces upon decompression. These findings seem to be also true in the C-S-O-H system, because at equal initial gas content, water-poor systems almost always follow more reduced trends than water-rich ones (Figs 2A and 3A).
It is possible to reduce somewhat the complexity of degassing patterns by considering the role of initial gas content. Gas-rich systems are essentially showing what happens to an isolated gas pocket during isothermal decompression. Following Symonds et al. (1994), one could thus expect that in gas-rich systems, the chemical balance of the gas dictates a general reduction during decompression with an associated drop in H2S/SO2 and does not affect the C/S ratio. This is always true for the reducing trend and C/S. The H2S/SO2 evolution, however, is not entirely dominated by the initial gas content, as it also depends on the initial redox state, C/S
429 430 431 432 433 434 435 436 437 438 439 440 441 442 443 444 445 446 447 448 449 450 451 452 453
and H2O content (Fig. 3B). Gas-poor systems are chiefly dominated by solubility laws. All four degrees of freedom exert considerable control under gas-poor conditions. In particular, the presence of dissolved sulfur buffers the magnitude of redox changes and drives systems towards NNO, whereas dissolved carbon draws systems away from it. The schematic influence of these four degrees of freedom on the redox patterns of decompressing rhyolites are summarized in Fig. 11.
Based on our model outputs, what traces of this complex degassing process can we hope to measure in natural rocks? The limiting factor in that regard is the minimum volatile content that can be measured in the natural glass. The most common analytical technique, electron microprobe, can typically measure S contents larger than 50 to 100 ppm. Lower detection limits of 1 to 10 ppm are achieved with more recent techniques such as Secondary Ion Mass Spectroscopy (SIMS; Hauri et al., 2002), or Fourier Transform InfraRed (FTIR; Stopler and Holloway, 1988). Inspection of typical evolution of total S and CO2 dissolved in melt during decompression shows that volatiles drop below microprobe detection limit soon after leaving the reservoir (Fig. 12). Only the most sensitive techniques such as SIMS could possibly detect degassing trends occurring in the conduit, between the reservoir and 100 bars. Volatiles remaining at shallow levels, within the dome, are often below 100 ppb.
Measurements of volcanic gases at active volcanoes use various techniques to acquire different gas species, making inter-comparisons challenging (Aiuppa et al., 2004, 2007). In particular, difficulties in converting between total sulfur and SO2 measures strongly impede our ability to efficiently combine measuring techniques. CO2 fluxes, for example, are generally deduced by combining SO2 flux measures from the plume and independent, instant measures of sulfur and carbon species at the
454 455 456 457 458 459 460 461 462 463 464 465 466 467 468 469 470 471 472 473 474 475 476 477
vent (e.g., Fischer et al., 1996; Wardell et al., 2001; Goff et al., 2001). Too often, however, punctual analyses give C/S ratio instead of CO2/SO2 ratio. This introduces large uncertainties into the flux calculation because other sulfur species such as H2S affect total sulfur content, invalidating S as a reliable proxy for SO2 (Aiuppa et al., 2005). Thus, much can be learned on C/S to CO2/SO2 conversions by comparing ratios from our model runs.
Our model outputs at atmospheric pressure do not represent gas composition emitted at vent but the gas composition at equilibrium with a magma decompressed in closed system. In other words, natural gases have been physically separated from the magma they issued, but not in our degassing model. Keeping this distinction in mind, we compared our calculated CO2/SO2 and C/S ratios at atmospheric pressure (Fig. 13). Differences between these two ratios are largest for gas-rich systems: CO2/SO2 is one to three orders of magnitude higher than C/S. This is readily explained by the fact that these runs have the largest amounts of H2S in the gas phase (Fig. 4B). When little H2S is present, like in gas-poor, water-rich systems (Fig. 3B), the difference is less than a factor two. This suggests that obtaining CO2 fluxes from SO2 flux measurements at volcanoes where only the C/S ratio is available can largely underestimate the CO2 output if the reservoir contains a large amount of gas. Our runs show that CO2/SO2 changes during decompression are not restricted to pressures >1000 bars like in the case of C/S, but occur down to atmospheric pressure. The content of SO2 being strongly related to redox state, we observe the same partitioning between gas content in the reservoir and initial melt water content than in the case of redox evolution (Figs 3-4). Thus, CO2/SO2 is much more prone to be affected by shallow degassing processes than C/S.
478 479 480 481 482 483 484 485 486 487 488 489 490 491 492 493 494 495 496 497 498 499 500 501 502
Volatile chemistry can greatly affect the way magma flows at shallow levels. Under certain circumstances, we showed that exsolution can happen suddenly, causing a brutal acceleration of the magma. It is important to understand how likely such circumstances are because of the implications of such behavior on the explosive potential of domes. First, a porosity lower than that at equilibrium is required. The presence of low porosity at shallow level is not unreasonable in regions where bubble collapse and permeability phenomenon have been shown to occur (e.g., Eichelberger et al., 1986). Second, the magma must be water poor. It is possible to deplete magma in H2O by flushing the system with CO2- and SO2-rich gases. Syn-eruptive occurrence of CO2-rich volatiles issued from deep mafic recharges is likely to occur at many arc volcanoes (Wallace, 2005). Such gas- and water-poor conditions are not restricted to but can be believably achieved during a dome-forming eruption if the deep volatiles percolate through the volcanic conduit and flush the slowly growing dome. Such leaching has been proposed to occur at Popocatepetl lava dome, although in this case the source of CO2 remains unclear (Goff et al., 2001; Witter et al., 2005), and at Soufrière Hills volcano, Montserrat (Edmonds et al., 2003), where a percolating flux SO2 as been assigned to a deep source. Our model does not simulate crystallization, so the preferred scenario is a dome rapidly resuming its growth after a short repose period, such as has been the case at Soufrière Hills throughout its on-going eruption (Watts et al., 2002).
Our simulations indicate that further upward motion of the leached magma is highly nonlinear. Model outputs show that the dome growth becomes highly unstable, possibly leading to a violent exsolution event if the bubble-poor magma resuming ascent flows past a critical pressure threshold. Another direct implication is that the threshold, when present, may delimit which part of the magma column will be ejected
503 504 505 506 507 508 509 510 511 512 513 514 515 516 517 518 519 520 521 522 523 524 525 526
during a sudden decompression, such as caused by dome collapse or accompanying a Vulcanian explosion.
Conclusions
We presented a coupled chemical-physical model of magma ascent based on nine volatile species part of S-O-H-C-Fe-bearing rhyolitic melts. We conducted a parametric study of degassing by varying the initial conditions at depth within the range typical of arc magmas and characterizing the chemical and physical evolution of rhyolitic melts during their ascent to the surface. This parametric study reduced somewhat the complex and rich patterns of chemical evolution during ascent, as some elements and variables have a restricted influence on the degassing process.
Initial values of four main parameters control the degassing patterns of volatile-bearing rhyolites: ∆NNO, gas amount, melt water content and melt sulfur content. Because of the way the various chemical parameters are correlated at fixed pressure and temperature, the melt water content is directly related to f H2O, the redox state is related to f H2 and gaseous H2S/SO2, and the relative sulfur content is related to f CO2 and gaseous C/S.
Gas content exerts a strong control over the resulting degassing trends. A large amount of gas imposes a reducing trend by minimizing the role of dissolved volatiles. Melt H2O, S, and CO2 contents exert a weaker and more subtle control. At equal initial gas content, water-poor systems almost always follow more reduced trends than water-rich ones. On the other hand, S-rich systems tend to evolve towards the NNO buffer, whereas S-poor systems tend to be drawn away from it. The initial redox state exerts a variable control: the furthest away from the NNO buffer the rhyolite initially is, the more the trend resulting from the other controls is heavily felt. Temperature,
527 528 529 530 531 532 533 534 535 536 537 538 539 540
initial pressure, and melt iron content alter the amplitude of the chemical fluctuations during ascent, but do not change the general degassing patterns.
Volatile chemistry has little effect on the amount of degassing during closed-system, equilibrium degassing from a deep reservoir. The evolution of porosity at shallow levels, however, can be greatly affected by degassing chemistry. It requires that the magma starts with a porosity lower than that at equilibrium and that it is strongly depleted in water compared to the other species (e.g., CO2 and SO2). Further upward motion of such shallow-seated magma is subject to sudden, massive degassing when the magma flows past a critical pressure threshold. This scenario best applies to domes resuming rapidly their growth after a short repose period.
Acknowledgments
This study was partly supported by the French Program ANR-EXPLANT (contract No ANR-05-CATT-003 to C. Martel). We thank the in-depth reviews of R. Moretti and an anonymous reviewer, which improved the manuscript.
References
Aiuppa, A., Burton, M., Murè, F., and Inguaggiato, S. (2004) Intercomparison of volcanic gas monitoring methodologies performed on Vulcano Island, Italy, Geophysical Research Letters, v.31,L02610.
Aiuppa, A., Inguaggiato, S., McGonigle, A.J.S., O'Dwyer, M., Oppenheimer, C., Padgett, M.J., Rouwet, D., and Valenza, M. (2005) H2S fluxes from Mt. Etna, Stromboli, and Vulcano (Italy) and implications for the sulfur budget at volcanoes, Geochimica et Cosmochimica Acta, v.69, p.1861-1871.
Aiuppa A., Moretti R., Federico C., Giudice G., Guerrieri S., Liuzzo M., Shinohara. H. (2007) Forecasting Etna eruptions by real-time observation of volcanic gas composition,
Geology, v.35, p.1115-1118
Blank, J.G., Stopler, E.M., and Carroll, M.R. (1993) Solubilities of carbon dioxide and water in rhyolitic melt at 850 °C and 750 bars, Earth and Planetary Science Letters, v.119, p.27-36.
Burgisser, A., and Scaillet, B. (2007) Redox evolution of a degassing magma rising to the surface, Nature, v.445, p.194-197.
Clemente, B., Scaillet, B. & Pichavant, M. (2004) The solubility of sulphur in hydrous rhyolitic melts. J. Petrol. 45, 2171-2196.
Delmelle, P., and Stix, J. (2000) Volcanic gases, in: Sigurdsson, H. (ed) Encyclopedia of volcanoes, Academic Press, p.803-815.
Dufek, J., and Bergantz, G.W. (2005) Transient two-dimensional dynamics in the upper conduit of a rhyolitic eruption: A comparison of closure models for the granular stress, Journal of Volcanology and Geothermal Research, v.143, p.113-132.
Edmonds, M., Oppenheimer, C., Pyle, D.M., Herd, R.A., and Thompson, G. (2003) SO2 emissions from Soufrière Hills Volcano and their relationship to conduit permeability, hydrothermal interaction and degassing regime, Journal of Volcanology and Geothermal Research, v.124, p.23-43.
Eichelberger, J.C., Carrigan, C.R., Westrich, H.R., and Price, R.H. (1986) Non-explosive silicic volcanism, Nature, v.323, p.598-602.
Fischer, T.P., Arehart, G.B., Sturchio, N.C., and Williams, S.N. (1996) The relationship between fumarole gas composition and eruptive activity at Galeras Volcano, Colombia, Geology, v.24, p.531-534.
Gaillard, F., Pichavant, M., and Scaillet, B. (2003a) Experimental determination of activities of FeO and Fe2O3 components in hydrous silicic melts under oxidizing conditions, Geochim Cosmochim. Acta, v. 67, p.2427-2441.
Gaillard, F., Schmidt, B. Mackwell, S. and McCammon, C. (2003b) Rate of hydrogen–iron redox exchange in silicate melts and glasses. Geochim Cosmochim. Acta, v. 67, 2427-2441.
Gardner, J.E., Hilton, M., and Carroll, M.R. (1999) Experimental constraints on degassing of magma: Isothermal bubble growth during continuous decompression from high pressure, Earth and Planetary Science Letters, v.168, p.201-218.
Ghiorso, M.S., and Sack, R.O. (1995) Chemical mass transfer in magmatic processes. iv. a revised and internally consistent thermodynamic model for the interpolation and extrapolation of liquid-solid equilibria in magmatic systems at elevated temperatures and pressures, Contributions to Mineralogy and Petrology, 119, 197-212
Goff, F., Love, S.P., Warren, R.G., Counce, D., Obenholzner, J., Siebe, C., and Schmidt, S.C. (2001) Passive infrared remote sensing evidence for large, intermittent CO2 emissions at Popocatepetl volcano, Mexico, Chemical Geology, v.177, p.133-156.
Hauri, E., Wang, J., Dixon, J.E., King, P.L., Mandeville, C., and Newman, S. (2002) SIMS analysis of volatiles in silicate glasses 1. Calibration, matrix effects and comparisons with FTIR, Chemical Geology, v.183, p.99-114.
Holland T., & Powell, R. (1991) A Compensated-Redlich-Kwong (CORK) equation for volumes and fugacities of CO2 and H20 in the range 1 bar to 50 kbar and 100-1600°C, Contributions to Mineralogy and Petrology v.109, p.265-273.
Holtz, F., Behrens, H., Dingwell, D.B. & Johannes, W. H2O solubility in haplogranitic melts: compositional, pressure and temperature dependence. Am. Mineral. 80, 94-108 (1995). Kress, V.C., and Carmichael, I.S.E. (1991) The compressibility of silicate liquids containing
Fe2O3 and the effect of composition, temperature, oxygen fugacity and pressure on their redox states, Contributions to Mineralogy and Petrology, v.108, p. 82-92.
Mangan, M., and Sisson, T. (2000) Delayed, disequilibrium degassing in rhyolite magma: decompression experiments and implications for explosive volcanism, Earth and Planetary Science Letters, v.183, p.441-455.
Moretti, R. (2005) Polymerisation, basicity, oxidation state and their role in ionic modelling of silicate melts, Annals of Geophysics, v.48, p.583-608.
Moretti, R., and Papale, P. (2004) On the oxidation state and volatile behavior in multicomponent gas-melt equilibria, Chemical Geology, v.213, p.265-280.
Moretti, R., and Ottonello, G. (2005) Solubility and speciation of sulfur in silicate melts: The Conjugated Toop-Samis-Flood-Grjotheim (CTSFG) model, Geochimica et Cosmochimica Acta, v.69, p.801-823.
Moretti, R., Papale, P., and Ottonello, G. (2003) A model for the saturation of C-O-H-S fluids in silicate melts, in: Oppenheimer, C, Pyle, D.M., Barclay, J. (eds) Volcanic degassing, Geological Society Special Publication 213, London, p.81-101.
Newman, S., and Lowenstern, J.B. (2002) VolatileCalc: a silicate melt-H2O-CO2 solution model written in Visual Basic for Excel, Computers & Geosciences, v.28, p.597-604. Ohmoto, H., and Kerrick, D.M. (1977) Devolatilisation equilibria in graphitic systems,
American Journal of Science, v.277, p. 1013-1044.
Ottonello, G., Moretti, R., Marini, L., and Vetuschi Zuccolini, M. (2001) Oxidation state of iron in silicate glasses and melts: a thermochemical model, Chemical Geology, v.174, p.157-159.
Papale, P. (1999) Modeling of the solubility of a two-component H2O+CO2 fluid in silicate liquids, American Mineralogist, v.84, p.477-492.
Papale, P. (2005) Determination of total H2O and CO2 budgets in evolving magmas from melt inclusion data, Journal of Geophysical Research, v.110, B03208.
Papale, P., and Polacci, M. (1999) Role of carbon dioxide in the dynamics of magma ascent in explosive eruptions, Bulletin of Volcanology, v.60, p.583-594.
Papale, P., Moretti, R., and Barbato, D. (2006) The compositional dependence of the saturation surface of H2O+CO2 fluids in silicate melts, Chemical Geology, v.229, p.78-95.
Scaillet, B., and Pichavant, M. (2003) Experimental constraints on volatile abundances in arc magmas and their implications for degassing processes, in: Oppenheimer, C, Pyle, D.M., Barclay, J. (eds) Volcanic degassing, Geological Society Special Publication 213, London, p.23-52.
Shaw, H.R., and Wones, D.R. (1964) Fugacity coefficients for hydrogen gas between 0° and 1000° C, for pressures to 3000 ATM, American Journal of Science, v. 262, p. 918-929. Shi, P.F. & Saxena, F.K. (1992) Thermodynamic modeling of the C-H-O-S fluid system.
Amer. Mineral. 77, 1038-1049.
Stopler, E., and Holloway, J.R. (1988) Experimental determination of the solubility of carbon dioxide in molten basalt at low pressure, Earth and Planetary Science Letters, v.87, p. 397-408.
Symonds, R.B., and Reed, M.H. (1993) Calculations of multicomponent chemical equilibria in gas-solid-liquid systems: calculation methods, thermochemical data, and applications to studies of high-temperature volcanic gases with example of Mount St. Helens, American Journal of Science, v.293, p.758-864.
Symonds, R.B., Rose, W.I., Bluth, G.J.S., and Gerlach, T.M. (1994) Volcanic-gas studies: methods, results, and applications, in: Carroll, M.R., and Holloway, J.R. (eds) Volatiles
Wallace, P.J. (2005) Volatiles in subduction zone magmas: concentrations and fluxes based on melt inclusions and volcanic gas data, Journal of Volcanology and Geothermal Research, v.140, p.217-240.
Watts, R.B., Herd, R.A., Sparks, R.S.J., and Young, S.R. (2002) Growth patterns and emplacement of the andesitic lava dome at Soufrière Hills volcano, Montserrat, in: Druitt, T.H. and Kokelaar, B.P. (eds) The eruption of Soufriere Hills Volcano, Montserrat, from 1995 to 1999, Geological Society, London, Memoirs, v. 21, p.115-152. Wardell, L.J., Kyle, P.R., Dunbar, N., and Christenson, B. (2001) White Island volcano, New
Zealand: carbon dioxide and sulfur dioxide emission rates and melt inclusion studies, Chemical Geology, v.177, p.187-200.
Witter, J.B., Kress, V.C., and Newhall, C.G. (2005) Volcan Popocatepetl, Mexico. Petrology, magma mixing, and immediate sources of volatiles for the 1994-present eruption, Journal of Petrology, v.46, p.2337-2366.
Young, S.R., Voight, B., and Duffell, H.J. (2003) Magma extrusion dynamics revealed by high-frequency gas monitoring at Soufrière Hills volcano, Montserrat, in: Oppenheimer, C, Pyle, D.M., Barclay, J. (eds) Volcanic degassing, Geological Society Special Publication 213, London, p.219-230.
Table 1: Solubility constants used in the degassing model. Temperatures are in °C.
The ai and bi parameters were determined by fitting experimental solubility data of corresponding species to an empirical equation of the form wi = ai fi bi. We have used data from Clemente et al. (2004) for sulfur bearing species in hydrous rhyolites, Holtz et al. (1992, 1995) for H2O, Fogel and Rutherford (1990) and Blank et al. (1993) for CO2, and Gaillard et al. (2003b) for H2 (see Table 2 for experimental ranges).
species ai bi H2O -4.69 10-6 T + 4.81445 10-3 7.2827 10-4 T - 4.276384 10-2 H2 3.400 10-7 1.2800 SO2 1.632 10-10 1.3789 H2S 9.1668 10-9 T + 4.204306 10-7 5.347 10-4T + 8.67136 10-2 CO2 1.046 10-9 T - 4.5124 10-7 -6.738 10-4T + 1.628 CO 0 -CH4 0 -O2 0 -S2 0 -
Table 2: Parameter ranges. The five first columns show ranges of experimental
parameters used to calibrate the chemical model. The last column indicates the range of initial conditions derived from data on natural arc magmas that we used in the parametric study.
Parameter H2Sa SO2a H2Ob CO2c H2d Natural rangee
∆NNO -2.26 – 0 1 – 2.91 >0 ~1 n.a. -0.5 – 1.7
C/S in gas n.a. n.a. n.a. n.a. n.a. 0.3 – 300
P (bar) 2000 2000 500 – 3000 500 – 2500 220 – 265 1000 – 3000
fi (bars) 1 – 5000 10-3 – 8000 500 – 3000 45 – 5000 0.02 – 70 n.a. T (°C) 800 – 1000 800 – 1000 800 – 900 850 – 1050 700 – 1000 725 – 925 FeO* (wt%) 0.05 – 2.11 0.07 – 3.26 0-0.61 0.38 – 1 0.08 – 1.6 0 – 3 H2Omelt (wt%) 1.92 –6.78 1.78 – 6.74 2 – 6 0.51-3.34 n.a. 4.43 – 5.41
n.a.: not applicable.
aClemente et al. (2004); bHoltz et al. (1992, 1995); cFogel and Rutherford (1990) and
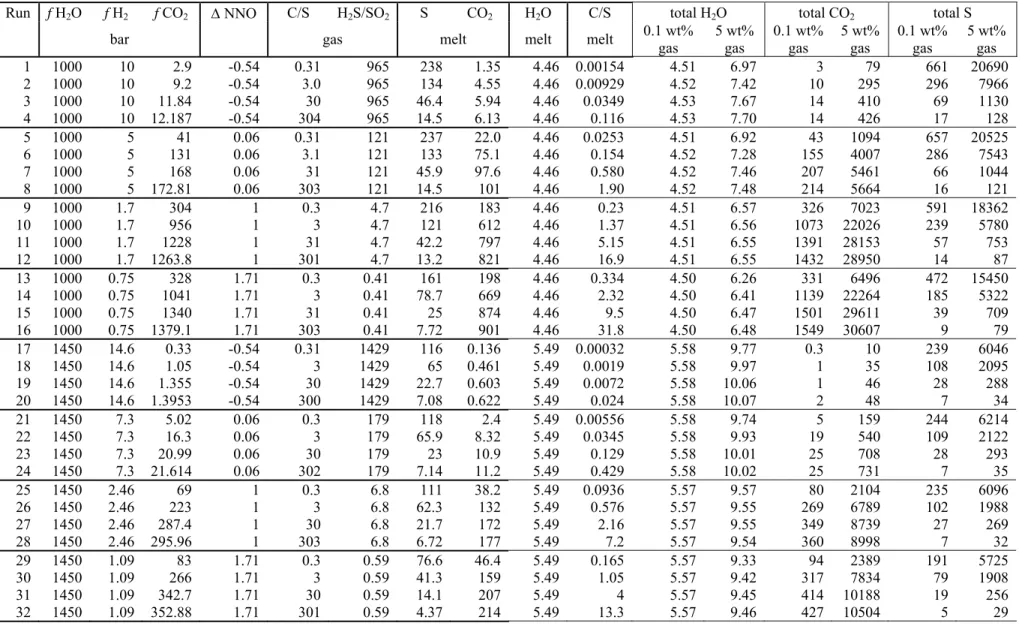
Table 3. Initial conditions for the parametric study. All runs start with a rhyolite at 2000 bars and 825 °C with 1 wt% FeO*. Only f H2O, f H2, and f CO2 are set, the other variables in the table are calculated by the chemical model. Each run was carried out with 0.1 and 5 wt% initial gas, and ratios are given in molar fraction. Dissolved water contents are in wt% and other dissolved species are in ppm.
Run f H2O f H2 f CO2 ∆ NNO C/S H2S/SO2 S CO2 H2O C/S total H2O total CO2 total S
bar gas melt melt melt 0.1 wt% gas 5 wt% gas 0.1 wt% gas 5 wt% gas 0.1 wt% gas 5 wt% gas 1 1000 10 2.9 -0.54 0.31 965 238 1.35 4.46 0.00154 4.51 6.97 3 79 661 20690 2 1000 10 9.2 -0.54 3.0 965 134 4.55 4.46 0.00929 4.52 7.42 10 295 296 7966 3 1000 10 11.84 -0.54 30 965 46.4 5.94 4.46 0.0349 4.53 7.67 14 410 69 1130 4 1000 10 12.187 -0.54 304 965 14.5 6.13 4.46 0.116 4.53 7.70 14 426 17 128 5 1000 5 41 0.06 0.31 121 237 22.0 4.46 0.0253 4.51 6.92 43 1094 657 20525 6 1000 5 131 0.06 3.1 121 133 75.1 4.46 0.154 4.52 7.28 155 4007 286 7543 7 1000 5 168 0.06 31 121 45.9 97.6 4.46 0.580 4.52 7.46 207 5461 66 1044 8 1000 5 172.81 0.06 303 121 14.5 101 4.46 1.90 4.52 7.48 214 5664 16 121 9 1000 1.7 304 1 0.3 4.7 216 183 4.46 0.23 4.51 6.57 326 7023 591 18362 10 1000 1.7 956 1 3 4.7 121 612 4.46 1.37 4.51 6.56 1073 22026 239 5780 11 1000 1.7 1228 1 31 4.7 42.2 797 4.46 5.15 4.51 6.55 1391 28153 57 753 12 1000 1.7 1263.8 1 301 4.7 13.2 821 4.46 16.9 4.51 6.55 1432 28950 14 87 13 1000 0.75 328 1.71 0.3 0.41 161 198 4.46 0.334 4.50 6.26 331 6496 472 15450 14 1000 0.75 1041 1.71 3 0.41 78.7 669 4.46 2.32 4.50 6.41 1139 22264 185 5322 15 1000 0.75 1340 1.71 31 0.41 25 874 4.46 9.5 4.50 6.47 1501 29611 39 709 16 1000 0.75 1379.1 1.71 303 0.41 7.72 901 4.46 31.8 4.50 6.48 1549 30607 9 79 17 1450 14.6 0.33 -0.54 0.31 1429 116 0.136 5.49 0.00032 5.58 9.77 0.3 10 239 6046 18 1450 14.6 1.05 -0.54 3 1429 65 0.461 5.49 0.0019 5.58 9.97 1 35 108 2095 19 1450 14.6 1.355 -0.54 30 1429 22.7 0.603 5.49 0.0072 5.58 10.06 1 46 28 288 20 1450 14.6 1.3953 -0.54 300 1429 7.08 0.622 5.49 0.024 5.58 10.07 2 48 7 34 21 1450 7.3 5.02 0.06 0.3 179 118 2.4 5.49 0.00556 5.58 9.74 5 159 244 6214 22 1450 7.3 16.3 0.06 3 179 65.9 8.32 5.49 0.0345 5.58 9.93 19 540 109 2122 23 1450 7.3 20.99 0.06 30 179 23 10.9 5.49 0.129 5.58 10.01 25 708 28 293 24 1450 7.3 21.614 0.06 302 179 7.14 11.2 5.49 0.429 5.58 10.02 25 731 7 35 25 1450 2.46 69 1 0.3 6.8 111 38.2 5.49 0.0936 5.57 9.57 80 2104 235 6096 26 1450 2.46 223 1 3 6.8 62.3 132 5.49 0.576 5.57 9.55 269 6789 102 1988 27 1450 2.46 287.4 1 30 6.8 21.7 172 5.49 2.16 5.57 9.55 349 8739 27 269 28 1450 2.46 295.96 1 303 6.8 6.72 177 5.49 7.2 5.57 9.54 360 8998 7 32 29 1450 1.09 83 1.71 0.3 0.59 76.6 46.4 5.49 0.165 5.57 9.33 94 2389 191 5725 30 1450 1.09 266 1.71 3 0.59 41.3 159 5.49 1.05 5.57 9.42 317 7834 79 1908 31 1450 1.09 342.7 1.71 30 0.59 14.1 207 5.49 4 5.57 9.45 414 10188 19 256 32 1450 1.09 352.88 1.71 301 0.59 4.37 214 5.49 13.3 5.57 9.46 427 10504 5 29
Figure caption
Figure 1: Measured vs. calculated volatile melt concentration. Data sources and
solubility laws are listed in Table 1. Concentrations have been normalized to 1300 ppm, 6 wt%, 1200 ppm, and 800 ppm for CO2, H2O H2S, and SO2, respectively. Hydrogen was not included, as melt concentrations reported by Gaillard et al. (2003b) do not correspond to actual measurements.
Figure 2: Gas composition of a typical decompression run with a rhyolitic melt
starting at ∆NNO +1 with 0.1 wt% gas in the reservoir, 121 ppm S and 612 ppm CO2 in the melt. Note that O2 is not shown owing to its minute content. With a total pressure of 2000 bar in the reservoir, these volatile contents correspond to initial fugacities of 1000, 1.7, and 956 bars for H2O, H2, and CO2, respectively (run 10, Table 3). These conditions are close to those at Mt. St. Helens during the 1980 eruptions.
Figure 3: Evolution of redox state (A) and the H2S/SO2 ratio of the gas phase (B) of a
decompressing rhyolite starting from a gas-poor (0.1 wt%) reservoir. Runs start with either water-poor (black lines) or water-rich (gray areas) rhyolites.
Figure 4: Evolution of redox state (A) and the H2S/SO2 ratio of the gas phase (B) of a
decompressing rhyolite starting from a gas-rich (5 wt%) reservoir. Runs start with either water-poor (black lines) or water-rich (gray areas) rhyolites.
Figure 5: Evolution of the C/S ratio of the gas phase decompressing in equilibrium
with a rhyolitic melt. Runs start from a gas-poor reservoir with either water-poor (black lines) or water-rich (gray areas) rhyolites.
Figure 6: Variations in redox pattern of a decompressing rhyolitic melt as a function
of FeO* content. Runs start from a gas-poor reservoir with a C/S ratio of 0.3 (FeO* = 1 wt% is run 13, Table 3).
Figure 7: Variations in redox pattern (A) and C/S ratio of the gas phase (B) of a
decompressing rhyolitic melt as a function of temperature. The fugacities of H2O, H2 and CO2 were adjusted so that H2Omelt, ∆NNO, and C/Sgas match those of the reference run (run 10, Table 3).
Figure 8: Evolution of gas volume fraction of a decompressing rhyolitic melt as a
function of total pressure.
Figure 9: Effects of initial gas composition on a decompression from shallow level.
Evolution of gas composition (A) and gas volume fraction (B) with pressure. The reference run (thick line, f H2O = 350 bars) starts with an equilibrium composition close to run 11 at 400 bars (Table 3). The three other runs have an initial gas composition progressively richer in CO2. The gray vertical lines indicate the respective initial f H2O of each run. These lines also correspond to a pressure threshold below which magma massively degasses.
Figure 10: Evolution of melt water content (A) and CO2 exsolution rate (B) during a
decompression from shallow level. The gray vertical lines indicate the respective initial f H2O of each run, which are the same as in Figure 9.
Figure 11: Schematic influences of the four main controls (∆NNO, gas, melt water
content and melt sulfur content) of degassing patterns of volatile-bearing rhyolites. Relative initial values of these controls each influence the redox evolution during decompression in the direction shown by the arrows (circle = buffering effect). The control can be strong (heavy arrows for gas content), modest (light arrows for sulfur content), or variable (for ∆NNO, the furthest away from the NNO buffer the rhyolite is, the more the trend resulting from the other controls is heavily felt).
Figure 12: Evolution of S and CO2 dissolved in a rhyolitic melt during degassing of gas-rich, water-poor systems. The fields cover S and CO2 melt content for the whole range of initial redox conditions (from NNO-0.5 in stippled lines to NNO+1.7 in solid lines). The S field corresponds to C-poor, S-rich runs (1, 5, 9, and 13; Table 3) and the CO2 field corresponds to C-rich, S-poor runs (4, 8, 12, and 16), thus maximizing the respective content of each component. Detection limits of common analytical methods and typical pressure ranges encountered in domes and volcanic conduits are also shown.
Figure 13: Ratios of C/S and CO2/SO2 in the gas phase at atmospheric pressure for all
runs of the parametric study. Runs have been classified along the y-axis by quantity of gas at depth and initial melt water content. The initial oxidation state is shown as a gradient for C/S (lightest is most reduced at NNO-0.5) and as an arrow for CO2/SO2 (arrow points towards most reduced).
Figure 1
0
0.2
0.4
0.6
0.8
1
0
0.2
0.4
0.6
0.8
1
CO
2H
2S
H
2O
Measured melt volatile content
SO
2Pre
d
ict
e
d
me
lt
vo
la
ti
le
co
n
te
n
t
1000 100 10 1 H2O H2S SO2 H2 S2 CO CO2 CH4 Pre ssu re (b a r) 10-6 10-4 10-2 1
Molar fraction in gas
0 1.2
∆NNO