Detecting self-ion irradiation-induced void swelling
in pure copper using transient grating spectroscopy
The MIT Faculty has made this article openly available.
Please share
how this access benefits you. Your story matters.
Citation
Dennett, C. A. et al. "Detecting self-ion irradiation-induced void
swelling in pure copper using transient grating spectroscopy." Acta
Materialia 145 (February 2018): 496-503 © 2017 Acta Materialia Inc
As Published
http://dx.doi.org/10.1016/j.actamat.2017.12.007
Publisher
Elsevier BV
Version
Original manuscript
Citable link
https://hdl.handle.net/1721.1/123978
UNCORRECTED
PROOF
Acta Materialia xxx (2017) xxx-xxxContents lists available at ScienceDirect
Acta Materialia
journal homepage: www.elsevier.comFull length article
Detecting self-ion irradiation-induced void swelling in pure copper using transient
grating spectroscopy
C.A. Dennett
a,∗, K.P. So
a, A. Kushima
a, b, D.L. Buller
c, K. Hattar
c, M.P. Short
a,∗∗aDepartment of Nuclear Science and Engineering, Massachusetts Institute of Technology, Cambridge, MA 02139, USA
bDepartment of Materials Science and Engineering, Advanced Materials Processing and Analysis Center, University of Central Florida, Orlando, FL 32816, USA cDepartment of Radiation–Solid Interactions, Sandia National Laboratories, Albuquerque, NM 87185, USA
A R T I C L E I N F O
Article history:
Received 1 August 2017
Received in revised form 30 November 2017 Accepted 12 December 2017
Available online xxx
Keywords:
Void swelling
Transient grating spectroscopy Irradiation
Surface acoustic wave Ion beam
A B S T R A C T
Irradiation-induced void swelling remains a major challenge to nuclear reactor operation. Swelling may take years to initiate and often results in rapid material property degradation once started. Alloy development for advanced nuclear systems will require rapid characterization of the swelling breakaway dose in new alloys, yet this capability does not yet exist. We demonstrate that transient grating spectroscopy (TGS) can detect void swelling in single crystal copper via changes in surface acoustic wave (SAW) velocity. Scanning transmis-sion electron microscopy (STEM) links the TGS-observed changes with void swelling-induced microstruc-tural changes. These results are considered in the context of previous work to suggest that in situ TGS will be able to rapidly determine when new bulk material begins void swelling, shortening alloy development and testing times.
© 2017.
1. Introduction
Since its discovery [1], the phenomenon of irradiation-induced void swelling has created numerous problems for both light water re-actor (LWR) [2–5] and fast rere-actor [6–8] operation due to sudden degradation of material properties. Void swelling often requires an in-cubation period to initiate; materials can spend months or years in re-actor operation in a transient regime experiencing little to no swelling before breaking away into rapid steady-state swelling [9]. When de-signing materials for advanced nuclear systems, it is imperative to be able to both predict this “breakaway dose” to steady-state swelling and develop alloys whose breakaway dose is higher and higher.
However, void swelling is an inherently multiscale phenomenon [10], whose origins span orders of magnitude in length and time [9]. Analytical and computational predictive abilities are rare and ad-vanced codes capable of predicting reactor-relevant conditions have been documented only recently [11–13]. The strong dependencies of breakaway dose on irradiation temperature [14], dose rate [15], he-lium production or inert gas presence [16,17], prior cold work [18], and minor alloying elements [19] make it very difficult to predict this transition point in new, otherwise fully characterized alloys. Experi
∗Corresponding author. ∗∗Corresponding author.
Email addresses: [email protected] (C.A. Dennett); [email protected] (M.P.
Short)
mental campaigns to determine this breakaway dose for advanced al-loys all require considerable time to irradiate each specimen to one dose at one set of conditions [20,21]. Time-consuming transmission electron microscopy (TEM) analysis is required to confirm the pres-ence and distribution of these voids.
If a method to detect the onset of void swelling in situ, during ir-radiation were to exist, the time to qualify the swelling resistance of new alloys could be reduced from years to months or even weeks. Recent advances have been made in in situ TEM [22] and the abil-ity to watch void nucleation in real time has been demonstrated un-der electron irradiation [23]. Post-irradiation, traditional contact ultra-sonics [24] and advanced non-linear ultrasound techniques [25] have also been used to detect void swelling and other types of radiation-in-duced microstructure evolution in neutron-irradiated materials as well. Broadband laser-based resonant ultrasonics have been used to study
in situ changes in microstructure during the recrystallization of
cop-per, but have not been applied in situ during radiation exposure [26]. Other techniques, including Raman spectroscopy [27] and Rutherford backscattering spectroscopy (RBS) [28] have recently become avail-able as in situ tools during ion irradiation. However, a mesoscale tech-nique to detect the onset of void swelling during exposure does not yet exist, leaving a gap between nanoscale in situ studies and engineering scale post-irradiated examination.
In this study, we demonstrate that transient grating spectroscopy (TGS), a non-contact, non-destructive photoacoustic technique, is able to measure the effect of void swelling through changes in elastic properties in pure, single crystal copper. TGS has previously been used to study low-dose effects of ion irradiation in tungsten [29–31],
https://doi.org/10.1016/j.actamat.2017.12.007 1359-6454/© 2017.
UNCORRECTED
PROOF
2 Acta Materialia xxx (2017) xxx-xxx
but has yet to be used in the study of materials with large, radiation-in-duced defect clusters. In the high-dose study presented here, both the elastic constants and the anisotropy of single crystal copper are found to change as a function of dose. Single crystal copper is chosen for this investigation as it has been shown to readily undergo void swelling under high-temperature self-ion irradiation [32]. Low-dose defect sat-uration [33] is observed to stiffen the elastic response due to dislo-cation segment pinning [34–36], while at high doses the density and elastic moduli are reduced due to void swelling [37]. Although the ability of TGS to detect void swelling is demonstrated here in the simplest possible case, a pure metallic single crystal, other work us-ing similar acoustic techniques on polycrystalline materials [29,30,38] and iron-based alloys [39] provides confidence that the methodology applied here is readily extendable to more complex materials. The ability of TGS to identify the onset of void swelling in situ, during ion irradiation, is proposed based on these results as a way to rapidly screen new materials for resistance to void swelling.
2. Experimental methods
Specimens of {111} oriented single crystal Cu exposed for this study were purchased from the MTI Corporation. These samples are >99.999% pure, mechanically polished to <3 nm surface roughness, and have surface orientations within 2° of the given index. The para-meters used for the ion beam irradiations were chosen with the goal of inducing volumetric void swelling. Prior neutron irradiation work on pure copper indicates that at the higher dose rates achieved with self-ion irradiation, significant void swelling should occur at T = 400?
C (or T/Tmelt= 0.5) [40]. TGS relies on a fixed-wavelength surface ex-citation, only a finite depth into the material will be probed. This pen-etration depth scales with the wavelength of the imposed excitation, which can be selected in the range of single to tens of microns. Us-ing SRIM calculations to determine ion penetration depths [41], an incident self-ion energy of 35 MeV is chosen to match the TGS test wavelength of 4.8 μm. At this energy, the material should be damaged only throughout the TGS analysis region, leaving little un-damaged material to convolve the measured response, as shown in Fig. 3 (a).
Since the damage profiles will be non-uniform under ion irradia-tion, the dose received by each sample is identified by the number of displacements per atom (dpa) at the damage peak (located approxi-mately 4.25 μm from the surface at this energy). Damage calculations were carried out in SRIM in the quick Kinchin-Pease mode [42] with a displacement energy of 30 eV [43] and total dose estimates are made assuming a uniform beam spot size of 0.19 cm2. The irradiation tem-perature during exposure is controlled by a resistive heating element and passive cooling and was stable to within 5 °C throughout each ex-posure. A list of the parameters used for these ion beam irradiations is given in Table 1. Based on SRIM calculations, the sample matrix includes peak doses up to 90 dpa. Although samples will be refer-enced in the text by their peak dose, the dose level at some interme-diate depth, say half the TGS test wavelength of 4.8 μm, may be a
Table 1
Parameters used for copper self-ion irradiation. In practice, the beam current does not remain constant throughout an exposure and ion source depletion was noted during this campaign.
Ion species
Ion
energy Temp. Spot size Beam current Peak doses (dpa) Total fluence ( ×1016ions/cm2) Cu6+ 35 MeV 400 °C 0.19 cm2 100–250 nA 5, 10, 30, 50, 90 0.352, 0.704, 2.11, 3.52, 6.32
more appropriate dose at which to correlate measured changes in me-chanical properties. These intermediate dose levels are listed in Table 2 and further comment on dose correlation is provided in the discus-sion. Table 2 also includes the average dose rate seen by each sample at the location of the damage peak.
Following exposure, samples are characterized ex situ using TGS, a pump-probe photoacoustic technique in which a periodic excitation in surface displacement and reflectivity with a fixed wavelength is in-duced on the surface of a material under investigation. This material excitation is generated by pulsing the surface with two crossed laser beams at a fixed angle, as seen in Fig. 1(a) of Ref. [44]. By monitor-ing the first order diffraction of a quasi-continuous wave probe laser from the excitation, the thermal decay of, and surface acoustic waves (SAWs) generated by, the material excitation can be monitored. Ther-mal decay profiles of this type can be used to determine the therTher-mal diffusivity of the material in question [29,45,46]. SAWs generated in this manner are monochromatic, in contrast to broadband excita-tions utilized by other ultrasonic techniques [26]. The speed of the in-duced SAW can be used to determine elastic mechanical properties [31] non-linearly averaged over the acoustic excitation depth, which is given approximately as the imposed excitation wavelength [47]. How-ever, to make this determination, some measure of the change in ma-terial density is necessary since the measured surface acoustic wave speed, cR, scales as
where E′is a directionally-dependent elastic constant and ρ is the
ma-terial density [47,48].
TGS experiments for this study are conducted using a dual hetero-dyne phase collection geometry and the same experimental parameters described in previous work [49]. The projected grating spacing is cali-brated for each measurement using a single crystal tungsten reference sample [44]. Each TGS measurement is taken as the average of 30000 laser shots. The excitation and probe spot sizes are 140 μm and 105 μm in diameter, respectively. Although TGS experiments return informa-tion about both thermal and elastic properties, the discussion here will be restricted to the elastic performance and the measured SAW speed used as the parameter of interest.
Following TGS measurements, TEM samples are lifted from the center of the ion-irradiated region using a focused ion beam (FEI He-lios Nanolab 6000) with a 30 keV Ga+ion milling process and a Pt
protection layer. Prepared TEM sample thicknesses range from 150 to 220 nm as measured using electron imaging following liftout. Mi-crostructural changes resultant from the ion beam exposure are im-aged using high angle annular dark field (HAADF) scanning trans-mission electron microscopy (STEM) with a beam energy of 200 keV (JEOL 2010F). STEM images are captured using a probe size of 0.2 nm and a camera length of 15 cm. HAADF imaging is chosen to
Table 2
Self-ion exposure levels for each sample. Stated dose rates are averaged over the length of each exposure.
Peak dose at 4.25 μm (dpa)
Intermediate dose at 2.4 μm (dpa)
Peak dose rate (
×10− 3dpa/s) Total fluence (×10 16 ions/cm2) 5.0 1.1 1.5 0.352 10 2.1 1.9 0.704 30 6.3 0.85 2.11 50 11 1.0 3.52 90 19 1.7 6.32 (1)
UNCORRECTED
PROOF
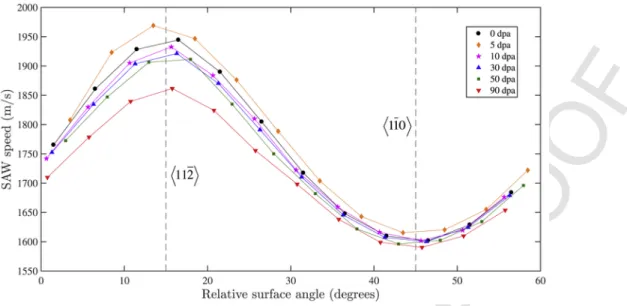
Fig. 1. Variation in SAW speed as a function of relative angle on the {111} single crystal surface for all exposure levels. The two primary surface directions, and , are indicated. The largest changes are observed along the direction. Error bars are not shown as they are approximately the size of the markers; the average error for a single measurement is 0.16% and the maximum of any point shown is 0.32%.best identify and quantify void size and density at the expense of view-ing smaller vacancy clusters such dislocation loops and stackview-ing fault tetrahedra (SFTs).
Calculations of the induced void swelling versus depth are con-ducted using image analysis on STEM micrographs using two meth-ods: simple areal void fraction and volumetric swelling. For both cal-culations, images are contrast adjusted and a binary threshold level manually set using ImageJ [50]. Area porosity is calculated by iden-tifying particles whose linear dimensions are both larger than a sin-gle pixel in 600 nm bins from the surface of the material to a depth of 6 μm. Areas thresholded to appear as voids with any single-pixel dimension are rejected as image artifacts from the counting process. Large voids, several hundreds of nanometers in diameter, are observed in the most highly irradiated specimens, necessitating the large bin width. The area of the analysis region varies from 16 to 34 μm2and
is chosen to be as large as possible for each image based on its qual-ity. To calculate volumetric swelling due to voids only, a spherical, isotropic approximation of the form
is used, where di= 2(Ai/π)1/2is the diameter of each of the identified voids where Aiis the area of each void identified by image analysis,
A is the image area being analyzed, δ is the thickness of the TEM
lamella, and the sum runs over all voids identified in the specified im-age area [51,52]. Although other authors have preferred to use the sec-ond method, we chose here to calculate the simple areal fraction as well due to the presence of large, faceted voids at high dose. The re-sults of these two methods are compared and found to give compara-ble results for the most highly-exposed samples.
All raw TGS data, raw and processed images, image analysis para-meters, SRIM calculations, and TGS processing scripts can be found on the GitHub repository for this work [53].
3. Results
The acoustic response of single crystal materials depends not only on the surface orientation of the crystal, but also the polarization of the SAW on the crystal surface [54]. For this reason, the acoustic response of both irradiated and unirradiated copper single crystals is character-ized using a series of measurements at different SAW polarizations on the surface. In practice, the orientation of the induced acoustic wave is fixed by the optical geometry used for the experiments. The polar-ization relative to the crystal surface is controlled by mounting the ex-posed samples on a manual rotation stage and rotating the sample face relative to the projected grating. As the {111} plane on face centered cubic crystals has six-fold symmetry, collecting data over an angular range of 60?is sufficient to completely capture the acoustic response.
Surface directions on these crystals are not characterized a priori, ne-cessitating the application of an angular shift to data collected on dif-ferent samples so the responses may be compared directly. The cor-rection is applied such that for all data, the surface direction (the ‘fast’ direction) appears at 15?and (the ‘slow’ direction)
appears at 45?. Data for all samples is collected in 5? increments on
a manual rotation stage with 2?gradations. For all samples, the TGS
laser spots are placed in the center of the ion beam spot. Some discol-oration is visible in the spots exposed to the ion beam, but in all cases the surface finish is of sufficient quality to make TGS measurements.
The variation in measured SAW speed as a function of surface angle for all sample is shown in Fig. 1. The unirradiated data pre-sented matches very closely to the expected SAW speeds calculated from elastic theory [44]. At the lowest dose, there is a uniform stiff-ening in the measured response across all surface angles. At 10 dpa, the response along the slow direction has recovered to the unirradiated case, and the response along the fast direction has softened slightly from the initial case. For the 30 and 50 dpa case there is a continued, small change along the fast direction and no notable change along the slow direction. Finally, at 90 dpa there is a significant reduction in the SAW speed along the fast direction and a small change along the slow direction. One feature of note is that, even at the highest doses, (2)
UNCORRECTED
PROOF
4 Acta Materialia xxx (2017) xxx-xxx
the periodicity of the response remains constant, indicating that the crystalline nature of the sample has been retained.
Since measurements are not made at the same absolute values of surface angle on every sample, half-sinusoidal profiles of the form
are fit to data in the angular range θ?[0?,30?] to facilitate their
com-parison, where θ is the corrected surface angle in degrees, A and B are amplitude constants,ϕ is a phase shift, and w = π/30 given the
six-fold periodicity of the surface. The maximum value of best fit pro-file to each set of data can be compared to determine the change in SAW speed as a function of dose along the direction of maximum
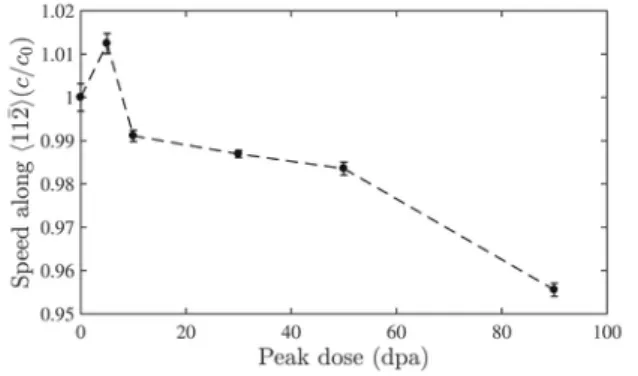
Fig. 2. Change in SAW speed along the direction as a function of the dose level at the damage peak. As data are not sampled uniformly, the values used to calculate this speed change are fit using half-sinusoidal profiles to the experimental data shown in Fig. 1.
Table 3
Peak and intermediate doses received by, dose rate at the damage peak for, change in SAW speed along the fast direction of, total areal porosity for, and volumetric swelling for each sample. Swelling is averaged from the surface to a depth of 4.8 μm and in-creases monotonically with exposure level, with the exception of the 30 dpa volumetric case. Peak dose at 4.25 μm (dpa) Intermediate dose at 2.4 μm (dpa) Peak dose rate (×10− 3 dpa/s) Δc/c0 along (%) Areal porosity (%) Volumetric swelling (%) 5.0 1.1 1.5 +1.24 0.79 0.24 10 2.1 1.9 −0.89 1.96 1.36 30 6.3 0.85 −1.31 3.55 1.17 50 11 1.0 −1.64 8.59 8.82 90 19 1.7 −4.45 12.8 12.0
change. Fig. 2 shows this fit speed along as a function of dose and the data is presented in Table 3 as well. The trends elucidated here are the same as described above, but are perhaps easier to visualize. The error bars on these point are taken as the error in the measurement of the data point closest to , as the error in the data at different angles varies little.
HAADF STEM micrographs, shown in Fig. 3 in addition to the SRIM generated damage profile, confirm the presence of void swelling in all exposed samples. In all cases, the depth profile of the observed voids is non-uniform. At the lowest doses, the swelling re-gion is located away from the damage peak due to the injected inter-stitial effect [55]. As the amount of swelling increases at higher doses, the depth at which swelling is observed is correspondingly increased as the average density is reduced in the near surface region [56]. In the 5 and 10 dpa samples a sufficient vacancy supersaturation has not been generated in near-surface layer (above the void bands) to nucle-ate and grow observable swelling. In the 30 dpa sample, this satura-tion level has clearly been reached in the near-surface region, the dose at 2.4 μm is 6.3 dpa, similar to level at which swelling is initially ob-served in the 5 dpa sample. For the higher-dose samples, character-istic features such as a void denuded zone near the surface and a de-crease in void size near the damage peak are observable. The 50 and 90 dpa samples have large, crystallographic voids with facets aligned with the surface orientation of the single crystal. The swelling profile of the 30 dpa sample is found to be much finer compared to that of other samples. At the exposure temperature used here, prior self-ion irradiation work by Glowinski et al. indicates that reducing the dose rate from the maximum used in this study should promote void nu-cleation and swelling [57]. Thus the comparatively low dose rate seen by the 30 dpa sample, a factor of 2.2 lower than the 10 dpa sample as shown in Table 3, is likely the cause of the qualatative difference in swelling profile. Other higher-order effects such as slight variations in exposure temperature or sample contamination could also affect the difference observed here. Nevertheless, in all cases the damaged re-gion in which the most void formation is observed is within the elasti-cally-excited TGS penetration depth. Diffraction patterns of irradiated samples show no evidence of amorphization, confirming that the crys-tallinity is retained following irradiation.
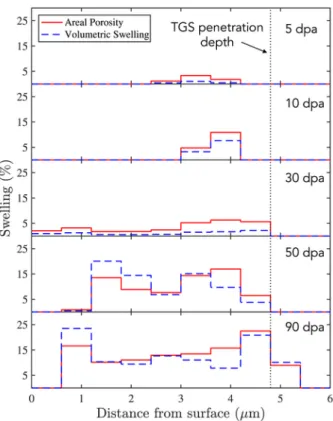
STEM micrographs are processed using image analysis to create histograms of swelling versus depth for each sample, both as areal porosity and as volumetric swelling, shown in Fig. 4. This analysis shows that, for the high-dose samples, a double-peaked swelling pro-file is established which is consistent with other pure, self-ion irradia-tion studies [58]. Fig. 4 again shows that the preponderance swelling region is captured within the TGS penetration depth. From these pro-files an average swelling can be calculated for both methods over the
Fig. 3. a) SRIM calculated damage profile for 35 MeV Cu6+into Cu normalized to 90 dpa at peak with TGS penetration depth indicated. b–f) HAADF STEM cross-sectional images
of irradiated copper samples. The crystal matrix is light, while irradiation-induced voids appear dark. A platinum layer is deposited on the sample surface prior to FIB milling to avoid damaging the exposed material. The incident ion beam direction is from the top in all micrographs. The visible contrast bands are due to residue on the lamella left from sample storage.
UNCORRECTED
PROOF
Fig. 4. Histograms of areal porosity (solid red) and volumetric swelling (dashed blue)versus depth for all exposed samples calculated in 600 nm bins. Calculated volumetric swelling underestimates the areal porosity for samples with an average void size that much smaller than the lamella thickness. (For interpretation of the references to color in this figure, the reader is referred to the online version of this article.)
TGS analysis depth. Table 3 shows the swelling calculated in this manner, compared to both the peak and intermediate dose received by each sample. The error in the average swelling values is esti-mated to be 30% for the 5 dpa sample and 20% for all other sam-ples based on the image resolution of the STEM micrographs and the SEM cross-sections used to determine lamella thickness. At lower ex-posures, the volume swelling method underestimates the total amount of swelling present as the average void diameter is smaller than the thickness of the lamella, particularly for the 5 and 30 dpa samples. At higher doses, despite the spherical approximation used and the faceted voids observed, the two methods return comparable values for the cal-culated swelling. Given the faceting present, the areal porosity is later used as an estimate of the density change for the 90 dpa sample, which is necessary in the determination of the elastic constants of the ex-posed material.
4. Discussion
Zinkle et al. showed that self-ion irradiation of pure copper up to a level of 40 dpa at peak at temperatures in the range 100–500 °C should not induce significant void swelling unless oxygen impurities are pre-sent in the copper matrix to stabilize void formation [32]. Despite the high base-metal purity of the samples exposed here (manufacturer specified <1 ppm oxygen), a large amount of void swelling is clearly observed. This behavior is consistent with previous studies of high-pu-rity self-ion irradiated copper which do not specifically out-gas sam-ples prior to exposure [57,59,60]. Furthermore, the faceted voids ob-served here indicate that even if residual oxygen stabilizes initial void formation, the final voids have little internal gas pressure [9].
Given that observable swelling is present in the lowest-dose sam-ple in the matrix explored here, it is interesting to note that the mea-sured acoustic response at 5 dpa shows stiffening and not softening like higher-dose samples. This response is likely due the presence of a region near the surface which has experienced much lower dose lev-els than those at the damage peak. Early work by Friedel explained an increase in measured elastic modulus of low-dose irradiated metals as measured in ultrasonic experiments can be attributed to a disloca-tion pinning mechanism [34]. For a material with a given dislocadisloca-tion density, the presence of small defect clusters may decrease the aver-age pinned segment length, decreasing the amount a pinned segment may bow under an elastic load, and thereby increasing the observed elastic modulus. This effect has been observed even in well-annealed, high-purity copper under neutron and electron irradiation [36]. More recently, Li et al. show that in copper self-ion irradiated to low doses, the primary defects formed are stacking fault tetrahedra (SFTs) [33]. In that study, the SFT density was found to saturate at about 1 dpa and change little afterwards. These observations indicate that there is likely a high SFT density in the region between the observed void swelling band and the surface of the 5 dpa sample exposed here, as the dose received at 2.4 μm is 1.1 dpa. Using molecular dynamics simu-lations, Wirth et al. additionally have shown that SFTs in copper act like hard pins to dislocation motion [61]. Therefore, although earlier work in this area does not seek to identify the defects causing this pin-ning effect, it seems likely that the SFT formation is the root of the saturated stiffening behavior observed here and in previous ultrasonic experiments [35,36].
In these TGS experiments, areas which have experienced differ-ent dose levels are being averaged in the measured response. In the lowest dose sample, the effect of stiffening due to dislocation pinning above the observed void band dominates over the expected softening due to volumetric swelling [37]. At higher doses, volumetric swelling effects win out and a monotonic softening in the acoustic response is observed. Thinking forward to using TGS as an in situ tool for rapid materials development, this transition in dominant mechanisms can be used as a coarse binary metric to detect the presence of void swelling in the TGS analysis region. Following defect saturation, the transi-tion to a decrease in measured SAW velocity, or the recovery to the pre-exposure value, could be used as a threshold to determine if void swelling has occurred. This general trend should be true for both elas-tically anisotropic (single crystal) materials as well as isotropic mate-rials (polycrystals). For the single crystal case, as the elastic constants are not changed uniformly, the surface direction expected to experi-ence the largest change, in this case , should be aligned with the experimental SAW polarization prior to exposure to ensure ease of de-tection. That TGS non-lineary averages over regions exposed to dif-ferent radiation doses is an interesting challenge for correlating prop-erty changes to one particular dose. Future work involving compar-isons to uniformly damaged microstructures, from neutron irradiations for example, and calculations of the average dose in the TGS analysis region weighted by the mechanical acoustic displacement profile must be carried out to determine the most appropriate single dose to which a TGS measurement may be correlated.
In addition to the ability to give a binary determination about the presence of void swelling in irradiated single crystals, the TGS data collected here, in concert with some determination of the den-sity change resulting from irradiation, can be used to determine the change in a material's elastic constants. In this case, the calculated areal porosity from STEM imaging has been used to estimate the density change as a result of void swelling. However, future stud-ies could use changes in thermal transport propertstud-ies as measured through TGS [29,45] to estimate changes in density resulting from
UNCORRECTED
PROOF
6 Acta Materialia xxx (2017) xxx-xxx
void swelling [63,64]. Other authors have constructed optimization technique by which elastic constants can be reconstructed through laser-induced acoustic data similar to those taken here [65,66]. How-ever, as a simple proof-of-principle, a set of cubic elastic constants has been manually optimized to the 90 dpa data through iterative cal-culations of the SAW response versus acoustic polarization using the method of Every et al. [54]. These calculations are carried out con-sidering a semi-infinite bulk with density and elastic constants speci-fied, and not a layer with irradiation-modified properties atop a pris-tine substrate. Duncan et al. found that the best-fit values determined using a two-layer approach vary little from a single layer case if the TGS excitation wavelength is equal to or smaller than the ion implan-tation depth [31].
Materials with cubic symmetry have only three independent elas-tic constants, C11, C12, and C44. From the acoustic response on the
{111} plane of cubic crystals, C11and C12can not be independently
determined, but the value (C11− C12)/2 may [67]. Therefore, the
min-imization carried out here modifies C11 and C12 by the same
con-stant fraction for a given iteration. A useful characterization of the of the anisotropy of the elastic response of a cubic material is given by the Zener anisotropy ratio, A = 2C44/(C11− C12) [68]. The SAW
response of a material with an anisotropy ratio of A = 1 will show no variation with respect to acoustic polarization on any crystal sur-face. The optimized values for the elastic constants of the 90 dpa sam-ple are given in Table 4. Although few direct comparisons exist in the literature, the observed trend of decreasing elastic constants with volumetric swelling is consistent with studies showing a reduction in isotropic elastic constants with increasing porosity in compacted nanocrystalline copper [69]. Of particular note here is the reduction in the anisotropy ratio of the exposed sample, which is to be expected given the non-uniform change in SAW speed along the fast and slow directions on the {111} surface. This analysis shows that TGS may be used as a tool to determine changes in the elastic performance of highly damaged materials in addition to simply determining the pres-ence of volumetric swelling.
5. Conclusions
In this work, transient grating spectroscopy (TGS) is used to in-vestigate the effects of self-ion irradiation-induced void swelling on the acoustic and elastic properties of pure, single crystal copper. The depth of the imposed damage profile is chosen to closely match the mechanical excitation depth generated using TGS by tuning the im-plantation energy. HAADF STEM imaging confirms that swelling levels up to 12.8%, as calculated by areal void fraction, are captured in the surface acoustic wave (SAW) response of the irradiated single crystals. At high doses, volumetric swelling has the effect of non-uni-formly reducing the cubic elastic constants of copper, reducing the anisotropy ratio. At lower doses, the effect of matrix stiffening via dislocation interactions with SFTs is postulated to be the cause of an
Table 4
A comparison of best fit elastic constants and anisotropy ratio for unirradiated pure cop-per starting from constants given in Ref. [62] to best fit values for the 90 dpa sample. Surface acoustic wave speeds are experimentally measured using TGS in both cases.
ρ (g/
cm3) C(GPa)11 C(GPa)12 C(GPa)44 A
Speed along (m/s) Speed along (m/s) Unirradiated 8.96 165.0 119.0 73.51 3.20 1942 1596 90 dpa 7.81 142.7 102.9 52.93 2.66 1856 1589 % change −12.8% −13.5% −13.5% −28.0% −16.9% −4.45% −0.47%
increase in the measured SAW speed. The competition between these two mechanisms, stiffening at low doses and softening at high doses, is proposed as a metric to detect the onset of void swelling. Coupled with the flexibility of ion beam facilities, the non-contact nature of the interrogation, and the previously reported second-scale time resolution [49], the work presented here strongly motivates the development of TGS as an in situ diagnostic for characterizing ion irradiation damage. A full extension of this method to highly-exposed engineering alloys must include a careful consideration of effects expected in polycrys-talline materials. Particularly, the size of the excitation spot relative to the grain size will be important in interpreting polycrystalline TGS test results. Nevertheless, such a diagnostic, able to detect the onset of irra-diation-induced swelling in a single continuous measurement, would be a powerful tool in development of new bulk materials for advanced nuclear applications.
Acknowledgements
The authors would like to thank C. M. Barr at Sandia and the mem-bers of the Mesoscale Nuclear Materials Group at MIT for construc-tive comments and feedback. This work is supported by the the DOE NNSA Stewardship Science Graduate Fellowship under cooperative agreement No. DE-NA0002135 and the MIT-SUTD International Design Center (IDC). M.P.S. acknowledges funding from the US Nuclear Regulatory Commission's MIT Nuclear Education Faculty Development Program under Grant No. NRC-HQ-84-15-G-0045. Sandia National Laboratories is a multi-mission laboratory managed and operated by National Technology and Engineering Solutions of Sandia, LLC, a wholly owned subsidiary of Honeywell International, Inc., for the U.S. Department of Energy's National Nuclear Security Administration under contract DE-NA-0003525.
References
[1] C. Cawthorne, J.E. Fulton, Voids in irradiated stainless steel, Nature 216 (1967) 575–576.
[2] F.A. Garner, M.B. Toloczko, Irradiation creep and void swelling of austenitic stainless steels at low displacement rates in light water energy systems, J. Nucl. Mater. 251 (1997) 252–261.
[3] F.A. Garner, L.R. Greenwood, D.L. Harrod, Potential high fluence response of pressure vessel internals constructed from austenitic stainless steels, In: Sixth In-ternational Symposium of the Environmental Degradation of Materials in Nu-clear Power Systems, 1993, p. 783.
[4] F.M. Gregory, S. Fyfitch, Baffle bolt failures - a B&W owners group approach, Nucl. Eng. Des. 192 (2–3) (1999) 345.
[5] D.J. Edwards, E.P. Simonen, F.A. Garner, L.R. Greenwood, B.M. Oliver, S.M. Bruemmer, Influence of irradiation temperature and dose gradients on the mi-crostructural evolution in neutron-irradiated 316SS, J. Nucl. Mater. 317 (1) (2003) 32–45.
[6] E.A. Little, D.A. Stow, Void-swelling in irons and ferritic steels, J. Nucl. Mater. 87 (1) (1979) 25–39.
[7] V.S. Neustroyev, Z.Y. Ostrovskiy, V.K. Shamardin, Influence of stresses on ra-diational swelling and vacancy porosity parameters of neutron irradiated austen-ite steels, Phys. Met. Metallog. 86 (1) (1998) 115.
[8] B.J. Makenas, S.A. Chastain, B.C. Gneiting, Dimensional changes in fftf austenitic cladding and ducts, In: LMR: a Decade of LMR Progress and Promise, 1990, p. 176.
[9] G.S. Was, Fundamentals of Radiation Materials Science, second ed., Springer, 2017, Ch. 7 & Ch. 8.
[10] M.P. Short, S. Yip, Materials aging at the mesoscale: kinetics of thermal, stress, radiation activations, Curr. Opin. Solid State Mater. Sci. 19 (4) (2015) 245–252. [11] S.I. Golubov, R.E. Stoller, S.J. Zinkle, A.M. Ovcharenko, Kinetics of coarsening
of helium bubbles during implantation and post-implantation annealing, J. Nucl. Mater. 361 (2–3) (2007) 149–159.
[12] C.-C. Fu, J.D. Torre, F. Willaime, J.-L. Bocquet, A. Barbu, Multiscale modelling of defect kinetics in irradiated iron, Nat. Mater. 4 (1) (2005) 68–74.
[13] X. Hu, D. Xu, T.S. Byun, B.D. Wirth, Modeling of irradiation hardening of iron after low-dose and low-temperature neutron irradiation, Model. Simul. Mater. Sci. Eng. 22(6) (065002) (2014).
UNCORRECTED
PROOF
[14] A.D. Brailsford, R. Bullough, The rate theory of swelling due to void growth in irradiated metals, J. Nucl. Mater. 44 (2) (1972) 121–135.
[15] N.I. Budylkin, E.G. Mironova, V.M. Chernov, V.A. Krasnoselov, S.I. Porollo, F.A. Garner, Neutron-induced swelling and embrittlement of pure iron and pure nickel irradiated in the BN-350 and BOR-60 fast reactors, J. Nucl. Mater. 375 (3) (2008) 359–364.
[16] J.L. Katz, H. Wiedersich, Effect of insoluble gas molecules on nucleation of voids in materials supersaturated with both vacancies and interstitials, J. Nucl. Mater. 46 (1) (1973) 41–45.
[17] N.H. Packan, K. Farrell, J.O. Stiegler, Correlation of neutron and heavy-ion damage, J. Nucl. Mater. 78 (1) (1978) 143–155.
[18] H.R. Brager, The effects of cold working and pre-irradiation heat treatment on void formation in neutron-irradiated type 316 stainless steel, J. Nucl. Mater. 57 (1) (1975) 103–118.
[19] M.J. Makin, G.P. Walters, A.J.E. Foreman, The void swelling behaviour of elec-tron irradiated type 316 austenitic steel, J. Nucl. Mater. 95 (1) (1980) 155–170. [20] T. Chen, E. Aydogan, J.G. Gigax, D. Chen, J. Wang, X. Wang, S. Ukai, F.A.
Garner, L. Shao, Microstructural changes and void swelling of a 12Cr ODS fer-ritic-martensitic alloy after high-dpa self-ion irradiation, J. Nucl. Mater. 467 (Part 1) (2015) 42–49.
[21] E. Getto, K. Sun, A.M. Monterrosa, Z. Jiao, M.J. Hackett, G.S. Was, Void swelling and microstructure evolution at very high damage level in self-ion irra-diated ferritic-martensitic steels, J. Nucl. Mater. 480 (2016) 159–176. [22] K. Hattar, D.C. Bufford, D.L. Buller, Concurrent in situ ion irradiation
transmis-sion electron microscope, Nucl. Instr. Meth. Phys. Res. B 338 (2014) 56–65. [23] W. Xu, Y. Zhang, G. Cheng, W. Jian, P.C. Millett, C.C. Koch, S.N. Mathaudhu,
Y. Zhu, In-situ atomic-scale observation of irradiation-induced void formation, Nat. Commun. 4 (2013) 2288.
[24] T. Okita, J. Etoh, M. Sagisaka, T. Matsunaga, Y. Isobe, P.D. Freyer, Y. Huang, J.M.K. Wiezorek, F.A. Garner, Validation of ultrasonic velocity measurements for detecting void swelling in first-wall structural materials, Fusion Sci. Technol. 66 (1) (2014) 77–82.
[25] K.H. Matlack, J.-Y. Kim, J.J. Wall, J. Qu, L.J. Jacobs, M.A. Sokolov, Sensitivity of ultrasonic nonlinearity to irradiated, annealed, and re-irradiated microstructure changes in RPV steels, J. Nucl. Mater. 448 (1) (2014) 26–32.
[26] D.H. Hurley, S.J. Reese, S.K. Park, Z. Utegulov, J.R. Kennedy, K.L. Telschow, In situ laser-based resonant ultrasound measurements of microstructure mediated mechanical property evolution, J. Appl. Phys. 107 (6) (2010), 063510. [27] S. Miro, E. Bordas, L. Thome, J.-M. Constantini, F. Lepretre, P. Trocellier, Y.
Serruys, L. Beck, D. Gosset, R. Verlet, J. Huguet-Garcia, M. Tupin, M. Belleil, Monitoring of the microstructure of ion-irradiated nuclear ceramics by in situ ra-man spectroscopy, J. Rara-man Spectrosc. 47 (4) (2016) 476–485.
[28] B. Breeger, E. Wendler, W. Trippensee, Ch Schubert, W. Wesch, Two-beam ir-radiation chamber for in situ ion-implantation and RBS at temperatures from 15K to 300K, Nucl. Instr. Meth. Phys. Res. B 174 (1) (2001) 199–204. [29] F. Hofmann, D. Nguyen-Manh, M.R. Gilbert, C.E. Beck, J.K. Eliason, A.A.
Maznev, W. Liu, D.E.J. Armstrong, K.A. Nelsond, S.L. Dudarev, Lattice swelling and modulus change in a helium-implanted tungsten alloy: X-ray mi-cro-diffraction, surface acoustic wave measurements, and multiscale modelling, Acta Mater. 89 (0) (2015) 352–363.
[30] F. Hofmann, D.R. Mason, J.K. Eliason, A.A. Maznev, K.A. Nelson, S.L. Du-darev, Non-contact measurement of thermal diffusivity in ion-implanted nuclear materials, Sci. Rep. 5 (2015), 16042.
[31] R.A. Duncan, F. Hofmann, A. Vega-Flick, J.K. Eliason, A.A. Maznev, A.G. Every, K.A. Nelson, Increase in elastic anisotropy of single crystal tungsten upon He-ion implantation measured with laser-generated surface acoustic waves, Appl. Phys. Lett. 109 (15) (2016).
[32] S.J. Zinkle, G.L. Kulcinski, R.W. Knoll, Microstructure of copper following high dose 14-MeV Cu ion irradiation, J. Nucl. Mater. 138 (1) (1986) 46–56. [33] N. Li, K. Hattar, A. Misra, In situ probing of the evolution of irradiation-induced
defects in copper, J. Nucl. Mater. 439 (1–3) (2013) 185–191.
[34] J. Friedel, XLVI. Anomaly in the rigidity modulus of copper alloys for small concentrations, Philos. Mag. 44 (351) (1953) 444–448.
[35] D.O. Thompson, D.K. Holmes, Effects of neutron irradiation upon the young's modulus and internal friction of copper single crystals, J. Appl. Phys. 27 (7) (1956) 713–723.
[36] D.M. Parkin, J.A. Goldstone, H.M. Simpson, J.M. Hemsky, Point defect-disloca-tion interacdefect-disloca-tions in copper following pulsed neutron and electron irradiadefect-disloca-tions, J. Phys. F Met. Phys. 17 (3) (1987) 577.
[37] I.I. Balachov, E.N. Shcherbakov, A.V. Kozlov, I.A. Portnykh, F.A. Garner, In-fluence of radiation-induced voids and bubbles on physical properties of austenitic structural alloys, J. Nucl. Mater. 329–333 (Part A) (2004) 617–620. [38] J. Sermeus, B. Verstraeten, R. Salenbien, P. Pobedinskas, K. Haenen, C. Glo-rieux, Determination of elastic and thermal properties of a thin nanocrystalline diamond coating using all-optical methods, Thin Solid Films 590 (2015) 284–292.
[39] S. Kitazawa, A. Chiba, E. Wakai, Laser-induced surface acoustic waves and their detection via diagnostic systems for detecting radiation damage on steel materials of nuclear devices, Nucl. Instr. Meth. Phys. Res. A 786 (2015) 47–50.
[40] S.J. Zinkle, K. Farrell, Void swelling and defect cluster formation in reactor-irra-diated copper, J. Nucl. Mater. 168 (3) (1989) 262–267.
[41] J.F. Ziegler, M.D. Ziegler, J.P. Biersack, Srim: the stopping and range of ions in matter (2010), Nucl. Instr. Meth. Phys. Res. B 268 (11–12) (2010) 1818–1823. [42] R.E. Stoller, M.B. Toloczko, G.S. Was, A.G. Certain, S. Dwaraknath, F.A.
Gar-ner, On the use of srim for computing radiation damage exposure, Nucl. Instr. Meth. Phys. Res. B 310 (2013) 75–80.
[43] ASTM E521-96, Standard Practice for Neutron Radiation Damage Simulation by Charged–particle Irradiation, Technical report ASTM International, West Conshohocken, PA, USA, 2009.
[44] C.A. Dennett, P. Cao, S.E. Ferry, A. Vega-Flick, A.A. Maznev, K.A. Nelson, A.G. Every, M.P. Short, Bridging the gap to mesoscale radiation materials sci-ence with transient grating spectroscopy, Phys. Rev. B 94 (2016), 214106. [45] J.A. Johnson, A.A. Maznev, M.T. Bulsara, E.A. Fitzgerald, T.C. Harman, S.
Calawa, C.J. Vineis, G. Turner, K.A. Nelson, Phase-controlled, heterodyne laser-induced transient grating measurements of thermal transport properties in opaque material, J. Appl. Phys. 111 (2) (2012).
[46] O.W. Kading, H. Skurk, A.A. Maznev, E. Matthias, Transient thermal gratings at surfaces for thermal characterization of bulk materials and thin films, Appl. Phys. A 61 (3) (1995) 253–261.
[47] D. Royer, E. Dieulesaint, Rayleigh wave velocity and displacement in or-thorhombic, tetragonal, hexagonal, and cubic crystals, J. Acoust. Soc. Am. 76 (5) (1984) 1438–1444.
[48] P.G. Malischewsky, Comparison of approximated solutions for the phase veloc-ity of rayleigh waves (comment on ’characterization of surface damage via sur-face acoustic waves'), Nanotechnology 16 (6) (2005) 995.
[49] C.A. Dennett, M.P. Short, Time-resolved, dual heterodyne phase collection tran-sient grating spectroscopy, Appl. Phys. Lett. 110 (21) (2017), 211106. [50] C.A. Schneider, W.S. Rasband, K.W. Eliceiri, NIH image to ImageJ: 25 years of
image analysis, Nat. Meth. 9 (7) (2012) 671–675.
[51] M.B. Toloczko, F.A. Garner, V.N. Voyevodin, V.V. Bryk, O.V. Borodin, V.V. Melnychenko, A.S. Kalchenko, Ion-induced swelling of ODS ferritic alloy MA957 tubing to 500 dpa, J. Nucl. Mater. 453 (1) (2014) 323–333. [52] E. Getto, Z. Jiao, A.M. Monterrosa, K. Sun, G.S. Was, Effect of pre-implanted
helium on void swelling evolution in self-ion irradiated HT9, J. Nucl. Mat. 462 (2015) 458–469.
[53] C. A. Dennett and M. P. Short. https://doi.org/10.5281/zenodo.1066174. [54] A.G. Every, A.A. Maznev, W. Grill, M. Pluta, J.D. Comins, O.B. Wright, O.
Matsuda, W. Sachse, J.P. Wolfe, Bulk and surface acoustic wave phenomena in crystals: observation and interpretation, Wave Motion 50 (8) (2013) 1197–1217. [55] E.H. Lee, L.K. Mansur, M.H. Yoo, Spatial variation in void volume during
charged particle bombardment – the effects of injected interstitials, J. Nucl. Mater. 85 (1979) 577–581.
[56] E. Getto, K. Sun, S. Taller, A.M. Monterrosa, Z. Jiao, G.S. Was, Methodology for determining void swelling at very high damage under ion irradiation, J. Nucl. Mater. 477 (2016) 273–279.
[57] L.D. Glowinski, J.M. Lanore, C. Fiche, Y. Adda, Etude de la formation des cavites dtrradiation dans le cuivre IV-etude des mecanismes, J. Nucl. Mater. 61 (1) (1976) 41–52.
[58] L. Shao, C.-C. Wei, J. Gigax, A. Aitkaliyeva, D. Chen, B.H. Sencer, F.A. Gar-ner, Effect of defect imbalance on void swelling distributions produced in pure iron by 3.5 MeV self-ions, J. Nucl. Mater. 453 (1) (2014) 176–181.
[59] L.D. Glowinski, C. Fiche, Etude de la formation des cavites d’irradiation dans le cuivre II-irradiation aux ions cuivre de 500 keV – effet de la dose, J. Nucl. Mater. 61 (1) (1976) 22–28.
[60] L.D. Glowinski, C. Fiche, Etude de la formation des cavites d’irradiation dans le cuivre III-irradiation aux ions cuivre de 500 keV – effet des gaz implantes, J. Nucl. Mater. 61 (1) (1976) 29–40.
[61] B.D. Wirth, V.V. Bulatov, T. de la Rubia, Dislocation-stacking fault tetrahedron interactions in cu, J. Eng. Mater. Technol. 124 (3) (2002) 329–334.
[62] W.C. Overton, John Gaffney, Temperature variation of the elastic constants of cubic elements. I. copper, Phys. Rev. 98 (1955) 969–977.
[63] F.A. Garner, H.R. Brager, K.R. Anderson, Neutron-induced changes in density and electrical conductivity of copper alloys at 16 to 98 dpa and 430°C, J. Nucl.
Mat. 179–18 (1991) 250–253.
[64] M. Ames, G. Kohse, T.-S. Lee, N.J. Grant, O.K. Harling, Mechanical property and conductivity changes in several copper alloys after 13.5 dpa neutron irradia-tion, J. Nucl. Mater. 141 (1986) 174–178.
[65] B. Verstraeten, J. Sermeus, R. Salenbien, J. Fivez, G. Shkerdin, C. Glorieux, De-termination of thermoelastic material properties by differential heterodyne detec-tion of impulsive stimulated thermal scattering, Photoacoustics 3 (2) (2015) 64–77.
[66] X. Du, J.-C. Zhao, Facile measurement of single-crystal elastic constants from polycrystalline samples, npj Comput. Mater. 3 (17) (2017).
[67] J. Sermeus, Thermoelastic Characterization of Functional Thin Films on Anisotropic Substrates, PhD thesis Katholieke Universiteit (KU) Leuven, 2014. [68] C. Zener, Contributions to the theory of beta-phase alloys, Phys. Rev. 71 (1947)
846–851.
[69] P.G. Sanders, J.A. Eastman, J.R. Weertman, Elastic and tensile behavior of nanocrystalline copper and palladium, Acta Mater. 45 (10) (1997) 4019–4025.