HAL Id: inserm-00839440
https://www.hal.inserm.fr/inserm-00839440
Submitted on 28 Jun 2013HAL is a multi-disciplinary open access archive for the deposit and dissemination of sci-entific research documents, whether they are pub-lished or not. The documents may come from teaching and research institutions in France or abroad, or from public or private research centers.
L’archive ouverte pluridisciplinaire HAL, est destinée au dépôt et à la diffusion de documents scientifiques de niveau recherche, publiés ou non, émanant des établissements d’enseignement et de recherche français ou étrangers, des laboratoires publics ou privés.
Inhibition of xanthine oxidase reduces
hyperglycemia-induced oxidative stress and improves
mitochondrial alterations in skeletal muscle of diabetic
mice.
Amélie Bravard, Charlotte Bonnard, Annie Durand, Marie-Agnès Chauvin,
Roland Favier, Hubert Vidal, Jennifer Rieusset
To cite this version:
Amélie Bravard, Charlotte Bonnard, Annie Durand, Marie-Agnès Chauvin, Roland Favier, et al.. In-hibition of xanthine oxidase reduces hyperglycemia-induced oxidative stress and improves mitochon-drial alterations in skeletal muscle of diabetic mice.: xanthine oxidase-induced muscle oxidative stress. AJP - Endocrinology and Metabolism, American Physiological Society, 2011, 300 (3), pp.E581-91. �10.1152/ajpendo.00455.2010�. �inserm-00839440�
Inhibition of xanthine oxidase reduced hyperglycaemia-induced oxidative
stress and improved mitochondrial alterations in skeletal muscle of diabetic
mice.
Amélie Bravard 1*, Charlotte Bonnard 1*, Annie Durand1, Marie-Agnès Chauvin1, Roland Favier2, $, Hubert Vidal1 and Jennifer Rieusset1.
1
Université de Lyon, Lyon, F-69003 ; INSERM, U870, IFR62, Lyon, F-69008 ; INRA, UMR1235, Lyon, F-69008 ; INSA-Lyon, RMND, Villeurbanne, F-69621 ; Université Lyon 1, Lyon, F-69003 ; Hospices Civils de Lyon, Lyon, F-69008, France
2
Laboratoire de Bioénergétique Fondamentale et Appliquée, INSERM U884, Université Joseph Fourier, Grenoble Cedex, France. 2
*
CB and AB contributed equally to this work. $ In memory of Dr. Roland Favier.
Running head: xanthine oxidase-induced muscle oxidative stress
Address correspondance to: Jennifer Rieusset, UMR INSERM U870/INRA U1235, Faculté de médecine Lyon Sud, 165 chemin du grand Revoyet, BP12, Oullins, F-69921 cedex. Tel: 00 33 (0)4 26 23 59 20, Fax : 00 33 (0)4 26 23 59 16, E-mail: jennifer.rieusset@univ-lyon1.fr
Abstract
Reactive oxygen species (ROS) have been widely implicated in the pathogenesis of diabetes and more recently in mitochondrial alterations in skeletal muscle of diabetic mice. However, the exact sources of ROS in skeletal muscle remained so far elusive. Aiming at better understanding the causes of mitochondrial alterations in diabetic muscle, we designed this study to characterize the sites of ROS production in skeletal muscle of streptozotocin(STZ)-induced diabetic mice. Hyperglycaemic STZ mice showed increased markers of systemic and muscular oxidative stress, as evidenced by increased circulating H2O2 and muscle carbonylated protein levels. Interestingly, insulin treatment reduced
hyperglycaemia and improved systemic and muscular oxidative stress in STZ mice. We demonstrated that increased oxidative stress in muscle of STZ mice is associated with an increase of xanthine oxidase (XO) expression and activity and is mediated by an induction of H2O2 production by both mitochondria and XO. Lastly, treatment of STZ mice, as well as
high fat and high sucrose diet-fed mice, with oxypurinol reduced markers of systemic and muscular oxidative stress and prevented structural and functional mitochondrial alterations, confirming the in vivo relevance of XO in ROS production in diabetic mice. These data indicate that mitochondria and XO are the major sources of hyperglycaemia-induced ROS production in skeletal muscle and that the inhibition of XO reduces oxidative stress and improves mitochondrial alterations in diabetic muscle.
Introduction
Altered lipid metabolism and mitochondrial dysfunction in skeletal muscle have been associated with insulin resistance and type 2 diabetes (13, 28). These alterations in mitochondria structure, density and/or function (23, 34, 36) have lead to the speculation that a decrease in the capacity to oxidize fat, due to acquired or inherited mitochondrial defect, may be the underlying cause of lipid accumulation and thus, as a consequence, of insulin resistance (24). However, we (5) and others (14, 37, 42, 45) have challenged this hypothesis, and we recently demonstrated that mitochondrial alterations are not a causal event in the development of diet-induced insulin resistance, but rather a consequence of oxidative stress in skeletal muscle of diabetic mice (5). Consequently, a better understanding of the exact sites of reactive oxygen species (ROS) generation in skeletal muscle is important in order to improve mitochondria alterations and reduce lipotoxicity.
Oxidative stress has also been implicated in the pathogenesis of insulin resistance and diabetes, based in part on the role of ROS in micro- and macrovascular complications associated with hyperglycaemia in late-stage diabetes (38). Interestingly, ROS production is not confined to vascular cells and several data also suggest that ROS may be produced in many tissues, and particularly in insulin-sensitive tissues (12, 41). Among them, skeletal muscle is now recognized as a potential source of both ROS and reactive nitrogen species (RNS) under various physiological and pathological conditions (16). Type 1 and type 2 diabetes-associated hyperglycaemia are pathological situations in which increased oxidative stress could affect the function of skeletal muscle (29). Furthermore, we have previously shown that acute hyperglycaemia induces a rapid down-regulation of a number of genes in skeletal muscle of healthy subjects, likely via a mechanism involving oxidative stress (32).
However, mechanisms responsible for the glucose-induced oxidative stress in skeletal muscle remain to be elucidated.
Several cellular sources could be involved in the production of ROS into muscle, including complexes I and III of the electron transport chain of mitochondria (3, 27), membrane-associated NADPH oxidase (10, 18), and xanthine oxydase (XO) (1). In addition, nitric oxide (NO) can also be generated by skeletal muscle, since both neuronal (type I) and endothelial (type III) isoforms of NO synthase (NOS) are expressed in this tissue (2). It has been demonstrated that NO is able to react with superoxides to generate peroxynitrite, suggesting possible interactions between ROS and RNS formed in skeletal muscle, leading to their reduced bioavailability and potentially altered cellular responses (4). In parallel, skeletal muscle possesses a well-developed system to regulate ROS and prevent potentially deleterious effects. These protection systems include both mitochondrial and cytosolic isoforms of superoxide dismutase (MnSOD and CuZnSOD, respectively), catalase and gluthatione peroxidase enzymes, and a number of direct scavengers of ROS. However, the relative importance of the production and protective pathways has not been established in skeletal muscle in diabetic states. Elucidation of this issue could help to prevent oxidative stress and associated muscle damages in this disease.
The goal of our study was thus to investigate the pathways involved in hyperglycemia-induced ROS generation in skeletal muscle of diabetic mice. We have chosen to study the streptozotocin (STZ)-induced diabetic mice because we have previously demonstrated that oxidative stress induced similar mitochondrial alterations in both type 1 and type 2 diabetic mice (5). The identification of hyperglycaemia-induced ROS production systems in skeletal muscle of diabetic STZ mice was performed 1) by measuring the expression and/or enzyme activity of genes related to ROS production and protection and their regulation by insulin and antioxidant treatments in skeletal muscle, and 2) by measuring directly H2O2 production on
both isolated mitochondria and total muscle lysates. All together, our findings indicate that activation of mostly mitochondria and XO account for hyperglycaemia-induced production of ROS in diabetic muscle, and demonstrate for the first time a beneficial effect of oxypurinol, a XO inhibitor, on mitochondria alterations in skeletal muscle of both type 1 and type 2 diabetic mice.
Materials and Methods
Animals: Animals were purchased from Harlan (Gannat, France) and housed in a room under controlled temperature and humidity and had free access to water and chow. All animal experiments were conducted in accordance with institutional guidelines for the care and use of laboratory animals, and regional ethic committee has approved protocols.
Experiment 1: Ten week-old male C57Bl/6 mice (n=32) were given daily (at 9 hour a.m.) an
ip dose of streptozotocin dissolved in sodium citrate buffer (STZ, 100 mg/kg body weight,
Sigma), for 3 consecutive days. The control group (Co, n=16) was injected with sodium citrate buffer. Glucose levels were monitored daily and when STZ mice achieved fed glucose levels >500 mg/dl for 3 consecutive days (day 11), they were separated into two groups (n=16/group). One group was injected with saline solution and the second was treated with insulin (Insulatard®, 3mU), twice daily at 8-hour intervals. Twenty-four hours after the first injection of insulin, all animals were sacrificed and blood was collected and gastrocnemius muscles were removed and frozen in liquid nitrogen.
Experiment 2: Another group of Co (n=10) and STZ mice (n=30) were made as described above. At day 8, STZ mice were separated in three groups (n=10/group). One group was untreated, the second one was treated with the general antioxidant N-acetyl-cysteine (NAC, 10 g/l in the drinking water) and the third group was treated with oxypurinol (OXY, an inhibitor of xanthine oxidase, 1mM in the drinking water) until day 12. The concentration of oxypurinol was previously shown to inhibit XO (35). Fresh solutions were made each 48 hours. At day 12, all mice were sacrificed and blood was collected and gastrocnemius muscles were removed and frozen in liquid nitrogen.
Experiment 3: Male C57BL/6 mice at 4 weeks were fed with a standard diet (SD, 57% carbohydrate, 5% fat, 18% protein, Harlan) or with a pelleted high-fat and high-sucrose diet
(HFHSD) (36% fat, 35% carbohydrate (50% sucrose), and 19.8% protein; TD99249, Harlan) during 16 consecutive weeks. One group of HFHSD mice was treated with oxypurinol (1mM in the drinking water) during all the feeding period. During the last week of protocol, ip glucose and insulin tolerance tests (IPGTT and IPITT, respectively) were performed on 8h-fasted mice. Mice were injected ip with 2 mg/g body weight of glucose or 0.75mU/g body weight of insulin. Blood was taken by tail puncture immediately before and different times after injection for measurements of plasma glucose. At the end of the protocol, mice were sacrificed, blood was collected at the fed state and gastrocnemius muscles were fixed for electronic microscopy analysis.
Measurement of metabolites and hormones: Blood glucose levels were measured using a glucometer (Roche Diagnostics, Meylan, France). Serum levels of insulin were determined using the murine ELISA kits (Linco Research, Missouri, USA). Plasma H2O2 levels were
measured using an Amplex Red hydrogen peroxide assay kit (Invitrogen, Cergy Pontoise, France). Specificity of the signal for H2O2 was confirmed by treating plasma with
polyethylene glycol catalase (100U/ml).
Real time quantitative RT-PCR analysis: Total RNA was extracted with the Trizol Reagent (Invitrogen, Cergy Pontoise, France). The level of target mRNAs were measured by RT followed by real-time PCR,using a LightCycler (Roche Diagnostics, Meylan, France). Primer sequences are listed in Table S1. We measured hypoxanthine guanine phosphoribosyl transferase (HPRT) mRNA as a reference gene, so that the results are expressed asa ratio referred to the expression of HPRT.
Protein carbonylation: The Oxyblot Oxidized Protein Detection Kit was purchased from Chemicon (Hampshire, UK). The carbonyl groups in the protein side chains are derivatized to DNP-hydrazone by reaction with DNPH, following the manufacturer’s instructions. After the derivatization of the protein sample (20µg), one dimensional electrophoresis was carried out on a 10% SDS-PAGE gel. Proteins were transferred to PVDF-membranes. After incubation with anti-DNP antibody, the blot was developed using a chemiluminescence’s detection system. After transfers, the gels were stained with coomassie blue to verify protein loading. These gels were scanned and the intensity of each line allowed the normalization of the densitometry analysis of carbonylated proteins.
Measurement of enzymes activities: Xantine oxidase activity was measured using the Amplex Red Xantine Oxidase assay kit from Molecular Probes (Molecular Probes, MP22182), according to the instructions of manufacturer. NOS activity was measured using the Ultrasensitive colorimetric assay for Nitric Oxide Synthase from Euromedex (Euromedex, NB78), according to the instructions of manufacturer. NAD(P)H oxidase activity was measured according to the protocol of Iverson et al (Iverson D, et al., JCI 1977). Briefly, 200µg of skeletal muscle proteins were incubated 60 min at 37°C in a 100µ L volume containing 0.1M potassium phosphate buffer pH5.5, 2mM KCN and 200µM NAD(P)H. The incubation was stopped by the addition of 0.4N HClO4 and proteins were removed by
centrifugation. 40µ L of the resulting supernatant was added to 60µ L of NaOH 10N and allowed to incubate for 1h at room temperature. 100µ L of water was added to each sample and fluorescence was measured in a fluorimeter equipped with a 355 nm primary filter and a 460 nm secondary filter.
Muscle lysates and isolation of muscle mitochondria: Gastrocnemius and quadriceps muscles were quickly removed and placed in ice-cold lysis medium (100mM sucrose, 50 mM KCl, 5 mM EGTA, and 50 mM Tris/HCl, ph 7.4). Muscles were cleaned of extracellular fat and connective tissue, minced with scissors and used either for muscle lysates (right limb) or for isolation of mitochondria (left limb). For lysates, muscle was homogenized in 1.5 ml of lysis medium and centrifuged at 800 g for 10 minutes. For isolation of mitochondria, muscle was cut in small pieces in isolation buffer (Mannitol 210mM, Saccharose 70mM, Tris 50mM, EDTA 10mM and BSA 0.5%, pH=7.4). Then, it was digested 15 minutes with trypsin, under agitation, and washed 2 times with the isolation buffer. After each wash, the tissue was centrifuged two minutes, at 70g. The tissue was homogenized with a conical glass grinder (VWR International) in isolation buffer. The homogenate was centrifuged 10 minutes at 820g. Then the supernatant was centrifuged 20 minutes at 6800g. The pellet was resuspended in suspension buffer (Mannitol 225mM, Saccharose 75mM, Tris 10mM, and EDTA 0.1mM, pH=7.4) and centrifuged 10 minutes at 820g. The mitochondria were then pelleted by centrifuging the supernatant 20min at 6800g, and resuspended in 100µl of the same buffer. Protein quantification of muscle lysates and isolated mitochondria was measured by the Biuret method with BSA as standard.
Mitochondrial H2O2 production: Generation of mitochondrial H2O2 was determined on an
SFM25 computer-controlled Kontron fluorometer by measuring the linear increase in fluorescence (excitation at 560 nm, emission at 584 nm) due to enzymatic oxidation of amplex Red by H2O2 in the presence of horseradish peroxidase. Mitochondria (0.1 mg/ml)
were incubated at 30 °C in a buffer containing 125 mM KCl, 20 mM Tris-HCl, 1 mM EGTA, 0.15% fat free BSA (pH 7.2) and containing 6 U/ml of horseradish peroxidase and 1 µM
was measured in basal conditions, and 2 M rotenone and 2 M antimycin A were sequentially added to determine the maximum rate of H2O2 production of complexes I and I+III of the
respiratory chain, respectively. To verify the specificity of the Amplex Red reaction with H2O2, catalase (100U/ml) was also added to mitochondria.
Xanthine oxidase-mediated H2O2 production: Generation of H2O2 by the xanthine oxidase
was determined in the same conditions as in mitochondrial H2O2 production. Muscle Lysates
(100 µl) were incubated at 30 °C in a buffer containing 125 mM KCl, 20 mM Tris-HCl, 1 mM EGTA, 0.15% fat free BSA (pH 7.2) and containing 6 U/ml of horseradish peroxidase and 1 µM Amplex Red. The H2O2 production was measured in the basal state and the reaction
was started by the addition of xanthine (1.5 µM). Lastly, Allopurinol (100 µM), a XO inhibitor, was added to demonstrate the implication of xanthine oxidase in the measured H2O2
production.
Measurement of ATP synthesis: ATP synthesis by isolated mitochondria from skeletal muscle was measured according to the protocol of Vives-Bauza C et al (44). Briefly, freshly isolated mitochondria were diluted in 160µ L of a specific buffer (150 mM Kcl, 25 mM Tris-Hcl, 2 mM EDTA, 0,1% BSA, 10 mM potassium phosphate, pH 7,4) containing P1,P5-di(adenosine) pentaphosphate (0.15 mM). Luciferin, Luciferase, ADP, and either malate plus pyruvate (to 1mM) or succinate (to 5 mM) plus 2µg/mL rotenone were added to the mitochondria suspension. Measurements of ATP synthesis were performed using a luminometer, which allow recordings in the kinetic mode. To obtain baseline fluorescence corresponding to nonmitochondrial ATP production, one replicate tube for each sample was prepared containing the components described above plus 1µg/mL oligomycin.
Transmission electron microscopy: Transmission electron microscopy on skeletal muscle was performed as previously described (5). Briefly, gastrocnemius muscle was cut into small pieces and fixed in 2% glutaraldehyde for 2h at 4°C, postfixed in 1% Osmium tetroxide for 1h at 4°C, dehydrated and embedded in Epon at eitheir a longitudinal or transverse orientation. The tissue was then cut using a RMC/MTX ultramicrotome (Elexience) and ultrathin sections (60-80nm) were mounted on copper grids, contrasted with 8% uranyl acetate and lead citrate, and observed with a Jeol 1200 EX transmission electron microscope (Jeol LTD) equipped with MegaView II high resolution TEM camera. Analysis was performed with Soft Imaging System (Eloïse SARL).
Statistical analysis: Two-way ANOVA was used to analyze the differences between experimental groups. P<0.05 was considered to be significant.
Results
Increased oxidative stress in skeletal muscle of STZ mice.
To determine whether oxidative stress takes place in skeletal muscle in diabetic state, we analyzed STZ-induced diabetic mice, as a model of hyperglycaemia-associated oxidative stress without obesity. In addition, we examined the effect of acute insulin treatment (in order to reduce hyperglycaemia) on systemic and muscle oxidative stress in STZ mice. As shown in Table 1, STZ mice exhibited decreased body weight (20%, p<0.001), severe hyperglycaemia (225%, p<0.001), hypoinsulinemia (77.5%, p<0.001) and increased plasma H2O2 levels
(121%, p<0.001), demonstrating type 1 diabetes-associated systemic oxidative stress. The specificity of H2O2 measurement in plasma was validating using catalase, which inhibits the
amplex red signal (data not shown). Insulin treatment of STZ mice increased body weight (12%, p<0.01), decreased glucose levels (19%, p<0.001), and significantly reduced plasma H2O2 levels (-38%, p<0.05), compared to untreated STZ mice.
As a marker of muscle oxidative stress, we measured total protein carbonylation levels in gastrocnemius muscle of control, untreated STZ mice, and insulin-treated STZ mice. As illustrated in Figure 1A, protein carbonylation is markedly increased in skeletal muscle of STZ mice compared to control mice, suggesting an oxidative stress in muscle of diabetic mice. Insulin treatment reduced protein carbonylation in skeletal muscle of STZ mice, compared to untreated STZ mice, suggesting a reduction of ROS production and/or an increase of antioxidant defences, in muscle of insulin-treated STZ mice.
Next, we evaluated ROS activity and their production sites. We first measured changes in mRNA levels of oxidant and antioxidant enzymes, in skeletal muscle of mice. Concerning pro-oxidant enzymes, we measured the mRNA levels of 1) uncoupling proteins (UCP) 2 and 3, as markers of mitochondria-mediated ROS production, 2) gp91, p22, p40, p47 and p67
subunits of NADPH oxidase, 3) xanthine oxidase (XO) and 4) the endothelial (NOS3) and neuronal (NOS1) NO synthase, as an index of RNS production. We found that UCP2, UCP3, and XO mRNA levels were significantly increased in skeletal muscle of STZ mice compared to control mice, whereas none of the subunit of NADPH oxidase, as well as NOS1 and NOS3 were altered (Figure 1B), suggesting that ROS production in skeletal muscle of diabetic mice may mainly implicate mitochondria and XO. Insulin treatment restored the mRNA levels of UCP2 (p<0.05) and UCP3 (p=0.06), whereas expression of XO was not affected compared to untreated STZ mice. Concerning antioxidant enzymes, we investigated expression levels of enzymes implicated either in the reduction of superoxide (superoxide dismutase 2, SOD2) or in the detoxification of hydrogen peroxide (glutathione reductase (GSR), glutathione peroxidase (GPx), catalase, pioredoxine (Prdx) 3 and 5). STZ-induced diabetic mice exhibited increased mRNA levels of GSR and CAT, and reduced expression of SOD2 in skeletal muscle, whereas Prdx3, Prdx5, and GPx expression were not altered (Figure 1B). Insulin treatment restored catalase mRNA levels, whereas GSR expression was not affected, compared to untreated STZ mice (Figure 1B). In addition, insulin further reduced SOD2 expression in skeletal muscle of STZ mice (Figure 1B).
Then, we measured enzyme activities of pro-oxidant enzymes. As shown in Figure 2A, XO activity was significantly increased in skeletal muscle of STZ mice compared to Co mice (35%, p<0.01), whereas neither NADPH oxidase nor NOS activities were modified. Insulin treatment did not modify any of these activities (Figure 2A).
All together, these results indicate that there is an increase of oxidative stress markers in skeletal muscle of STZ-induced diabetic mice, which could be mediated either by an increase of mitochondria and XO-mediated ROS production and/or by a reduction of some antioxidant enzymes (SOD2).
Increased mitochondria and xanthine oxidase-mediated H2O2 production in STZ mice.
To confirm the implication of mitochondria in hyperglycaemia-induced ROS production, we measured succinate-induced H2O2 production by isolated muscle mitochondria
of control, untreated and insulin-treated STZ mice (n=6), in nonphosphorylated conditions (33). We have validated the specificity for H2O2 measurement by demonstrating that the
addition of catalase inhibited the Amplex Red signal (data not shown). As shown in Figure 2B, succinate (providing FADH2 to complex II of electron transfer chain) induced H2O2
production by control mitochondria (+25 fold, p<0.01), and this production is drastically inhibited by rotenone (-84%, p<0.01), suggesting that it is mainly due to an enhanced ROS generation through a reverse electron flow at the level of complex I of the respiratory chain. Then, addition of antimycin A modestly induced H2O2 production, compared to that measured
with rotenone (Figure 2B), indicating a weak implication of complex III in H2O2 production
energized with succinate. Interestingly, the rate of H2O2 production by STZ mice derived
mitochondria was significantly higher than from control mice (+164%, p<0.05, Figure 2B), indicating an increase of mitochondrial H2O2 production in skeletal muscle of STZ mice.
Insulin treatment of the mice tended to reduce mitochondria H2O2 production energized with
succinate (-65%, p=0.07, Figure 2B).
To confirm the implication of XO in hyperglycaemia-induced ROS production, we accessed xanthine-stimulated H2O2 production on total muscle lysates of control, untreated
and insulin-treated STZ mice (n=6). As shown in Figure 2C, xanthine induced H2O2
production by control muscle lysates (1.6 fold, p<0.05), and this production is totally inhibited by addition of allopurinol (p<0.01), confirming the involvement of XO in the measured H2O2 production. Interestingly, the rate of xanthine-induced H2O2 production by
STZ muscle lysates was significantly higher than in muscle lysates from control mice (+45%, p<0.05, Figure 2C), suggesting that XO participate to the increase of ROS production in
skeletal muscle of STZ mice. Once again, insulin treatment tended to reduce xanthine-induced H2O2 production compared to untreated STZ mice (-87%%, p=0.06, Figure 2C).
Taken together, our results indicate that both complex I of mitochondria and XO contribute to increased H2O2 production in skeletal muscle of hyperglycaemic STZ mice.
Inhibition of XO by oxypurinol treatment reduces oxidative stress in STZ mice
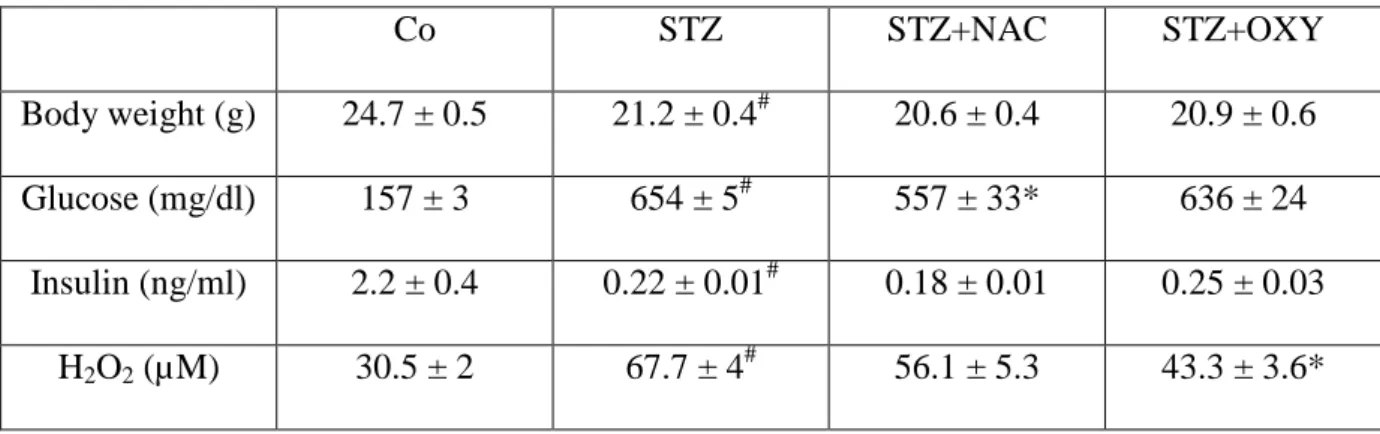
We then sought to determine whether inhibition of XO could improve oxidative stress in skeletal muscle of diabetic mice in vivo. STZ mice were treated with oxypurinol (1mM) during 7 consecutives days and measured the consequences on systemic and muscle oxidative stress markers. In parallel, another group was treated with a general antioxidant, the N-Acetylcysteine (10 g/l). The metabolic data of the animals were presented in Table 2. Oxypurinol treatment reduced circulating H2O2 (-36%, p<0.01), without change on plasma
glucose and insulin levels, compared to untreated STZ mice (Table 2). NAC-treated STZ mice showed an improvement of glycaemia (21%, p<0.05), without significant change of circulating insulin and H2O2 levels, compared to untreated STZ mice (Table 2). Concerning
muscle oxidative stress, treatment of STZ mice with oxypurinol reduced muscle protein carbonylation levels (-30%, p<0.05), compared to untreated STZ mice (Figure 3A). Similarly, NAC treatment decreased protein carbonylation levels compared to untreated STZ mice (Figure 4A). In addition, mRNA levels of almost all oxidant and antioxidant enzymes were poorly regulated by both antioxidants (Figure 3B and 4B). We only observed a decrease of mRNA levels of p22 and p40 subunits of NAD(P)H oxidase and of GSR, in oxypurinol-treated STZ compared to unoxypurinol-treated STZ mice (Figure 3B). All together, these results show that inhibition of XO by oxypurinol is sufficient to improve circulating and muscular oxidative stress markers in STZ-induced diabetic mice.
Treatment of STZ mice with oxypurinol improved mitochondria structure and function. We have previously demonstrated that oxidative stress in hyperglycaemic STZ mice is associated with altered mitochondria structure and function in skeletal muscle and that NAC treatment restored mitochondrial alterations (5). Since we demonstrated here that XO is implicated in hyperglycemia-associated muscle oxidative stress, we investigated whether oxypurinol treatment could also have a beneficial effect on mitochondria structure and density. First, we confirmed that oxypurinol specifically inhibited XO activity in skeletal muscle of STZ mice, whereas NADPH and NOS activities were not modified by oxypurinol treatment (Figure 5). Then, we analyzed by electronic microscopy the structure and density of mitochondria in muscle of Co, untreated STZ, and oxypurinol-treated STZ mice. As shown in Figure 6, we observed both a reduction of mitochondria density as well as important alterations of both subsarcolemmal and intermyofibrillar mitochondria structure in skeletal muscle of STZ mice compared to Co mice. These alterations included mitochondria swelling, an increased number of disarrayed cristae and a reduced electron density of the matrix. Interestingly, oxypurinol treatment improved these structural alterations, since we observed an increase of mitochondria number per section and a restoration of both cristae structure and electron density of the matrix (Figure 6), suggesting a role of XO in mitochondrial alterations in muscle of STZ mice.
We then measured ATP production by isolated mitochondria in order to access mitochondria function in muscle of untreated and oxypurinol-treated STZ mice. As shown in Figure 7, ATP production mediated by succinate in presence of rotenone is reduced in muscle of STZ mice compared to Co mice (-30%, p<0.05), whereas ATP production mediated by complex I substrates (glutamate + malate) was not modified. Interestingly, oxypurinol treatment restored succinate-induced ATP production in muscle of STZ mice (Figure 7).
All together, these data indicate that reduction of XO activity improves mitochondria structure and function in muscle of STZ mice.
Effect of oxypurinol treatment in diet-induced diabetic mice.
To determine whether oxypurinol treatment could also be beneficial for mitochondrial alterations in a model of type 2 diabetes, we investigated mitochondria structure in standard diet fed mice (SD), high-fat and high-sucrose diet fed mice (HFHSD), and in oxypurinol-treated HFHSD mice, during 16 weeks. Metabolic characteristics of these mice were shown in Table 3. HFHSD feeding induced clearly an obese and diabetic phenotype compared to SD mice, since HFHSD mice weighted 18 g more, were hyperglycaemic and hyperinsulinemic (Table 3) and showed altered response to glucose and insulin tolerance tests (Table 3). In addition, circulating H2O2 levels are increased in HFHSD mice compared to SD mice (Table
3). Treatment of HFHSD mice with oxypurinol did not modify body weight, glycaemia and insulinemia, and response to glucose and insulin tolerance tests. Nevertheless, oxypurinol treatment reduced plasma H2O2 levels in HFHSD mice, compared to untreated mice (Table 3).
As previously described (5), HFHSD mice showed altered mitochondria structure compared to SD mice, as demonstrated by the reduction and the swelling of both subsarcolemmal and intermyofibrillar mitochondria, associated with the increased number of disarrayed cristae and the reduced electron density of the matrix (Figure 8). Interestingly, oxypurinol treatment improved these alterations in muscle of HFHSD mice (Figure 8), confirming the preventive effect of blocking XO-mediated ROS production on mitochondria structure in diet-induced diabetic mice.
Discussion
Hyperglycaemia-induced systemic oxidative stress is a classical feature of diabetes. In addition, we have recently demonstrated that oxidative stress is one of the culprits of mitochondrial dysfunction in skeletal muscle of both STZ and diet-induced diabetic mice (5). However, whether muscle ROS generation is really increased and the intrasubcellular sources of production in diabetic states are poorly known. The purpose of our study was to investigate this issue in STZ-induced diabetic mice, which share similar oxidative stress-induced mitochondrial alterations than diet-induced diabetic mice, in order to identify the main sources of hyperglycemias-induced ROS production in skeletal muscle. Then, specific antioxidant strategies were tested in both models in order to study the repercussions on mitochondria alterations in skeletal muscle of diabetic mice.
In the present study, we used STZ-induced diabetic mice as a classical model of hyperglycaemia-induced oxidative stress (39), and we treated these mice with insulin, NAC or oxypurinol in order to prevent this process. S T Z i s u s e d
e x t e n s i v e l y t o i n d u c e
p a n c r e a t i c beta c e l l d e a t h a n d
u l t i m a t e l y d i a b e t e s m e l l i t u s i n a n i m a l m o d e l s . Whereas t h e d i r e c t e f f e c t s o f S T Z o n m u s c l e can not be exclude (21), the comparison of phenotype between STZ and STZ+INS should help to delineate the effects of STZ from the effects of hypoinsulinemia/hyperglycaemia. STZ-treated mice showed hyperglycaemia, hypoinsulinemia and increased systemic and muscular oxidative stress, compared to control mice. Interestingly, insulin treatment decreased both plasma glucose and H2O2 levels and markedly reduced intramuscular protein carbonylation,
suggesting that hyperglycaemia (and not STZ treatment per se) could be directly causal in muscle ROS production. Nevertheless, we cannot exclude that hypoinsulinemia also contributed to increased oxidative stress in STZ mice and that insulin treatment per se participated to reduced oxidative stress in muscle of insulin-treated STZ mice. Indeed, the reduction of hyperglycaemia by insulin treatment is modest in STZ mice, whereas insulin-induced improvement of both circulating and muscle oxidative stress is more marked. We believe that the apparent mild reduction in glycaemia obtained after ip insulin administration in STZ mice reflected transitory action of insulin under our experimental procedure (two administrations of insulin, 24 h and 15 h before sacrifice). Despite the rebound of glycaemia after insulin infusion, muscle protein carbonylation and, more importantly, structure and density of mitochondria were restored (5). These results suggest that in addition to the improvement of glycaemia, specific effects of insulin should be taken into account to explain the reduction of oxidative stress and mitochondria rescue. These observations are in
agreement with recent data demonstrating a beneficial effect of insulin on LPS-induced
oxidative stress independent of any change in glucose concentrations (8). Whereas the
molecular mechanisms by which insulin can reduce oxidative stress require further
investigations, we can already conclude from our study that it does not involve a regulation of
pro-oxidant enzymes activities, since they are not regulated by insulin treatment in muscle of
STZ mice.
Two important points arising from our study are that skeletal muscle of diabetic mice showed increased ROS production and that this production is mediated by both the complex I of mitochondria and XO. This was supported by several independent experiments. Firstly, data on the expression of gene implicated in ROS production and protection, suggest that oxidative stress in STZ mice is more related to an increase of ROS production than a decrease
deregulated in skeletal muscle of STZ mice, except for SOD2 that showed reduced expression. The others are either induced (GSR or catalase) or not regulated (Gpx, prdx3 and prdx5). On the opposite, mRNA levels of UCP2, UCP3 and XO were significantly increased in skeletal muscle of STZ mice, suggesting contribution of mitochondria and XO in ROS production. This was further supported by the increase of XO activity, without modification of both NADP and NOS activities, in skeletal muscle of STZ mice. The final proof was given by the direct measurements of H2O2 production in skeletal muscle of STZ mice. To our
knowledge, there is sparse work directly measuring ROS production in diabetic skeletal muscle, and generally these measurements were performed on isolated mitochondria. Here, we measured H2O2 production by mitochondria, but also we tried to investigate XO-induced
H2O2 production, by measuring xanthine-stimulated H2O2 production on total muscle lysates.
The specificity of XO-related ROS production was confirmed by inhibition with allopurinol, an inhibitor of XO. We observed both an increase of H2O2 production by isolated
mitochondria, and an increase of xanthine-induced H2O2 production in skeletal muscle of STZ
mice compared to control mice, confirming the implication of both pathways in ROS production in skeletal muscle of diabetic mice. Consequently, the increase of both XO expression and activity participate to increased ROS production in skeletal muscle of STZ mice.
It is not surprising that mitochondria was implicated in hyperglycaemia-induced ROS production, since mitochondria were known to be the major site of ROS production in many tissues and in a wide range of pathological conditions (19). Most importantly, our results showed that XO, a key enzyme of purine metabolism, is also a significant cellular source of ROS production in muscle of diabetic mice. Normally, XO activity is low in skeletal muscles (6). However, ROS production by XO is favoured by an accumulation of intracellular ADP (20). Consequently, mitochondrial dysfunction observed in skeletal muscle of STZ mice (5)
may lead to an imbalance of ATP/ADP ratio in the cytosol and an associated increase of XO activity. XO was reported to localize in capillary endothelial cells (17) and in the sarcolemma (15). Consequently, we cannot exclude that part of XO activity arises from endothelial cells. In addition, it was difficult to evaluate whether mitochondria and XO have additive effects on ROS production in vivo since the structure of mitochondria is altered in muscle of STZ. Indeed, we have observed by electron microscopy that purified mitochondria of both control and STZ mice were equally intact (data not shown), suggesting that the most damaged mitochondria were lost during differential centrifugation. Since it is not known whether the most damaged mitochondria can produce or not superoxide, it is not possible to conclude on the relative implication of both sources of ROS in vivo. It is likely that both are implicated but maybe with different kinetics during the development of STZ-induced diabetes. The implication of XO in ROS production by skeletal muscle of diabetic mice are supported by other studies demonstrating either that type 1 diabetes is associated with XO-mediated ROS production in other tissues (9, 30) or that skeletal muscle is able to generate ROS through XO in other physiopathological situations (22, 26, 43).
To assess whether XO could be a potential target to protect against damages associated to oxidative stress in diabetes, we have treated STZ with oxypurinol and measured consequences on systemic and muscular oxidative stress markers. Oxypurinol treatment reduced both circulating H2O2 concentrations and muscle protein carbonylation levels,
confirming the implication of XO in hyperglycaemia-induced ROS production in skeletal muscle of STZ mice. Interestingly, oxypurinol treatment restored structural and functional alterations of mitochondria in skeletal muscle of STZ mice, indicating that XO inhibition could be useful to prevent muscle damage. The expression of XO is not modified by oxypurinol treatment, indicating that the action of the drug only involved inhibition of XO
production, contributing to the observed reduced protein oxidation. Nevertheless, we cannot exclude that the decrease of circulating H2O2 participated to the reduced protein carbonylation
in skeletal muscle of STZ mice. This systemic effect of oxypurinol suggests that XO is also a major source of ROS in vascular cells, confirming previous data (31). Since ROS was implicated in hyperglycemia-induced diabetic complications (7), it is tempting to hypothesize that inhibition of XO could be benefit to improve micro- and macrovascular complications associated with diabetes. Interestingly, we confirmed the beneficial effect of oxypurinol treatment on mitochondrial alterations in skeletal muscle of diet-induced diabetic mice, a model of type 2 diabetes. This preventive effect was not accompanied by change neither in plasma glucose or insulin levels, nor in response to IPGGT and IPITT, suggesting that improvement of mitochondria integrity by oxypurinol is not sufficient to improve insulin sensitivity in HFHSD mice. Since diet-induced diabetic mice have a more complex metabolic phenotype, with an increase of both circulating and ectopic lipid levels and of inflammation, it is likely that other pro-oxidant enzymes (11) and/or other stress-activated pathways are always activated, and participate to the maintain of insulin resistance. Nevertheless, this result is an additional argument claiming that mitochondrial dysfunction is not a causal event of insulin resistance (14, 37, 42, 45). Nevertheless, by promoting intramuscular lipid accumulation, mitochondrial dysfunction could participate to the maintenance or to the exacerbation of impaired insulin sensitivity. Consequently, our data suggest that the inhibition of XO should be a useful strategy to improve mitochondrial alterations, in order to stimulate oxidative capacities and to reduce lipotoxicity. In agreement, XO activity is induced in type 2 diabetic patients (25). Interestingly, allopurinol is classically used in clinic to treat gout, and patients who are affected by gout show increased circulating uric acid levels and a predisposition to metabolic syndrome (40). Nevertheless, further studies are needed to confirm whether the inhibition of XO may have benefits for diabetic patients.
In summary, the present study demonstrates that there is a hyperglycaemia-induced oxidative stress in skeletal muscle of diabetic mice, which results more from an increase of free radicals production rates than a reduction of endogenous antioxidants levels. In addition, our data provide in vivo evidences for the contribution of both mitochondria and XO to muscle oxidative stress in state of diabetes. The implication of XO is significant since oxypurinol treatment is able to reduce protein oxidation and improve mitochondrial alterations in both type 1 and type 2 models of diabetic mice. Consequently, XO might be a potential therapeutic target for decreasing muscle damages associated with oxidative stress, and more particularly, for improving oxidative capacities of muscle in diabetic states.
Acknowledgements
We thank the imagery center of Laennec Faculty and the IFR62 for access tot the platforms.
Grants
This work was supported by grants of INSERM, National Program on Diabetes Research and the “Agence Nationale de la recherche” (grant to J.R., n°ANR-09-JCJC-0116-01). C.B. received a fellowship from Rhônes-Alpes Region. A.B. received a fellowship from Servier Laboratories (Suresnes, France).
References
1. Apple FS, Hyde JE, Ingersoll-Stroubos AM, and Theologides A. Geographic distribution of xanthine oxidase, free radical scavengers, creatine kinase, and lactate dehydrogenase enzyme systems in rat heart and skeletal muscle. Am J Anat 192: 319-323, 1991.
2. Balon TW, and Nadler JL. Nitric oxide release is present from incubated skeletal muscle preparations. J Appl Physiol 77: 2519-2521, 1994.
3. Barja G. Mitochondrial oxygen radical generation and leak: sites of production in states 4 and 3, organ specificity, and relation to aging and longevity. J Bioenerg Biomembr 31: 347-366, 1999.
4. Beckman JS, and Koppenol WH. Nitric oxide, superoxide, and peroxynitrite: the good, the bad, and ugly. Am J Physiol 271: C1424-1437, 1996.
5. Bonnard C, Durand A, Peyrol S, Chanseaume E, Chauvin MA, Morio B, Vidal H, and Rieusset J. Mitochondrial dysfunction results from oxidative stress in the skeletal muscle of diet-induced insulin-resistant mice. J Clin Invest 118: 789-800, 2008.
6. Borges F, Fernandes E, and Roleira F. Progress towards the discovery of xanthine oxidase inhibitors. Curr Med Chem 9: 195-217, 2002.
7. Brownlee M. Biochemistry and molecular cell biology of diabetic complications.
Nature 414: 813-820, 2001.
8. Dandona P, Ghanim H, Bandyopadhyay A, Korzeniewski K, Ling Sia C, Dhindsa S, and Chaudhuri A. Insulin suppresses endotoxin-induced oxidative, nitrosative, and inflammatory stress in humans. Diabetes care 33: 2416-2423.
9. Desco MC, Asensi M, Marquez R, Martinez-Valls J, Vento M, Pallardo FV, Sastre J, and Vina J. Xanthine oxidase is involved in free radical production in type 1 diabetes: protection by allopurinol. Diabetes 51: 1118-1124, 2002.
10. Espinosa A, Leiva A, Pena M, Muller M, Debandi A, Hidalgo C, Carrasco MA, and Jaimovich E. Myotube depolarization generates reactive oxygen species through NAD(P)H oxidase; ROS-elicited Ca2+ stimulates ERK, CREB, early genes. J Cell Physiol 209: 379-388, 2006.
11. Feillet-Coudray C, Sutra T, Fouret G, Ramos J, Wrutniak-Cabello C, Cabello G, Cristol JP, and Coudray C. Oxidative stress in rats fed a high-fat high-sucrose diet and preventive effect of polyphenols: Involvement of mitochondrial and NAD(P)H oxidase systems. Free radical biology & medicine 46: 624-632, 2009.
12. Furukawa S, Fujita T, Shimabukuro M, Iwaki M, Yamada Y, Nakajima Y, Nakayama O, Makishima M, Matsuda M, and Shimomura I. Increased oxidative stress in obesity and its impact on metabolic syndrome. J Clin Invest 114: 1752-1761, 2004.
13. Hegarty BD, Furler SM, Ye J, Cooney GJ, and Kraegen EW. The role of intramuscular lipid in insulin resistance. Acta Physiol Scand 178: 373-383, 2003.
14. Hoeks J, van Herpen NA, Mensink M, Moonen-Kornips E, van Beurden D, Hesselink MK, and Schrauwen P. Prolonged fasting identifies skeletal muscle mitochondrial dysfunction as consequence rather than cause of human insulin resistance.
Diabetes.
15. Ibrahim B, and Stoward PJ. The histochemical localization of xanthine oxidase.
Histochem J 10: 615-617, 1978.
16. Jackson MJ, Pye D, and Palomero J. The production of reactive oxygen and nitrogen species by skeletal muscle. J Appl Physiol 102: 1664-1670, 2007.
17. Jarasch ED, Grund C, Bruder G, Heid HW, Keenan TW, and Franke WW. Localization of xanthine oxidase in mammary-gland epithelium and capillary endothelium.
Cell 25: 67-82, 1981.
18. Javesghani D, Magder SA, Barreiro E, Quinn MT, and Hussain SN. Molecular characterization of a superoxide-generating NAD(P)H oxidase in the ventilatory muscles. Am
J Respir Crit Care Med 165: 412-418, 2002.
19. Jezek P, and Hlavata L. Mitochondria in homeostasis of reactive oxygen species in cell, tissues, and organism. Int J Biochem Cell Biol 37: 2478-2503, 2005.
20. Ji LL. Antioxidants and oxidative stress in exercise. Proc Soc Exp Biol Med 222: 283-292, 1999.
21. Johnston AP, Campbell JE, Found JG, Riddell MC, and Hawke TJ. Streptozotocin induces G2 arrest in skeletal muscle myoblasts and impairs muscle growth in vivo. American journal of physiology 292: C1033-1040, 2007.
22. Judge AR, and Dodd SL. Oxidative damage to skeletal muscle following an acute bout of contractile claudication. Atherosclerosis 171: 219-224, 2003.
23. Kelley DE, He J, Menshikova EV, and Ritov VB. Dysfunction of mitochondria in human skeletal muscle in type 2 diabetes. Diabetes 51: 2944-2950, 2002.
24. Kraegen EW, and Cooney GJ. Free fatty acids and skeletal muscle insulin resistance. Curr Opin Lipidol 19: 235-241, 2008.
25. Kuppusamy UR, Indran M, and Rokiah P. Glycaemic control in relation to xanthine oxidase and antioxidant indices in Malaysian Type 2 diabetes patients. Diabet Med 22: 1343-1346, 2005.
26. Lambertucci RH, Levada-Pires AC, Rossoni LV, Curi R, and Pithon-Curi TC. Effects of aerobic exercise training on antioxidant enzyme activities and mRNA levels in soleus muscle from young and aged rats. Mech Ageing Dev 128: 267-275, 2007.
27. Loschen G, Azzi A, Richter C, and Flohe L. Superoxide radicals as precursors of mitochondrial hydrogen peroxide. FEBS Lett 42: 68-72, 1974.
28. Lowell BB, and Shulman GI. Mitochondrial dysfunction and type 2 diabetes. Science 307: 384-387, 2005.
29. Maiese K, Morhan SD, and Chong ZZ. Oxidative stress biology and cell injury during type 1 and type 2 diabetes mellitus. Curr Neurovasc Res 4: 63-71, 2007.
30. Matsumoto S, Koshiishi I, Inoguchi T, Nawata H, and Utsumi H. Confirmation of superoxide generation via xanthine oxidase in streptozotocin-induced diabetic mice. Free
Radic Res 37: 767-772, 2003.
31. McNally JS, Davis ME, Giddens DP, Saha A, Hwang J, Dikalov S, Jo H, and Harrison DG. Role of xanthine oxidoreductase and NAD(P)H oxidase in endothelial superoxide production in response to oscillatory shear stress. Am J Physiol Heart Circ Physiol 285: H2290-2297, 2003.
32. Meugnier E, Faraj M, Rome S, Beauregard G, Michaut A, Pelloux V, Chiasson JL, Laville M, Clement K, Vidal H, and Rabasa-Lhoret R. Acute hyperglycemia induces a global downregulation of gene expression in adipose tissue and skeletal muscle of healthy subjects. Diabetes 56: 992-999, 2007.
33. Molnar AM, Servais S, Guichardant M, Lagarde M, Macedo DV, Pereira-Da-Silva L, Sibille B, and Favier R. Mitochondrial H2O2 production is reduced with acute and chronic eccentric exercise in rat skeletal muscle. Antioxid Redox Signal 8: 548-558, 2006. 34. Mootha VK, Lindgren CM, Eriksson KF, Subramanian A, Sihag S, Lehar J, Puigserver P, Carlsson E, Ridderstrale M, Laurila E, Houstis N, Daly MJ, Patterson N,
35. Naumova AV, Chacko VP, Ouwerkerk R, Stull L, Marban E, and Weiss RG. Xanthine oxidase inhibitors improve energetics and function after infarction in failing mouse hearts. Am J Physiol Heart Circ Physiol 290: H837-843, 2006.
36. Patti ME, Butte AJ, Crunkhorn S, Cusi K, Berria R, Kashyap S, Miyazaki Y, Kohane I, Costello M, Saccone R, Landaker EJ, Goldfine AB, Mun E, DeFronzo R, Finlayson J, Kahn CR, and Mandarino LJ. Coordinated reduction of genes of oxidative metabolism in humans with insulin resistance and diabetes: Potential role of PGC1 and NRF1.
Proc Natl Acad Sci U S A 100: 8466-8471, 2003.
37. Pospisilik JA, Knauf C, Joza N, Benit P, Orthofer M, Cani PD, Ebersberger I, Nakashima T, Sarao R, Neely G, Esterbauer H, Kozlov A, Kahn CR, Kroemer G, Rustin P, Burcelin R, and Penninger JM. Targeted deletion of AIF decreases mitochondrial oxidative phosphorylation and protects from obesity and diabetes. Cell 131: 476-491, 2007. 38. Rosen P, Nawroth PP, King G, Moller W, Tritschler HJ, and Packer L. The role of oxidative stress in the onset and progression of diabetes and its complications: a summary of a Congress Series sponsored by UNESCO-MCBN, the American Diabetes Association and the German Diabetes Society. Diabetes Metab Res Rev 17: 189-212, 2001.
39. Sano T, Umeda F, Hashimoto T, Nawata H, and Utsumi H. Oxidative stress measurement by in vivo electron spin resonance spectroscopy in rats with streptozotocin-induced diabetes. Diabetologia 41: 1355-1360, 1998.
40. Suzuki I, Yamauchi T, Onuma M, and Nozaki S. Allopurinol, an inhibitor of uric acid synthesis--can it be used for the treatment of metabolic syndrome and related disorders?
Drugs Today (Barc) 45: 363-378, 2009.
41. Talior I, Yarkoni M, Bashan N, and Eldar-Finkelman H. Increased glucose uptake promotes oxidative stress and PKC-delta activation in adipocytes of obese, insulin-resistant mice. Am J Physiol Endocrinol Metab 285: E295-302, 2003.
42. Toledo FG, Menshikova EV, Azuma K, Radikova Z, Kelley CA, Ritov VB, and Kelley DE. Mitochondrial capacity in skeletal muscle is not stimulated by weight loss despite increases in insulin action and decreases in intramyocellular lipid content. Diabetes 57: 987-994, 2008.
43. Vina J, Gimeno A, Sastre J, Desco C, Asensi M, Pallardo FV, Cuesta A, Ferrero JA, Terada LS, and Repine JE. Mechanism of free radical production in exhaustive exercise in humans and rats; role of xanthine oxidase and protection by allopurinol. IUBMB Life 49: 539-544, 2000.
44. Vives-Bauza C, Yang L, and Manfredi G. Assay of mitochondrial ATP synthesis in animal cells and tissues. Methods in cell biology 80: 155-171, 2007.
45. Wredenberg A, Freyer C, Sandstrom ME, Katz A, Wibom R, Westerblad H, and Larsson NG. Respiratory chain dysfunction in skeletal muscle does not cause insulin resistance. Biochem Biophys Res Commun 350: 202-207, 2006.
FIGURE LEGENDS
Figure 1:Increased oxidative stress in skeletal muscle of STZ mice and improvement by insulin treatment. Control or STZ-induced diabetic mice were studied 12 days after the first injection of sodium citrate buffer or STZ, and insulin was injected to STZ mice, twice at 8 hours of interval, during the last 24 hours of the protocol. A: A representative immunoblot showing total protein carbonylation in the gastrocnemius muscle of control (Co), streptozotocin-induced diabetic mice (STZ) and insulin-treated STZ mice (STZ+INS). At the right side, densitometry analysis of protein carbonylation, which are expressed relative to Co mice. Values are means ± sem (n=3). * p<0.05 vs. Co, $ p<0.05 vs. STZ. B: mRNA levels of oxidant and antioxidant enzymes, measured by real-time RT-PCR, in gastrocnemius muscle of Co, STZ and STZ+INS mice. Values are normalized to the levels of HPRT mRNA and expressed as relative amount compared to control mice. Data are expressed as means ± sem (n=6-10). * p<0.05 vs. Co. $ p<0.05 vs. STZ.
Figure 2: Increased xanthine oxidase activity and increased H2O2 production mediated
by mitochondria and xanthine oxidase in skeletal muscle of STZ mice. Control or STZ-induced diabetic mice were studied 12 days after the first injection of sodium citrate buffer or STZ, and insulin was injected to STZ mice, twice at 8 hours of interval, during the last 24 hours of the protocol. A: Xanthine oxidase (XO), NADPH oxidase and No synthase (NOS) activities measured in muscle lysates of control (Co), streptozotocin-induced diabetic mice (STZ) and insulin-treated STZ mice (STZ+INS). Values are the means ± sem (n=5). * p<0.01 vs Co mice. B: Mitochondrial H2O2 release by skeletal muscle of Co, STZ and STZ+INS
mice. Values are the means ± sem (n=6). * p<0.01 vs. basal H2O2 release. # p< 0.01 vs.
by skeletal muscle of Co, STZ and STZ+INS mice. Values are the means ± sem (n=6). * p<0.005 vs. basal H2O2 release. # p< 0.01 vs. Xanthine. $ p< 0.05 STZ mice vs. control mice.
Figure 3: Treatment of STZ mice with oxypurinol improved oxidative stress in skeletal muscle. Control or STZ-induced diabetic mice were studied 12 days after the first injection of sodium citrate buffer or STZ, and oxypurinol was added to drinking water of STZ mice during the last 5 days of the protocol. A: A representative immunoblot showing total protein carbonylation in the gastrocnemius muscle of control (Co), Streptozotocin-induced diabetic mice (STZ) and oxypurinol-treated STZ mice (STZ+OXY). At the right side, densitometry analysis of protein carbonylation, which are expressed relative to Co mice. Values are means ± sem (n=3). * p<0.05 vs. Co, $ p<0.05 vs. STZ. B: mRNA levels of oxidant and antioxidant enzymes, measured by real-time RT-PCR, in gastrocnemius muscle of Co, STZ and STZ+OXY mice. Values are normalized to the levels of HPRT mRNA and expressed as relative amount compared to untreated STZ mice. Data are expressed as mean ± sem (n=6-10). * p<0.05, ** p<0.01.
Figure 4: Treatment of STZ mice with NAC improved oxidative stress in skeletal muscle. Control or STZ-induced diabetic mice were studied 12 days after the first injection of sodium citrate buffer or STZ, and N-acetylcystein was added to drinking water of STZ mice during the last 5 days of the protocol. A: A representative immunoblot showing total protein carbonylation in the gastrocnemius muscle of control (Co), Streptozotocin-induced diabetic mice (STZ) and N-acetylcystein-treated STZ mice (STZ+NAC). At the right side, densitometry analysis of protein carbonylation, which are expressed relative to Co mice. Values are means ± sem (n=3). * p<0.05 vs. Co, $ p<0.05 vs. STZ. B: mRNA levels of
of Co, STZ and STZ+NAC mice. Values are normalized to the levels of HPRT mRNA and expressed as relative amount compared to untreated STZ mice. Data are expressed as means ± sem (n=6-10). * p<0.05, ** p<0.01.
Figure 5: Oxypurinol treatment specifically inhibited xanthine oxidase activity in skeletal muscle of STZ mice. Control or STZ-induced diabetic mice were studied 12 days after the first injection of sodium citrate buffer or STZ, and oxypurinol was added to drinking water of STZ mice during the last 5 days of the protocol. Xanthine oxidase (XO), NADPH oxidase and NO synthase activities were measured in muscle lysates of Co, STZ and oxypurinol-treated STZ mice. Values (n=5) are expressed as fold vs. enzyme activity in Co mice.
Figure 6: Oxypurinol treatment restored alterations of mitochondria structure in skeletal muscle of STZ mice. Control or STZ-induced diabetic mice were studied 12 days after the first injection of sodium citrate buffer or STZ, and oxypurinol was added to drinking water of STZ mice during the last 5 days of the protocol. Transmission electron microscopy images (original magnification, x15,000 or x 40,000) of a representative muscle fiber (1st column), and of a zoom on subsarcolemmal (2nd column) and intermyofibrillar (3rd column) mitochondria from the gastrocnemius muscle of control (Co), streptozotocine-induced diabetic mice (STZ) and oxypurinol-treated STZ mice. Arrows point mitochondria swelling, increased disarrayed cristae and reduced electron density of the matrix.
Figure 7: Oxypurinol treatment improved mitochondria function in skeletal muscle of STZ mice. Control or STZ-induced diabetic mice were studied 12 days after the first injection of sodium citrate buffer or STZ, and oxypurinol was added to drinking water of STZ mice
during the last 5 days of the protocol. ATP synthesis was measured on isolated mitochondria from gastrocnemius muscle of control (Co), streptozotocine-induced diabetic mice (STZ) and oxypurinol-treated STZ mice. Values are the means ± sem (n=5). * p<0.05 vs. Co, # p< 0.05 vs. STZ.
Figure 8: Oxypurinol treatment restored alterations of mitochondria structure in skeletal muscle of high fat and high sucrose diet (HFHSD)-induced diabetic mice. Mice were fed either with standard diet (SD) or with high fat and high sucrose diet (HFHSD) during 16 weeks. Oxypurinol was added in the drinking water of HFHSD mice during the 16 week of feeding. Transmission electron microscopy images (original magnification, x15,000 or x 40,000) of a representative muscle fiber (1st column), and of a zoom on subsarcolemmal (2nd column) and intermyofibrillar (3rd column) mitochondria from the gastrocnemius muscle of SD, HFHSD and oxypurinol-tretaed HFHSD mice. Arrows point mitochondria swelling, increased disarrayed cristae and reduced electron density of the matrix.
Tables
Table1: Characteristics of mice (experiment 1). Body weight, glycaemia, insulinemia and plasma H2O2 concentrations of control (Co), untreated streptozotocin-treated mice (STZ), and
insulin (STZ+INS)-treated STZ mice.
Co STZ STZ+INS
Body weight (g) 24.5 ± 0.3 19.6 ± 0.6# 22 ± 0.4**
Glucose (mg/dl) 184 ± 4 598 ± 21# 484 ± 22**
Insulin (ng/ml) 1.2 ± 0.2 0.27 ± 0.03# 13.8 ±3.2**
H2O2 (µM) 34.8 ± 5 77 ± 5# 47.6 ± 4.7*
Data represent the means ± sem of 16 mice per group. # p<0.001 vs Co mice
Table 2: Characteristics of mice (experiment 2). Body weight, glycaemia, insulinemia and plasma H2O2 concentrations of control (Co), untreated streptozotocin-treated mice (STZ), and
N-acetylcysteine (STZ+NAC)- or oxypurinol (STZ+OXY)-treated STZ mice.
Co STZ STZ+NAC STZ+OXY
Body weight (g) 24.7 ± 0.5 21.2 ± 0.4# 20.6 ± 0.4 20.9 ± 0.6
Glucose (mg/dl) 157 ± 3 654 ± 5# 557 ± 33* 636 ± 24
Insulin (ng/ml) 2.2 ± 0.4 0.22 ± 0.01# 0.18 ± 0.01 0.25 ± 0.03 H2O2 (µM) 30.5 ± 2 67.7 ± 4# 56.1 ± 5.3 43.3 ± 3.6*
Data represent the means ± sem of 10 mice per group. # p<0.001 vs Co mice
Table 3: Characteristics of mice (experiment 3). Body weight, glycaemia, insulinemia, area under curve for both IPGTT and IPITT and plasma H2O2 concentrations of standard diet fed
mice (SD), untreated high fat and high sucrose fed mice (HFHSD), and oxypurinol-treated HFHSD mice (HFHSD+OXY).
SD HFHSD HFHSD+OXY
Body weight (g) 27 ± 0.5 44.7 ± 1.1* 45.5 ± 1.4
Glucose (mg/dl) 135 ± 5 192.3 ± 5.7* 184.2 ±9.7
Insulin (ng/ml) 0.5 ± 0.05 3.7 ± 0.7* 4.2 ± 0.7
AUC for IPGTT (a.u.) 1 ± 0.2 1.55 ± 0.28 * 1.45 ± 0.35 AUC for IPITT (a.u.) 1 ± 0.3 3.42 ± 0.25 * 3.1 ± 0.15
H2O2 (µM) 28 ± 4 43.5 ± 4* 30.1 ± 6#
Data represent the means ± sem of 10 mice per group. * p<0.01 vs SD mice, # p<0.05 vs. untreated HFHSD mice
AUC: area under curve, IPGTT: intraperitoneal glucose tolerance test, ITT: intraperitoneal insulin tolerance test.
A
B
Enzymes related toROS and RNS production
m R N A /H P R T ( fo ld v s . C o ) Enzymes related to ROS protection 0 1 2 3 4 UC P2 UC P3 gp91 p2 2 p40 p47 p67 XO NO S1 NO S3 GSR GPx SOD 2 Cat alas e Prdx 3 Prdx 5
*
*
*
*
*
*
Co STZ STZ+INS 0 1 2 3 4 5 6 Co STZ STZ+INS R eac ti ve c ar b on yl d er ivate s (a .u .)*
$ C o S T Z S T Z + IN S $ $ $ $ $basal + Xanthine + Allopurinol 0 0.5 1 1.5 2 2.5
Co
STZ
STZ+INS
H2 O2 p ro d u ct io n (f o ld v s. b a sa l)*
*
*
# # # $ N.S.B
A
basal + Succinate + Rotenone + Antimycine 0 20 40 60 80 100 120 Co STZ STZ+INS H2 O2 p ro d u ct io n (f o ld v s b a sa l)*
*
*
# # # # # # $ N.S.C
Co STZ STZ+INS 0.0 0.2 0.4 0.6 0.8 1.0 1.2 1.4 1.6 A ct iv it y ( fo ld v s C o ) Xanthine Oxidase NO Synthase*
NADPH OxidaseA
B
mR N A /H P R T ( fo ld v s C o ) Enzymes related to ROS and RNS productionEnzymes related to ROS protection 0 1 2 3 4 UC P2 UC P3 gp91 p22 p40 p47 p67 X O NO S1 NO S3 GSR GPx SOD2 Cat alas e Prdx 3 Prdx 5
*
*
*
*
*
*
$ $ Co STZ STZ+OXY 0 1 2 3 4 5 6 Co STZ STZ+OXY R eac ti ve c ar b on yl d er ivate s (a .u .) S T Z + O X Y S T Z C o*
$A
B
Figure 4 m R N A lev els ( fo ld v s. C o ) NADPH oxidase Enzymes related to ROS and RNS productionEnzymes related to ROS protection 0 1 2 3 4 UCP2 UCP3 gp91 p22 p40 p47 p67 X O NO S1 NO S3 GSR GPx SOD 2 Cat alas e Prdx 3 Prdx 5
*
*
*
*
*
*
Co STZ STZ+NAC 0 1 2 3 4 5 6 Co STZ STZ+NAC R eac ti ve c ar b on yl d er ivate s (a .u .)*
$ S T Z + N A C S T Z C o0 0.2 0.4 0.6 0.8 1 1.2 1.4 1.6 Xanthine Oxidase NADPH oxidase NO Synthase A ct iv it y ( fo ld v s. C o ) * # Co STZ STZ+Oxypurinol
Figure 7 0 0.2 0.4 0.6 0.8 1 1.2 1.4
Pyruvate + Malate Succinate + Rotenone