Computational insights into the ecology of the human microbiota by
Christopher Scott Smillie B.S., University of Arizona (2009)
Submitted to the Computational and Systems Biology Graduate Program in Partial Fulfillment of the Requirements for the Degree of
Doctor of Philosophy at the
MASSACHUSETTS INSTITUTE OF TECHNOLOGY December, 2015
2015 Massachusetts Institute of Technology. All rights reserved.
Signature redacted
S ig n atu re o f A u th o r... ... Christopher Scott Smillie Computational and Systems Biology
Signature redacted
C ertified b y ...
Eric Alm Associate Professor of Biological Engineering Thesis Advisor
Accepted by...Signature
redacted
Chris Burge
MASSACHUSETTS INSTITUTE Associate Professor of Biology
Table of Contents
Title Page 1 Table of Contents 2 Abstract 3 Acknowledgements 4 Introduction 5Chapter 1: Ecology drives a global network of gene exchange connecting the human
microbiome 10
1.1 Abstract 10
1.2 Main Text 11
1.3 Methods 17
1.4 Figures 25
1.5 Supplemental Figures and Tables 29
Chapter 2: A simple dynamical model explains the relationship between species diversity
and compositional stability in the human microbiome 37
2.1 Abstract 37
2.2 Main Text 37
2.3 Methods 45
2.4 Figures 48
2.5 Supplemental Figures and Tables 52
Chapter 3: Strain-tracking reveals the ecological mechanisms of fecal microbiota
transplantation 70
3.1 Main Text 70
3.2 Methods 78
3.3 Figures 82
3.4 Supplementary Figures and Tables 86
Conclusions and future directions 94
Computational insights into the ecology of the human microbiota Christopher Scott Smillie
Submitted to the Computational and Systems Biology Program on January 15, 2015 in Partial Fulfillment of the Requirements for the Degree of
Doctor of Philosophy in Computational and Systems Biology ABSTRACT
The vast community of microbes that inhabit the human body, the human microbiota, is important to human health and disease. These microbes contribute to human metabolism, the development of the immune system and pathogen resistance, while imbalances among them have been associated with several diseases. In this work, I develop computational methods to gain key insights into the ecological principles that shape these communities. In the first chapter, I develop an evolutionary rate heuristic that leads to the discovery of a massive network of recently exchanged genes, connecting diverse bacteria throughout the human microbiota. Using this network, I examine the roles of phylogenetic distance, geographic proximity and ecological overlap in shaping rates of horizontal gene transfer. Of these factors, ecological similarity is the principal force shaping gene exchange. In the second chapter, I focus on the microbial communities within a person, identifying the factors that affect the stability of the human microbiota. Alpha-diversity is strongly correlated with stability, but the direction of this correlation changes depending on the body site or subject being examined. In contrast, beta-diversity is consistently negatively correlated to stability. I show that a simple equilibrium model explains these results and accurately predicts the correlation between diversity and stability in every body site, thus reconciling these seemingly contradictory relationships into a single model.
In the final chapter, I explore the use of fecal microbiota transplantation (FMT) to treat recurrent Clostridium difficile infection. I develop a new method to infer the genotypes and frequencies of bacterial strains in metagenomics samples. I apply this method to a dataset covering twenty patients before and after FMT, uncovering key ecological rules that govern the colonization and growth of bacteria in human subjects after FMT. Thesis Supervisor: Eric J. Alm
Acknowledgements
I would like to acknowledge the guidance and support of my thesis supervisor, Eric Alm. Eric has taught me how to identify scientific problems, to approach them with scientific rigor and to communicate my results. He has also been a terrific role model and friend. I would like to thank the past and current members of my thesis committee, Ed Delong,
Martin Polz, Jeff Gore and Colleen Cavanaugh, for their mentorship and guidance. I am also grateful to Howard Ochman, Eduardo Rocha, Mark van Passel and Ray Goldstein for their mentorship during the early stages of my scientific career.
I am deeply grateful to the Department of Energy for supporting my graduate studies through the Computational Sciences Graduate Fellowship program. I would like to
acknowledge the mentorship of Adam Arkin, the supervisor of my three-month practicum at Lawrence Berkeley National Laboratory. I would also like to thank the Department of Energy ENIGMA program for enabling the research I conducted while I was there. I am also grateful to the Computational and Systems Biology program for their support.
I would like to thank members of the Alm lab and Parsons for their contributions to this work and to my scientific and personal development. In particular, I would like to thank Mark Smith for the impact he has had, not only as co-author of the manuscript presented in Chapter 1, but also as a friend and scientific mentor. Mark taught me to think beyond the scope of a research paper and to seek problems that have real-world impacts. I would like to acknowledge the contributions of Jonathan Freidman to the manuscript presented in Chapter 2. His insights and advice were instrumental to the development and execution of the project. I would also like to thank Dirk Gevers, Jenny Sauk, Ilan Youngster and Libby Hohmann for their roles in study design, sample collection and data generation for the manuscript presented in Chapter 3.
Perhaps most importantly, I would like to thank my family for their support and encouragement throughout my time at MIT.
Introduction
The trillions of bacteria that inhabit the human body, the human microbiota, contribute to many aspects of human health. Collectively, these bacteria impact nutrient metabolism, energy balance and the regulation of the immune system, while imbalances among them have been associated with several diseases (Cho and Blaser 2012). Terabytes of sequence data have been generated to interrogate the structure and function of the human
microbiota (Consortium 2012). This work seeks to analyze these data, with the goal of uncovering the ecological principles that govern these important microbial ecosystems. Horizontal gene transfer is an intriguing process to study in microbial communities because it underlies much of bacterial adaptation and leaves a distinct imprint in the bacterial genome. HGT allows bacteria to rapidly adapt to changing environments through the acquisition of novel genes and pathways from neighboring bacteria in the environment. Genomic evidence from closely related strains indicates that HGT is responsible for substantial amounts of genomic adaptation relative to point mutations (Garg et al. 2003). HGT also leaves a distinct signature in the bacterial genome that can be identified through comparative genomics and even the analysis of single genomes
(Philippe and Douady 2003).
While prior studies have investigated the role of HGT in shaping bacterial genomes over evolutionary timescales (Ochman, Lawrence, and Groisman 2000; Thomas and Nielsen 2005; Gogarten and Townsend 2005; David and Alm 2011), less attention has been given to the study of HGT as an ongoing ecological process. In this work, I report the discovery
of a massive network of recent horizontal gene transfer that connects diverse bacteria in the human microbiota and in other environments. Because these gene transfer events are recent, extensive metadata is available on the environmental and geographic associations of the bacteria that are involved in this gene exchange. As a result, it is possible to evaluate the relative contributions of host phylogeny, ecological overlap and geographic proximity to the observed HGT frequencies.
In the first chapter of my thesis, I develop a heuristic to identify tens of thousands of recent HGT events in thousands of bacterial genomes. Statistical analysis of this vast network reveals that ecological overlap is the principal force driving HGT, rather than bacterial phylogeny or geographical proximity. HGT is 25-fold more frequent among bacteria within the human microbiota than between human-associated and environmental
isolates. HGT is even more significantly enriched when I focus on more narrowly defined niches, such as shared body site, oxygen tolerance and pathogenicity. In addition, transfer within the same body site among distantly related bacteria is significantly enriched over transfer between different body sites among the most closely related bacteria.
One possible explanation for these results is that bacteria from the same environment have higher rates of HGT. However, one alternative hypothesis is that this enrichment is driven by positive selection: bacteria with overlapping ecological traits are more likely to encounter the same selective pressures and to find the same gene sets useful. Because the bacteria used in this study were isolated from diverse habitats from around the world, I suggest this enrichment is driven by positive selection. In agreement with this hypothesis, I find that genes that are frequently transferred among bacteria inhabiting the same niche often have known functional roles in that niche. For example, the genes transferred among meningitis-causing bacteria are enriched for known virulence factors, such as adhesins and haemolysins. Thus, by developing a method to interrogate rapidly
expanding sequence databases, I uncovered thousands of HGT events, providing insights into the ecological forces that constrain gene exchange in the human microbiota.
In chapter one, I use genomic data to uncover a vast network of recent HGT that connects humans and environments across the world. This surprising observation suggests that HGT is relevant at ecological timescales and may therefore impact bacterial dynamics. In chapter two, I focus on the bacterial communities within a person, searching for the ecological principles that shape their dynamics over daily and monthly timescales. The stability of the human microbiota is an attractive dynamical property to study
because it is widely associated with human health (Costello et al. 2012; Faith et al. 2013; Flores et al. 2014; Coyte, Schluter, and Foster 2015) and is easily measured using 16S
rRNA amplicon sequencing. While the factors that promote stability are unknown, one highly-cited hypothesis from the ecological literature, the diversity-stability hypothesis, suggests that higher levels of species diversity lead to greater ecological stability (Elton
1958; D Tilman 1999). However, tests of this hypothesis have yielded mixed results, as
both negative and positive correlations between species diversity and stability have been observed (McCann 2000; Ives and Carpenter 2007). The human microbiota offers the unique opportunity to test this important theory in highly similar human hosts from across the globe using high-throughput sequencing.
In the second chapter of my thesis, I examine the stability of thousands of bacterial communities from 18 habitats on the human body. Although stability has many definitions, I focused on the stability in species composition, the most widely used definition in the human microbiota. Surprisingly, I found that the correlation between species diversity and stability varies from negative to positive among body sites,
mirroring previously contradictory findings from the diversity-stability debate. Analysis of additional datasets revealed that these correlations not only vary among body sites, but also between people and even within a single person. The correlation between species diversity and stability is therefore inconsistent in the human microbiota.
While previous work has seldom explained the origins of the diversity-stability
relationship, the vast sequence data afforded by the Human Microbiome Project enables the testing of additional hypotheses about microbiota stability. Unexpectedly, I found that another form of diversity, the diversity between communities (beta-diversity), was
consistently predictive of stability in every surveyed habitat. Communities with atypical species compositions were significantly less stable than those with typical species compositions. To unify these observations, I found that a simple equilibrium model can accurately predict the correlation between species diversity and stability in every habitat of the human microbiota. This suggests that the diversity between communities, rather than the diversity within a community, is the main determinant of stability in the human microbiota. I also confirm these results using data from the Barro Colorado Island tropical forest, suggesting these results may generalize beyond microbial ecosystems.
In chapter two, I use amplicon sequence data to uncover the ecological rules that shape the natural variability of species in the human microbiota. However, in addition to daily variation, one clinically relevant trait of the human microbiota is its response to massive ecological invasions in the form of fecal microbiota transplantation (FMT). In chapter three, I search for the ecological rules governing the colonization and growth (i.e. engraftment) of bacteria in recurrent Clostridium difficile infection (rCDI) patients after
FMT.
While FMT is a safe and effective treatment for rCDI (Brandt et al. 2012; van Nood et al. 2013) and potentially other diseases (Borody and Khoruts 2012; Smits et al. 2013), surprisingly little is known about its ecological mechanisms. Prior work has focused on identifying bacteria that change in abundance after FMT (Hamilton et al. 2013;
Youngster et al. 2014; Seekatz et al. 2014). These studies have found significant
differences at the species level, but have lack the phylogenetic resolution to track specific strains of bacteria. As a result, they are often unable to determine the identities and abundances of bacteria that engraft in the patient.
In the third chapter of my thesis, I use metagenomics data to track the transmission of bacteria from the donor to the patient, providing the first dataset of bacterial engraftment in a human host. At the species level, I find that FMT outcomes are highly predictable. The bacteria that engraft in the host are not selected at random; instead, highly abundant bacteria from select phylogenetic groups are most likely to engraft in the host after FMT. While highly abundant bacteria may engraft more efficiently because they are present at higher concentrations in the donor feces, I propose that this effect is driven by the presence of overlapping niches in the donor in the patient. In support of this hypothesis, bacteria in unrelated subjects are often found at the same abundances.
At the strain level, I find that the choice of donor strains may have significant and long-lasting consequences for the gut microbiota of the post-FMT patient. Complete sets of donor strains are transferred from the donor to the patient, which may stably colonize the patient for months. Surprisingly, these strains attain relative abundances in the patient that are similar to those in the donor. However, although the strain composition within a
bacterial species is preserved from the donor to the patient, the overall abundance of the bacterial species is determined by selective forces within the patient. Collectively, these observations point to a number of ecological forces shaping bacterial engraftment, such as founder effects, phylogenetic filtering, ecological selection and ecological drift. As a whole, this work demonstrates the use of sequence data to uncover the ecological forces shaping the human microbiota. It encompasses many phylogenetic scales, from genes (chapter 1) to strains (chapter 3) to species (chapter 2), each requiring different data types, from genomes (chapter 1) to 16S rRNA amplicons (chapter 2) to shotgun metagenomics (chapter 3). In all cases, the development of new methods to analyze these sequence data has enabled fundamental insights into the ecological rules governing these systems. I expect that future work will develop similar approaches to additional data types, such as single-cell genomics, transcriptomics and metabolomics to further understand the ecological properties of the human microbiota.
Chapter 1: Ecology drives a global network of gene exchange
connecting the human microbiome
Smillie CS*-, Smith MB*, Friedman J, Cordero OX, David LJ, Alm EJ (2011) Ecology drives a global network of gene exchange connecting the human microbiome. Nature 480: 241-244
1.1 Abstract
Horizontal gene transfer (HGT), the acquisition of genetic material from non-parental lineages, is known to play an important role in bacterial evolution .Notably, HGT provides rapid access to genetic innovations, allowing traits like virulence (J. Chen and Novick 2009), antibiotic resistance (Lester et al. 2006), and xenobiotic metabolism (Hehemann et al. 2010) to spread through the human microbiome. Recent anecdotal studies that provide snapshots of active gene flow on the human body highlight the need to determine the frequency of such recent transfers and the forces that govern these events (Lester et al. 2006; Hehemann et al. 2010). Through the analysis of 2,235 full bacterial genomes, here we report the discovery and characterization of a vast, human-associated network of gene exchange, large enough to directly compare the principal forces shaping HGT for the first time. We show that this network of 10,770 unique, recently transferred (> 99% nucleotide identity) genes is principally shaped by ecology rather than geography or phylogeny, with most gene exchange occurring among isolates from ecologically similar, but geographically separated environments. For example, we observe 25-fold more HGT among human-associated bacteria than among ecologically diverse non-human isolates (P = 3.0 x 10-270). Within the human microbiome, we show this ecological architecture continues across multiple spatial scales, functional classes,
and ecological niches with transfer further enriched among bacteria that inhabit the same body site, exhibit the same oxygen tolerance, or have the same ability to cause disease.
This structure offers a window into the molecular traits that define ecological niches, insight we use to uncover sources of antibiotic resistance and to identify genes associated with the pathology of meningitis and other diseases.
1.2 Main Text
The human body is a complex biological network comprised of ten microbes for each human cell and one hundred microbial genes for each unique human gene (Gill
2006). Because this hidden microbial majority is known to have profound impacts on many aspects of human health including immunity (Round and Mazmanian 2009),
inflammatory disease (Xavier and Podolsky 2007), and obesity (Ley et al. 2006), considerable efforts are underway to document the genetic diversity of the human microbiome. It is unclear what role HGT plays in the generation and distribution of this biochemical repertoire, although anecdotal findings suggest that it may be significant (Lester et al. 2006; Hehemann et al. 2010; Xu et al. 2007). In addition to informing our understanding of microbial evolution, predictive models of gene transfer are needed to effectively engineer the human microbiome because HGT facilitates rapid adaptation to drugs and other perturbations (Lester et al. 2006; Hehemann et al. 2010). Until now, however, a dearth of available genome sequences and appropriate analytical techniques have left an incomplete view of the forces that govern HGT (Lawrence and Hendrickson 2003).
Many previous efforts to explore these forces have highlighted the relationship between phylogeny and HGT (Thomas and Nielsen 2005; Gogarten, Doolittle, and Lawrence 2002; Mazodier and Davies 1991; Lawrence and Hendrickson 2003).
Phylogeny is expected to strongly influence HGT because shared evolutionary history is associated with overlap in the host range of mobile elements (Mazodier and Davies
1991), establishing a mechanistic basis for the phylogenetic control of gene exchange. Meanwhile, upon transfer, selection favors the persistence of genes acquired from close relatives, because these genes have greater compatibility with native molecular
machinery (Tuller et al. 2011; Jain, Rivera, and Lake 1999).
Geography might provide an alternative structure to HGT by restricting dispersal, as suggested by the geographically organized distribution of Vibrio cholera integrons (Boucher et al. 2011) and NDM-1 antibiotic resistance genes (Kumarasamy et al. 2010).
A third possibility is that ecological similarity shapes networks of gene exchange by selecting for the transfer and proliferation of adaptive traits or by increasing physical
hyperthermophiles (Aravind et al. 1998) and spatially segregated exchange among
Shewanella isolates (Caro-Quintero et al. 2011) offer suggestive glimpses of such an
ecological structure. However, it has been difficult to determine whether ecology plays a broader role in HGT due to the limited availability of genomes from similar
environments and because most previous work has ignored the distinction between recent transfers and ancient events. The inclusion of transfers from millions or billions of years in the past can obscure ecological structure, because historical niches may not reflect modem environmental associations.
To explore the effects of phylogeny, geography and ecology on HGT we use an evolutionary rate heuristic to identify recent transfers among thousands of microbial genomes. Our heuristic finds blocks of nearly identical DNA (> 500 nucleotides, > 99% identity) in distantly related genomes (< 97% 16S rRNA similarity). HGT is the best explanation for these observations because the highly conserved 16S rRNA gene evolves about 25 times more slowly than protein-coding synonymous sites (Ochman, Elwyn, and Moran 1999). As a result, vertically inherited orthologs in such divergent genomes are nearly saturated with mutations at synonymous sites (Ochman and Wilson 1987), in contrast to the almost perfect identity that we require. To avoid over-counting transfers, we cluster similar genomes and normalize against the number of possible comparisons.
We have confirmed that at least 98% of all HGT events identified with our approach include a predicted protein-coding gene, indicating that potentially problematic non-coding elements do not significantly affect our results. To further validate our HGT detection method, we use two phylogenetic inference methods to evaluate the
evolutionary origins of putatively transferred sequences. Quartet mapping and a gene loss analysis each support 99% of identified HGTs (Supplemental Fig. 1.1).
As expected, a large fraction of observed transfers (27%) include at least one predicted mobile element, underscoring the importance of these genes in facilitating
exchange. However, when we account for redundancies we find that mobile elements like plasmids (2%), phage (1%), and transposons (9%) reflect only a promiscuous minority of the 10,770 total unique proteins that we observe, while the majority of unique genes (87%) provide other functions.
Direct exchange between any two bacteria in our dataset is unlikely, both because we limit our analysis to distantly related bacteria and because strains were isolated from different human subjects or environments, often on different continents. An average pairwise distance of 7,000 kilometers separates bacteria engaging in HGT. Therefore, each observed HGT likely reflects two independent acquisitions from a shared pool of mobile DNA, followed by proliferation.
To quantitatively explore the connectivity of bacteria in the human microbiome relative to other environments, we compare gene transfer among the 1,183
human-associated bacteria and 1,052 non-human human-associated isolates from a broad range of aquatic, terrestrial, and host-associated environments across the world. Even after correcting for biased sampling of human-associated clades (see Methods), pairs of bacteria isolated from the human body are 25-fold more likely to share transferred DNA than pairs from other environments (P = 3.0 x 10-270, combined Mann-Whitney U test).
This enrichment in human-associated transfer may be caused by the prevalence of overlapping selective pressures in the tightly regulated, endothermic human host
compared to diverse, non-human environments that experience significant temporal and spatial variation in selective pressures. Consistent with this hypothesis, when the
environment is specified more precisely by focusing on human isolates from the same body site, we observe two-fold higher rates of transfer (P = 9.9 x 10-108, combined Mann-Whitney U test). Remarkably, among the most closely related isolates from the same body site, this corresponds to recent HGT among > 40% of comparisons. This elevated transfer among bacteria isolated from similar environments extends beyond the human body, with three-fold more HGT among bacteria isolated from the same non-human environment relative to isolates from different non-human environments (P = 1.3 x 10~3,
combined Mann-Whitney U test).
However, an alternative explanation for these observations is that closely related bacteria colonize similar environments, creating an apparent ecological effect that is actually driven by shared evolutionary history. To control for such a phylogenetic effect, we plot observed HGT over a range of phylogenetic divergences, and find that the strong enrichment for exchange within similar environments (same host, same body site, same
In order to directly compare the relative contributions of phylogeny and ecology to the enrichment in human-associated transfer, we compute recent HGT among bacteria isolated from the human body (same ecology) and between these human-associated bacteria and all non-human associated isolates (different ecology) over a range of phylogenetic distances. As shown by the dashed line in Fig. 1.2a, even the most deeply divergent bacteria that are separated by billions of years of evolution but share the same ecology, engage in more HGT than the mostly closely related isolates with different ecology. Thus, this recent gene exchange is structured by ecology more than by phylogeny.
We use a similar approach to explore the influence of geography relative to phylogeny, and find that exchange between continents is slightly lower than exchange within the same continent (Fig. 1.2b; P = 0.02, combined Mann-Whitney U test). However, this geographic effect is much weaker than that of phylogeny, which is itself less informative than ecology. Taken together, these analyses indicate that recent HGT frequently crosses continents and the Tree of Life to globally connect the human microbiome in an ecologically structured network.
This ecological architecture might only reflect the especially pronounced
ecological differences between human-associated and non-human associated bacteria. To determine whether ecology has a broad influence on recent gene exchange we search for enriched HGT in narrower spatial, functional, and niche resolutions within the human host. Across all of these dimensions ecology strongly predicts gene exchange.
In addition to the previously discussed finding that transfer is enriched among bacteria from the same body site (Fig. 1.1), we find that further specifying the sub-site of isolation (e.g. separating vaginal isolates from other urogenital isolates) reveals even higher levels of transfer across all three annotated body sub-sites (sub-sites: vagina, gingiva, nasopharynx. Fig. 1.3a, Supplemental Figs. 1.2 and 1,3; P = 1.7 x 10⁻⁹, combined Mann-Whitney U test). When all human and non-human environments are considered, with scales ranging from tissues to ecosystems, we find that exchange at a narrow spatial scale, within an environment, always exceeds exchange at a broader spatial scale, with all other environments (Fig. 1.3b; P = 1.3 x 10-273, combined Chi-Square).
Until now, our analysis has relied on isolation environment as a proxy for ecological similarity, ignoring heterogeneities within these sites. Here we explore these differences, by evaluating the effects on HGT of oxygen tolerance and pathogenicity -the only other sufficiently annotated ecological features. Even after controlling for the effects of body site and phylogeny, we find that HGT is also structured by oxygen tolerance (Fig. 1.4a; P = 7.7 x 10⁻¹³, Chi-Square) and pathogenicity (Fig. 1.4b; P = 7.4 x 10~", Chi-Square). These findings demonstrate that in addition to the extensive spatial effects described earlier, chemical gradients and symbiotic relationships provide further ecological structure to recent HGT. Because these results persist after controlling for explicit spatial effects, they appear to reflect selection rather than simply co-occurrence.
To further explore the role of selection, we probe its effects on the proliferation of different functional classes. If selection influences the rates and bounds of gene
exchange, then the transfer of genes providing a non-specific selective advantage, like antibiotic resistance, should exhibit reduced environmental specificity relative to other, more niche-specific functional classes. To test this prediction, for each environment, we consider the fraction of observed transfers that include at least one antibiotic resistance gene (Fig. 1.3c). In contrast to our earlier observation of increased transfer within sites when all functional classes are grouped together (Fig. 1.3a and 1.3b), here we observe that resistance comprises a higher fraction of transfers across different environments than within the same environment (Fig. 1.3d; P = 6.9 x 10-279, combined Chi-Square). Thus, when ecological forces transcend environmental boundaries, mobile genes do too.
We have explored networks of gene transfer to evaluate the forces that influence recent HGT, finding that ecology is profoundly important. Now we demonstrate how knowledge of this association between ecology and HGT can be used to reveal clinical insights from patterns of observed gene transfer.
Our findings coupled with previous results (Hehemann et al. 2010) suggest that recently transferred genes among bacteria occupying a well-defined niche are especially likely to reflect adaptation to that niche. Consistent with this expectation, we find that many genes transferred among distantly related meningitis isolates -like hemolysins, adhesins, and antibiotic resistance genes (Supplemental Table 1) -are known to play an
unknown functions are likely cryptic virulence factors and should be prioritized for experimental annotation. Thus, in addition to recovering known virulence factors, our approach might streamline the search for novel drug targets (Clatworthy, Pierson, and Hung 2007), because while it is prohibitively difficult to explore all 24,095 unique meningitis genes with unknown function, it is tractable to evaluate the thirteen that were recently transferred. We use this approach to identify genes associated with other
diseases (e.g. pneumonia, endocarditis; Supplemental Tables 2 and 3) and environments (e.g. hot springs and soil; Supplemental Tables 4 and 5) opening a molecular window into the genetic traits that define ecological niches.
As a second example, our analysis of recent HGT reveals potential sources of clinical antibiotic resistance. We find that bacteria from farm animals and human food are enriched in transfer of resistance with human-associated bacteria relative to other non-human associated isolates (P = 1.7 x 10⁻¹¹ and P = .01, respectively, Mann-Whitney U test). Forty-two unique antibiotic resistance genes are transferred between human and farm isolates. These transferred genes comprise nine families, all of which include both genes known to provide resistance to clinical antibiotics and genes known to confer resistance to agricultural drugs (see Supplemental Table 6). This suggests that
livestock-associated bacteria can contribute to clinical resistance without directly infecting humans, because for these mobile traits, genes, not genomes serve as the unit of evolution and
proliferation. Moreover, we observe forty-three unique antibiotic resistance genes crossing national borders, suggesting that because the human microbiome is globally connected, local contamination of the shared mobile gene pool can have significant trans-national consequences.
Here we present the discovery that ecology governs recent HGT and use this finding to reveal the key genes and networks of exchange that facilitate colonization, and occasionally exploitation, of the human host. In the future this approach could be
extended to analyze bacterial genomes from individuals or groups of individuals that differ in diet, disease, or descent to search for the microbial genes that affect these human conditions.
1.3 Methods
Methods Summary
All 16S rRNA genes were identified using the GreenGenes database (DeSantis et al. 2006). 115 genomes with spurious or truncated 16S rRNA sequences were excluded from our analysis. We used BLAST (version 2.2.20) with default parameters (Altschul 1990) to calculate an all against all nucleotide alignment for 2,235 genomes downloaded from IMG (Markowitz 2006). We infer HGT events from blocks of nearly identical DNA (> 99% identity, > 500 bp) in distantly related genomes (< 97% 16S rRNA similarity). To avoid over-counting events in ancestral lineages, we collapse closely related genomes using average linkage clustering into groups ('species') with 16S rRNA dissimilarity of 2%. For each pair of these clusters, we calculated the fraction of genome comparisons between clusters that share at least one inferred HGT event. We sum this fraction over all pairs of clusters and normalize to the total number of comparisons in order to calculate the HGT per 100 comparisons. Statistical tests of HGT enrichment were performed
separately for each distance bin then combined into a single p-value using Fisher's Method. We modeled antibiotic resistance transfer as a binomial random variable with parameter p and calculated a 95% confidence interval around our estimate ofp. The size of this confidence interval, which is the statistical uncertainty of our estimate, was used to
desaturate the color of the heatmap in Fig. 1.3c. To explore the effects of oxygen tolerance and pathogenicity on HGT, we use a Chi-Square test to compare the observed
frequency of HGT to the expected value given the distribution of body sites and phylogenetic divergences. Protein-coding regions were identified and annotated using
BLASTX (Altschul 1990) (E-value < lE-50) and UBLAST (Edgar 2010) (maxtargets = 100, E-value < E-50) searches against the NCBI nr database. Unique genes reflect unique best BLAST hits to the database. Antibiotic resistance genes were annotated using the Antibiotic Resistance Genes Database (Liu and Pop 2009).
Extended Methods
Quartet mapping
To test whether phylogenetic reconstruction supports our inference of HGT, we
performed quartet mapping, in which all possible four-member trees are generated and analyzed to simulate analysis of the larger and more computationally challenging parent tree. We followed a similar approach to the quartet mapping described by Daubin and
Ochman (Daubin and Ochman 2004). Briefly, we searched all 2,235 genomes in our analysis for homologs to each HGT event (defined as best reciprocal BLAST hits with >
60% nucleotide identity over > 60% of the length of the transferred gene; see note on homology below). For HGT events with at least two homologs, we used MUSCLE (with
default settings) to construct an alignment of the HGT sequences and all other non-HGT
sequences. Events with fewer than two non-HGT homologs - 23% of the total - cannot be
used to generate a quartet and so could not be analyzed by quartet mapping. For the quartets that remained, we used Tree Puzzle to analyze all possible quartet topologies among the aligned HGT and non-HGT sequences. With Tree Puzzle we used exact parameter estimates and gamma distributed rates with four rate categories. To provide phylogenetic confirmation of our putative HGT events, we computed the likelihood of obtaining a quartet grouping the HGT events together, versus the alternative, vertical model that would group sequences by the topology of the species phylogeny. A
previously published likelihood ratio (Daubin and Ochman 2004) was then used to place phylogenetic confidence in each HGT event. We used the most stringent confidence threshold possible, requiring a likelihood ratio of 1.0 to support HGT inference. With this conservative approach, more than 99% of the HGTs we analyzed were supported.
Gene loss analysis
We explored whether vertical inheritance is a plausible alternative explanation for each inferred HGT by determining the minimum number of independent loss events that would be needed to support a model of vertical inheritance. We mapped all inferred transfers and their homologs to the IMG species tree and calculated the number of independent loss events that would be required to explain the sparse phylogenetic distribution of these events. Here, we define homologs as best BLAST hits with > 90%
identity and > 80% length (see note below). These parameters allow for considerable variation in evolutionary rates within the gene family.
As shown in Supplemental Fig. 1.1, for the majority of HGT events, over 100 independent loss events would be required to accept a model of vertical descent. To contextualize this remarkable observation, most parsimony based HGT detection tools use an empirically derived estimate of approximately 3:1 as the parsimony cost of losses relative to HGT (David and Alm 2011). Using this 3:1 parsimony metric, over 99% of our events can be explained by HGT.
Note on the detection of homologs
We varied the parameters that define homology for the two approaches above in order to maximize our ability to detect vertical transmission. We used an especially permissive definition of homology for quartet mapping to allow a maximal number of potentially homologous genes to disrupt the pairing of the putatively transferred sequences, thereby increasing the opportunity to return a quartet that does not support HGT. We employed a more moderate definition of homology for the loss analysis to avoid spuriously inserting unrelated proteins that may have appeared as false loss events.
Controlling for contamination
To control for the potential effect of contamination derived from genomes processed at the same sequencing facility, we repeated our principal analysis, but only compared
genomes sequenced at different facilities. This restricted analysis confirmed that our main findings are not caused by contamination between projects at the same sequencing center. In Supplemental Fig. 1.4, we show that there is more HGT among human-associated bacteria than among non-human associated bacteria, across all phylogenetic distances.
The enrichment in HGT among bacteria occupying the same body site relative to bacteria occupying different body sites is similarly replicated in this restricted analysis (as found in Figure 1.1 of the main text).
shared ecology continue to exchange more DNA than the most closely related comparisons with different ecology when only HGT between sequencing centers is allowed (as found in Figure 1.2 of the main text).
Controlling for cosmopolitan genomes
To control for the potential effect of cosmopolitan genomes that inhabit multiple environments, we repeated our principal analysis, excluding all genome clusters containing at least two representatives from different body sites, hosts, or other environmental categories. This removed cosmopolitan groups of organisms like
Escherichia coli, which is found in the gut, skin, blood, and non-human environments for
example. This restricted analysis robustly yields the pattern of ecological enrichment found in the main text (Supplemental Fig. 1.6).
Limitation of HGT detection
Our method is only able to detect horizontal gene transfer between distantly related lineages. Another limitation is that our method can only detect recent events that share 99% nucleotide identity. Consequently the dynamics discussed in our analysis may not apply to more ancient HGT or to HGT between less divergent strains. However, because
a stringent phylogenetic distance cut-off is used to inform each HGT classification our method avoids many of the limitations of previous BLAST-based approaches to HGT
detection (Stanhope et al. 2001).
Limitations of geographic inference
There are a few important caveats to consider when reviewing our geographic findings. First, due to limited sample size, we only explored the effects of geography at continental scales. It is possible that strong effects may persist at finer spatial scales, although these may be primarily driven by ecological overlap, which is difficult to distinguish from local geography. Second, the location of isolation is only a proxy for the overall geographic range of a sequenced strain. When a strain is isolated from a particular site, it may have a range that extends across a much larger geographic range, obscuring the validity of geographic inference from a single sample.
Annotation of mobile genetic elements
For this analysis we were interested in exploring the approximate magnitude of mobile elements relative to other functional groups. In the interests of defining the minimum number of mobile elements in our analysis, we chose a rapid and highly specific method at the expense of sensitivity. We aligned all transferred sequences to the NCBI nr database using BLASTX. We extracted the annotations for the best BLASTX hit in nr (with an e-value of e < IE-50). Next we used keyword search text mining coupled with manual curation to count the frequency of each functional category. Our keywords are designed to reduce false positives -we understand that valid mobile elements may not be detected with this simple approach.
The keywords used to identify each functional group are listed below (case sensitive):
Transposons: transpos*, TN, insertion element, is element, IS element Phage: phage, tail protein, tegument, capsid
Plasmid: relaxase, conjugal transfer, Trb, relaxosome, Type IV secretion, conjugation, Tra[A-Z], Mob[A-Z], Vir[A-Z][0-9], t4ss, T4SS, resolvase
Other MGE: recombinase, integrase
The percent of total proteins (27%) is calculated by counting each of the functional classes as a fraction of all transferred sequences. In order to account for redundancy in the set, we extract the NCBI gene identifier for the best BLASTX hit for each transferred sequence. We then remove all redundancies from this list of gene identifiers and count the fraction of unique gene identifiers that fall into each of the functional classes described. This analysis suggests that a relatively small group of promiscuous mobile elements accounts for a large fraction of total transferred sequences.
Definition of environments
Metadata to define environments, such as isolation site, oxygen tolerance, and pathogenicity were downloaded from IMG (Markowitz 2006).
Treatment of ambiguous metadata annotations
We only consider genome comparisons for which we have appropriate metadata. For genomes with partial metadata (i.e. oxygen tolerance is annotated, but continent and disease are missing), we include the genome when possible (for oxygen tolerance) and ignore it in other analyses (continent and disease).
When comparing the frequency of HGT in the same environment with the frequency of HGT between different environments it is necessary to handle ambiguous genome annotations with multiple annotated environments (e.g. gut and skin). In these cases, we consider this strain once for each metadata label. Thus when a strain from the gut is compared to a strain annotated as gut and skin, this comparison will contribute to both comparisons of gut-gut transfer and gut-skin transfer.
Computation of error bars
Error bars reflect our estimated uncertainty in the sampling of a binomial random variable (the observation of HGT). We compute error bars as the standard deviation in %HGT by modeling the total number of transfers as a binomial random variable with parameters p and n. We take n to be the number of independent species cluster comparisons and we estimate p as the total %HGT observed at each phylogenetic distance. From these considerations, it follows that the variance is given by Var[%HGT]
=p(l -p)/n which is used to calculate the standard deviation at each distance bin.
Counting HGT
When measuring the frequency of HGT between environments we only consider the fraction of genomes that share at least one HGT. We do not consider the length of a transfer because high variance in event length would add significant noise to our results
and overweight rare, large transfer events that do not reflect evolutionary independence. We do not consider the number of distinct regions of HGT shared between two genomes
because transposition or poor assembly might falsely inflate this metric by splitting a single large event into many smaller apparent events.
In Fig. 1.3 of the main text, HGT is computed as the average across all distance bins in contrast to Fig. 1.1, where HGT is computed in separate distance bins. As a result, the frequencies of HGT cannot be directly compared between the two figures.
Clustering similar genomes
In order to avoid over-counting transfers, we use average linkage clustering to group similar genomes (with < 2% average 16S rRNA divergence). This ensures that transfers between clusters reflect evolutionary independence and avoids the problem of counting a single transfer in a densely sampled lineage many times. All comparisons discussed in the text reflect transfers across clusters constructed in this manner.
Because the sequenced flexible genome is larger when more isolates from a single cluster are considered, the probability of observing at least one transfer between two clusters with many sequenced isolates is greater than between two clusters with fewer sequenced isolates. To account for this effect, for each cluster comparison we consider the fraction of genomes that share an HGT. We equally weight all genome comparisons between two clusters. If 50% of a genome cluster has a hit with at least one member of another
genome cluster, we consider this cluster comparison as 50% of an HGT.
Statistical methods
To test for overall enrichment in HGT between two metadata labels (e.g. human vs. non-human) we perform separate statistical tests for enrichment within each phylogenetic distance bin, then combine these test results into a single p-value using Fisher's method. Within each phylogenetic distance bin, we determine if there is, a significant difference in HGT frequencies between all pairs of genome clusters belonging to the two different metadata labels. With our counting and clustering protocols (described above), we create two vectors (each corresponding to a metadata label) of HGT frequencies (with
applied to assess differences in observed frequencies of HGT and to assess the statistical significance of the data underlying Fig. 1.1, Fig. 1.2, and Fig. 1.3 in the main text. This approach controls for the effect of phylogeny by restricting comparisons of HGT
frequency to isolates of similar phylogenetic divergences (distance bins of 1% 16S rRNA distance).
After establishing the strong effect of body-site on HGT frequency in the human
microbiome, further analyses (such as oxygen tolerance and pathogenicity as in Fig. 1.4, main text) must control for both the effects of phylogeny and body-site. We achieve this by calculating the frequency of HGT for all possible combinations of body-sites and phylogenetic divergences. For example, the expected value for skin-gut transfer at 3-4% 16S rRNA divergence is the average of all observations that meet these metadata criteria. Our null model assumes that further constraining our analysis with additional metadata labels will not lead to values that deviate from these expected values. To test this model, we compare the expected value to the observed frequency of HGT when the analysis is further conditioned on a new metadata label (e.g. anaerobes in skin and gut at 3-4% 16S rRNA divergence). We determine whether this further metadata constraint is associated with elevated HGT by using a Chi-Square test to compare the expected values with the observed values.
1.4 Figures
50~
Human - -- Same site S40
f\
--- Different site3---
Non-HumanC30-0
S0-I
I'
i-1
0-3
6
9
12
15
18
16S Distance (%)
Figure 1.1: Recent HGT is enriched in the human microbiome across all
phylogenetic distances. These plots (a, b) show HGT frequency as a function of the phylogenetic divergence between species, for a, human-associated bacteria, and b, non-human associated bacteria. We define species as clusters of genomes separated by <2%
16S rRNA divergence. HGT frequency is calculated in bins of 1% 16S rRNA divergence. Error bars reflect one standard deviation (see Supplemental Methods), with sample sizes described in Supplemental Table 8. These trends are also observed after controlling for the potential effects of sequencing center contamination (Supplemental Fig. 1.4) and cosmopolitan strains (Supplemental Fig. 1.6).
-- Same ecology Different ecology r --- I 3 6 9 12 15 18 16S Distance (%) b 0 . E 0 C. I- 20- 15- 10- 5--- Same continent Different continent I I I 3 6 9 12 15 18 165 Distance (%)
Figure 1.2: Ecology is the dominant force shaping recent HGT in the human
microbiome. a, The frequency of HGT among human-associated isolates (same ecology; blue) and between human-associated and non-human associated isolates (different
ecology; red). b, The frequency of HGT among bacteria isolated from the same continent (blue) and different continents (red). Due to reduced sample size in b, we pooled
comparisons into larger phylogenetic distance bins of 3%. Error bars are calculated as in Fig. 1.1. The role of ecology in (a) is recovered when we control for sequencing center contamination (see Supplemental Fig. 1.5).
a CL E 0 U -L 0 25- 20- 15- 10- 5-0 1 0 1
Human Non-Human
Air Oral Uro Marine
b Co0% 11% Nasopharynx D-- 1 10.6 Other 1W----1 5 Gut b E- Gingivae 00 4 0 Other ICe -Skin --- 1 0 2 Vagina 0.-I D Other low-- E Hydrothermal A 8 , Heterotroph --C2 Other W-0 Soil 1 ----z 1 Food Farm 10 .... 0 AR 0 Same site % R RA o All other sites 0 25 50 75 100
% HGT containing antibiotic resistance (AR)
Figure 1.3: HGT is ecologically structured by functional class and at multiple spatial scales. The frequency of transfer among different environments is shown for all
functional groups (a, b) and for antibiotic resistance (AR) genes only (c, d). Box widths indicate the number of genomes from each environment. a, When all genes are
considered (upper half) human isolates form a block of enrichment (upper left). b, For every environment examined we observe more transfer within the same environment (black dots) than between environments (white dots). c, The fraction of gene transfers that includes at least one AR gene for each environment. Statistical uncertainty in the proportion of AR transfer is indicated by reduced color saturation (see Methods). d, AR
genes comprise a significantly higher fraction of observed HGT between different environments (white dots) relative to within the same environment (black dots) in contrast to (b).
Oxygen tolerance -- Observed Expected 3 6 9 12 15 18 16S Distance (%) b 60-E 50-0 MA E 0 30 - 20- I-0 -Pathogenicity -- Observed Expected 3 6 9 12 15 18 165 Distance (%)
Figure 1.4: Gene exchange is ecologically structured by oxygen tolerance and pathogenicity. The frequency of HGT between genomes with the same (a) oxygen tolerance and (b) pathogenicity is shown relative to their expected values. Expected values are based on overall frequencies of transfer among bacteria from the same
distribution of body sites and phylogenetic distances. Bacteria that share the same oxygen tolerance (aerobic, anaerobic, microaerophilic, or facultative aerobic) and pathogenicity (pathogenic or commensal) engage in significantly more HGT than is expected under the null model. Error bars are calculated as in Fig. 1.1.
a 40-Ln C 0 An 0. E 0 L 30- 20- 10-0 -1
1.5 Supplemental Figures and Tables 0.6 CI Cr G) 0.5 -0.4 0.3 0.2 0.1 0.0' 0 20 40 60
Number of Loss Events
80 >100
Supplemental Fig. 1.1: The majority of inferred HGT events require over 100 independent loss events in order to accept a model of vertical descent. For each inferred transfer we map homologs onto the species tree and infer the minimum number
of independent loss events needed to support a model of vertical inheritance. This figure depicts the frequency with which loss events are inferred - most inferred transfers would require extensive loss events in order to accept the alternative model of vertical
transmission, supporting our approach to HGT detection.
I - I
---.3
Human Non-Human Air Oral UmO Marine soil
Human Non4lman Air Oral Umo Marine soil
b 4 8 Nasopharn Gut Skin Hydrothermall Heterotroph Other ther Food Farm Human Notr-luman Alt Oral Urn Matine so"l
x~i~d
4
0
Supplemental Fig. 1.2: Heatmap of HGT among isolates in different environments at 5%, 7% and 10% 16S rRNA divergences. This figure shows the frequency of HGT between each of the environments included in this study across three different distance cutoffs, in addition to the overall plot shown in Figure 1.3a of the main text. Each distance cutoff includes all comparisons satisfying the given separation criteria (e.g. 5% includes comparisons of all clusters of bacteria separated by at least 5% 16S rRNA divergence). Although the specific values of enrichment vary across different distance cutoffs, the overall pattern of human, body site and body sub-site enrichment persists across all distance groupings. We show only the heatmap for all gene classes (excluding the inset heatplot for antibiotics that appears in the main text Figure 1.3c) because there are insufficient counts to yield reliable estimates for rates of long distance transfer when only antibiotic resistance genes are considered.
a
I
~i
Nasopharynx Other Gut Other Skin Vagina Other Hydrothermal Other Heterotroph Other Food Farm 4 0 Gut Skin Hdothera HetrotropiI
Other Heterotropi Food Farm3 -3%
7%
E 2 10%
Air, Air, Uro,
1 -Naso. Other Other
4--0~
0 0--n M
G Oral, Oral, . Uro,
Gingivae Other Vagina
-1-Supplemental Fig. 1.3: Barplot of HGT for each body site at 3%, 5%, 7% and 10% distance cutoffs. This figure summarizes the persistence of body-site and sub-site enrichment across four distance cutoffs. As in Supplemental Fig. 1.2, distance cutoffs reflect all comparisons with at least the given 16S rRNA distance. The log-fold
enrichment indicated on the vertical axis describes the ratio of observed transfers within the given body site at each distance relative to HGT among all human isolates at the same phylogenetic distance cutoff. The poorly sampled nasopharynx (n = 25) and non-vaginal urogenital sites (n = 46) are the only categories for which the enrichment in transfer does not persist across phylogenetic distances (likely due to uncertainty arising from small
sample sizes). Otherwise, the majority (n = 480) of isolates belong to body sites for which enrichment persists across all observed distances.
HGT between different sequencing centers
50 Human - Same site - Different site C Non-Human 0 CLE
30 0. U 20 I 10 3 6 9 12 15 1816S Distance (%)
Supplemental Fig. 1.4: Ecological structure persists when only genome comparisons from different sequencing centers are allowed. We compute the frequency of transfer within human associated isolates (yellow), non-human isolates (blue) human isolates from the same body site (green) and human isolates from different body sites (red), while only allowing genome comparisons between different genome sequencing centers. This controls for contamination that might arise in the sequencing and assembly process.
25 0 ZA . t-I
E
0 U 20 15 t 101 5-I
n1 -3HGT between different sequencing centers
-- Same ecology Different ecology
6 9 12
16S Distance (%)
15 18
Supplemental Fig. 1.5: Ecology is the dominant force shaping recent HGT in the human microbiome, even when HGT is only allowed between different sequencing centers. This figure compares the effects of ecology relative to phylogeny on HGT, when HGT is only allowed between different sequencing centers. The frequency of HGT is shown among associated isolates (same ecology, blue) and between human-associated and non human-human-associated isolates (different ecology, yellow). Even the most distantly related bacteria with shared ecology engage in more HGT than the most closely related bacteria with different ecology when we control for contamination caused by
sequencing projects from the same sequencing center.
HGT excluding cosmopolitan species
70 Human 60 Same site -n Different site C Non-Human 0 50 CLE
4o-0 ~30 L 0 0 10 0 36 9 12 15 1816S Distance (%)
Supplemental Fig. 1.6: Ecological structure persists when cosmopolitan species are excluded. We compute the frequency of transfer within human associated isolates (yellow), non-human isolates (blue) human isolates from the same body site (green) and human isolates from different body sites (red), while excluding species that are present in multiple environments (cosmopolitan species). This controls for the potential
Supplemental Table 1.1: Sample sizes used in statistical comparisons. This table shows the sample sizes used in the Mann-Whitney U-tests in Figs. 1.1, 1.2, and 1.4.
16S rRNA Distance Bins
Environment 3 4 5 6 7 8 9 10 11 Human 166 232 378 383 827 1327 1638 2672 3544 Human within 88 120 184 193 416 546 562 786 973 Human 62 132 200 198 372 576 857 1689 2300 between Non-Human 1658 1169 2859 2657 3810 6526 6891 10380 13841 Same ecology 166 232 378 383 827 1327 1638 2672 3544 Different 552 425 948 911 1876 3831 3979 6990 8263 ecology Same 84 253 652 continent Different 108 372 1186 continent Same oxygen 106 190 268 247 500 708 683 988 1297 tolerance Same 30 70 122 84 174 233 266 355 434 pathogenicity
16S rRNA Distance Bins
Environment 12 13 14 15 16 17 18 Human 5001 7262 10802 15319 18587 18125 14944 Human 1417 1896 2807 3935 4556 4275 3451 within Human 3101 4704 6840 9586 11739 10982 8946 between Non-Human 22295 29688 45310 64169 76375 74374 58819
Same ecology 5001 7262 10802 15319 18587 18125 14944 Different 13433 18909 27956 39740 50099 50868 40880 ecology Same 2120 4709 1974 continent Different 3375 7831 3510 continent
Note: Supplemental Tables 1-6 from this publication can be found online at nature.com. These tables are very long and have been omitted from this document due to space
Chapter 2: A simple dynamical model explains the relationship
between species diversity and compositional stability in the
human microbiome
Smillie, CS, Friedman, J, Smith, MB, Alm EJ (2015) A simple dynamical model explains the relationship between species diversity and compositional stability in the human microbiome (in progress).
2.1 Abstract
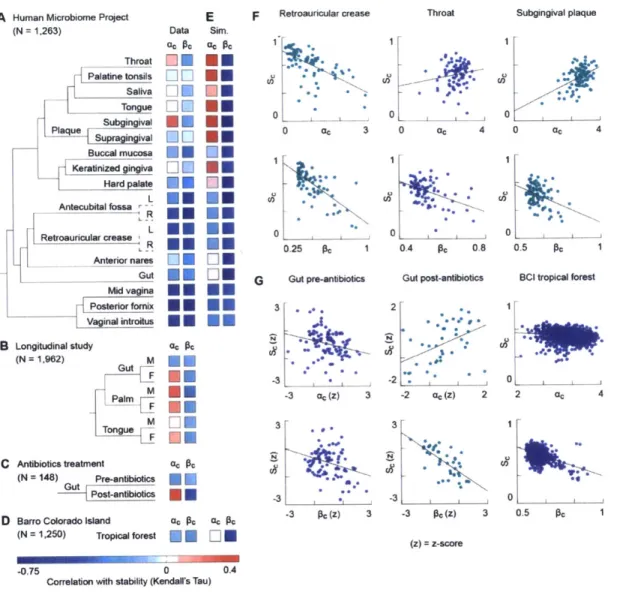
The stability of the human microbiome is widely associated with human health, yet the determinants of stability remain unknown. The diversity-stability hypothesis posits that higher levels of species diversity lead to increased stability, but this hypothesis is contentious and tests in the human microbiome have yielded conflicting results. Here, we identify a new metric, community divergence, which is a stronger determinant of stability than is species diversity across 1,263 microbial communities from 19 habitats on the human body. Using this metric, we show that a simple metacommunity model
accurately predicts the correlations between species diversity and stability in every habitat, thus providing a mechanism for this diversity-stability relationship in the human microbiome. We validated these results using data from the Barro Colorado Island tropical forest, suggesting they may generalize beyond microbial ecosystems. 2.2 Main Text
Disturbances to the species composition of the human microbiome are associated with several diseases, including malnutrition (Turnbaugh et al. 2006; Smith et al. 2013),
autoimmune disease (Giongo et al. 2011; Markle et al. 2013; Lukens et al. 2014) and cancer (Arthur et al. 2012). Consequently, the stability of the human microbiome has attracted significant interest for both its diagnostic and therapeutic potential (Faith et al. 2013). Cross-sectional studies have revealed that average levels of stability vary
significantly across both human subjects and body sites (Consortium 2012; Flores et al. 2014). Within individual subjects, the human microbiome is relatively stable for months, or even years, (Costello et al. 2012; David, Materna, et al. 2014) but this long-term