HAL Id: hal-00563656
https://hal.archives-ouvertes.fr/hal-00563656
Submitted on 7 Feb 2011
HAL is a multi-disciplinary open access
archive for the deposit and dissemination of
sci-entific research documents, whether they are
pub-lished or not. The documents may come from
teaching and research institutions in France or
abroad, or from public or private research centers.
L’archive ouverte pluridisciplinaire HAL, est
destinée au dépôt et à la diffusion de documents
scientifiques de niveau recherche, publiés ou non,
émanant des établissements d’enseignement et de
recherche français ou étrangers, des laboratoires
publics ou privés.
Optical-Feedback Cavity-Enhanced Absorption
Spectroscopy with a Quantum Cascade Laser.
G. Maisons, P. Gorrotxategi Carbajo, M. Carras, D. Romanini
To cite this version:
G. Maisons, P. Gorrotxategi Carbajo, M. Carras, D. Romanini. Optical-Feedback Cavity-Enhanced
Absorption Spectroscopy with a Quantum Cascade Laser.. Optics Letters, Optical Society of America
- OSA Publishing, 2010, 35, pp.3607. �hal-00563656�
Optical–Feedback Cavity–Enhanced Absorption Spectroscopy with a
Quantum Cascade Laser.
G. Maisons2, P. Gorrotxategi Carbajo1, M. Carras2 and D. Romanini1∗
1 Laboratoire de Spectrom´etrie Physique, CNRS UMR5588, Universit´e J. Fourier de Grenoble, Saint Martin d’H`eres, France 2 Alcatel Thales III-V lab, 1, Av. Augustin Fresnel, Campus Polytechnique, Palaiseau
∗Corresponding author: [email protected] Compiled February 5, 2011
Optical–feedback cavity–enhanced absorption spectroscopy is demonstrated in the mid–IR using a quantum cascade laser (emitting at 4.46 µm). The laser linewidth reduction and frequency locking by selective optical feedback from the resonant cavity field turns out to be particularly important in this spectral range: It allows strong cavity transmission which compensates for low light sensitivity, especially when using room temperature
detectors. We obtain a noise equivalent absorption coefficient of 3×10⁻⁹cm−1, for 1 s averaging of spectra
composed by 100 independent points. At 4.46 µm this yields a detection limit of 35 pptv for N2O at 50 mbar,
corresponding to 4×10⁷molecules/cm3, or still to 1 femtomoles in the sample volume.
c
° 2011 Optical Society of America
OCIS codes: 120.6200, 280.3420, 140.4780, 140.5965,
High sensitivity laser absorption spectroscopy, in all its implementations, is widely recognized as a valuable alter-native to traditional analytical techniques such as chro-matography and mass spectrometry. In many applica-tions it was shown that laser spectroscopy allows more direct, fast, selective, and precise measurement of trace concentrations in gas samples, down to ppbv or pptv lev-els depending on the strength of the targeted molecular transition. As their performance keeps improving Quan-tum Cascade Lasers (QCLs) are becoming the source of choice for accessing the strongest molecular transitions in the mid Infra-Red (mid-IR) range. In particular, room temperature single-frequency (DFB) continuously tun-able QCLs are now availtun-able.
Cavity Enhanced Absorption Spectroscopy (CEAS) and Cavity Ring-Down Spectroscopy (CRDS) usually excel over traditional multipass cells when larger absorp-tion paths are desired. However, in the mid-IR this ad-vantage is thin, since the small throughput of a high finesse cavity is more of a penalty than in the near in-frared due to the low detection sensitivity. We present here the first QCL implementation of a high performance CEAS method which exploits Optical Feedback (OF) to achieve optimal injection of the narrow resonances of a high finesse optical cavity [1]. As explained in previous reports of OF-CEAS applications using telecom diode lasers [2–4], OF-CEAS provides rapid but complete, se-lective and sequential injection of TEM00 cavity modes
during a laser scan. Complete injection means that the stationary cavity buildup regime is attained for each TEM00 mode, so that stable cavity output signals are
observed with high S/N and no averaging is needed to obtain high quality CEAS spectra in a short time (typi-cally 1-2 ms per cavity mode).
A few recent papers describe applications were a QCL is coupled with a high finesse cavity by CEAS or CRDS [5–7]. This was made possible by the advent of
contin-uously tuneable CW QCLs, since pulsed QCLs achieve high power during a time comparable to only a few cav-ity round trips, and in addition during this time its frequency sweeps across several cavity resonances, giv-ing negligible cavity injection. The most impressive per-formances obtained by coupling a CW QCL to a cav-ity, are by far those provided by the Off-Axis injection scheme [8], already applied to isotopic ratio measure-ments aboard aircrafts [9] or to breath analysis in a medical setting [7]. However, despite the high sensitiv-ity and the short measurement times, OA-CEAS is still plagued by low signal levels at cavity output demand-ing cryogenically cooled, large–area detectors. Another drawback is the large transverse dimension of the high finesse cavity (2 inch diameter mirrors) since OA-CEAS performance depends on the ability to excite very high order transverse cavity modes, whose superposition gives rise to quasi-periodic folded trajectories with Lissajous– like impact patterns optimally filling the mirrors sur-faces. The resulting large cavity volumes thus require high sample flows to allow for reasonable response times. Finally, OA-CEAS demands fast laser scanning rates to achieve smoother signals, but at the cost of distorted molecular lineshapes due to the finite cavity response time [9].
OF-CEAS does not suffer from these drawbacks. Its V shaped cavity attains an internal volume below 20 cc. The full injection of well separated longitudinal TEM00
cavity modes provides high quality undistorted absorp-tion line profiles on a precisely defined frequency grid (mode spacing for a 50 cm V-cavity is 150 MHz, and def-inition of mode frequencies is at the 10 kHz level). This feature is to the advantage of high precision measure-ments as needed e.g. in the determination of isotopic ratios, and it allows using room temperature detectors even in the mid-IR. Indeed the OF-CEAS performance we achieve at 4.5 µm when using state of the art mirrors
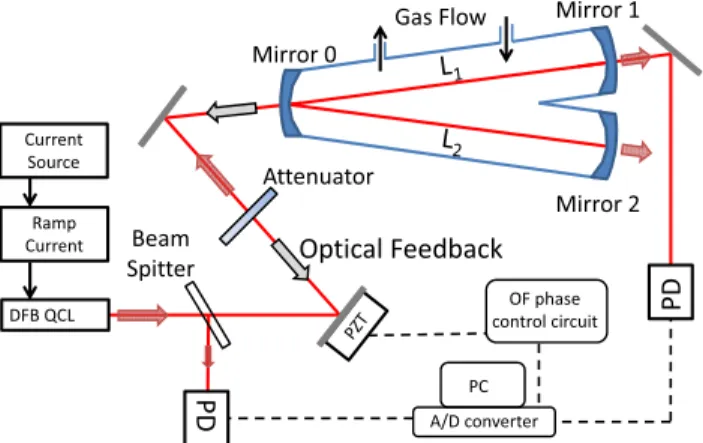
Fig. 1. The V-shaped cavity setup. Part of the resonant intra–cavity field gives frequency selective OF. The PZT-mounted steering mirror controls the phase of the OF field. The laser is mounted on a translation stage to allow wider adjustment of the laser-cavity separation. A beam splitter is used to monitor the laser power.
in this range (99.98%), is comparable to that we previ-ously obtained in the near-IR when accounting for the higher mirror quality there (99.99%).
The type of QCL used here (Fig. 1) is detailed in [10]. A metal grating is placed on the top of the laser struc-ture to achieve index modulation with little additional losses. This technology allows reaching room tempera-ture continuous wave monomode emission with 30 dB of side mode suppression ratio. Around 20◦C the QCL of
our setup has a lasing threshold around 380 mA, and output power of up to 15 mW for the maximum current of 450 mA. It is thermoregulated by using a Peltier ele-ment with a passive air radiator, a thermistance and a commercial diode laser temperature controller. The laser beam is collimated via an aspheric lens with 0.85 numer-ical aperture. The laser driving current is supplied by a home-made current source as repetitive ramps for peri-odic laser frequency tuning. A current ramp of 100 ms from 400 mA to 450 mA provides scans over 0.5 cm−1,
or about 100 cavity modes. A special effort was needed for adapting an electronic card originally developed for diode lasers, in order to keep the current noise at a suf-ficiently low level.
The photodiodes (PD) are (HgCdZn)Te structures by VIGO with a detectivity of 6×1010cm√Hz/W
for the PD measuring the cavity transmission and 2×1010cm√Hz/W for the reference signal PD. Their
bandpass is 1 MHz. As usual in OF-CEAS, an attenua-tor controls the fraction of returning radiation (feedback rate): in this setup, we use two microscope glass slabs (1 mm thick) giving about 21% transmission each. Also, the OF phase is finely controlled by sub-wavelength au-tomatic displacements of the PZT mounted mirror while the QCL is mounted on a translation stage for rough ad-justment of the laser–cavity distance [1]. A sealed glass
2239.0
2239.2
2239.4
2239.6
2239.8
5 10 18 24 30 0 5 Cavity output P D s ig na ls / V ol t time / ms Laser intensity -6 -1 wavenumber / cm-1HITRAN 08 :
H
2O 0.1%
N
2O 15ppb
CO
227ppm
OF-CEAS
Fig. 2. OF-CEAS spectra of diluted air, 1:25 in dry N2 (black line), together with a HITRAN simulation (colours). Baseline offset in the OF-CEAS spectrum cor-responds to the empty cavity losses. The inset displays a section of the photodetectors signals, whose ratio gives the cavity transmission: To be noticed the large laser power increase in presence of resonant cavity feedback.
cell, including the cavity mirrors, enables using low pres-sure samples (meapres-sured by a capacitive gauge) with a controlled flow from parallel mounted Mass Flow Con-trollers (MFC). High reflectivity dielectric mirrors are by Lohnstar Optics. They are made on superpolished ZnSe substrates and their stopband goes from about 4.3 to 4.8 µm. From our ringdown measurements reflectivity is 99.98% at 4.47 µm. We also directly measured a mirror transmission of 110±20 ppm, which implies mirror coat-ing losses (absorption plus scattercoat-ing) of about 90 ppm. A 16-bit A/D card connected to a PC records the photodetector signals. In the inset of Fig. 2 we display examples of these signals (a span over about 20 cavity modes) which yield the CEAS mode–by–mode spectra as described previously [2]. A ring-down is produced at the end of each scan by a short programmed interruption of the laser injection current, which allows to calibrate the absorption scale of the CEAS spectrum [4].
A temperature ramp between 18.5 and 22.5◦C tunes
our QCL in the range from 2238.85 cm−1 to 2240 cm−1.
Fig. 2 shows the OF-CEAS spectrum for diluted ambi-ent air (about 1:25 in dry nitrogen) at a total pressure of 50 mbar, reconstructed from several current scans taken as the laser is temperature–tuned over this range. A HI-TRAN simulation for close–to–standard air composition and accounting for the dilution is also shown. Carbon dioxide CO2and nitrous oxide N2O, are clearly the main
absorbing species, while water vapor lines are barely visi-ble (after dilution). In order to check reproducibility and linearity, integrated line absorption and pressure
broad-2239.6 2239.7 2239.8 2239.9 2240.0 0 1 2 3 4 0 1 2 3 A b s. co e ff . / 1 0 -6cm -1 wavenumber / cm-1 Pressure 0 50 100 150 200 250 300 350 L in e a re a / a .u . P (mbar) F W H M / 1 0 -2 cm -1
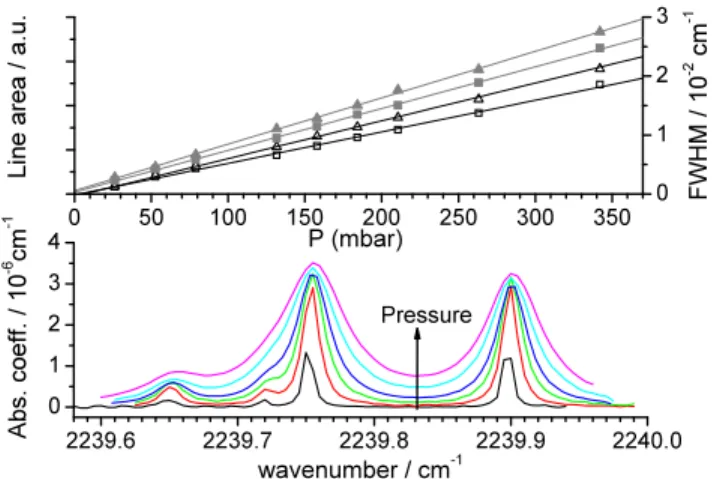
Fig. 3. Bottom graph, OF-CEAS spectra displaying linewidth broadening of CO2 (2239.898, 2239.722, and 2239.652 cm−1) and N2O (2239.754 cm−1) lines as a
function of total pressure for a constant air dilution fac-tor (1:10 in dry nitrogen) at total pressures of 26, 52, 131, 185, 263 and 340 mbar. Baseline of spectra (from line profiles fit) has been subtracted. On top, linear de-pendence of the Lorentzian broadening (grey) and the line surface (black) for CO2 (squares) and N2O (trian-gles) with increasing total pressure.
ening measurements are carried out for these species. As the absorption lines are fit to Voigt profiles, a fifth order polynomial is included to adjust for a slow base-line modulation due to etaloning in the mirror substrates (unwedged).
Line intensities are determined for different dilutions of ambient air in dry nitrogen at a constant pressure of 50 mbar, while linewidth broadening coefficients are ob-tained for different total pressures at a constant dilution factor. A linear enhancement of N2O and CO2
concen-trations is indeed observed to within experimental errors when increasing the flow rate of ambient air in dry nitro-gen to cover the dilution range from 1 to 20%. Fig. 3 re-sumes more interesting results as a function of pressure. The bottom plot shows spectra taken for a total pressure varying from 26 to 350 mbar where Lorentzian broad-ening starts from below the Doppler broadbroad-ening and then becomes dominant. The graph at the top illustrates the excellent linear dependence of the Lorentzian widths and the surfaces of the absorption lines with increasing pressure. These measurements also illustrate that below 50 mbar the Doppler broadening starts becoming domi-nant for these small molecules. This pressure thus sat-isfies the need for narrow and well separated absorption lines while still maintaining line peak values almost at their max value.
The noise in the recorded spectra is estimated from the residuals of the fit to all the NO2 and CO2 lines
present in the spectrum of Fig. 3. The noise equivalent absorption is 3×10⁻⁹cm−1 for 1 s averaging over laser
scans, which results in an averaged spectrum of about 100 independent points, one per cavity mode. From this baseline noise, the detection limit for N2O and CO2 are
estimated to be around 35 pptv and 15 ppbv, respec-tively. Equivalently, the rms noise on the concentration trace of these molecules from spectral fitting at suc-cessive times (at a fixed 50 mbar optimal pressure, and with sufficient dilution) is also found to be consistent with these detection limits. For N2O at 50 mbar, we
ob-tain a corresponding smallest detectable number density of 4×10⁷molecules/cm3. Considering the sample volume
this may also be cast to 109 molecules or equivalently ∼ 1 femtomoles.
With this work we demonstrate for the first time the high potential of OF-CEAS coupled with CW QCL light sources for gas analysis or high sensitivity precision molecular spectroscopy. The detection limit (3×10⁻⁹/cm√Hzfor an averaged spectrum of 100 points)
is close to that obtained for DFB diode lasers in the near IR range when scaled for the cavity ring–down time (e.g. a factor 3 larger in ref [2] where a detection limit of 10−9/cm is obtained with 1 s averaging). Compared with
DFB diode lasers, QCLs seem to respond more markedly to the cavity feedback (in similar conditions of feedback levels). We observe power enhancements of ∼15-20% (10 times more than for a DFB diode laser), which may be shown to be in good agreement with theoretical predic-tions based on the model of P. Laurent [11] implemented with QCL parameters.
We acknowledge financing by the French Agence
Na-tional de la Recherche (APOLINR project).
References
1. J. Morville, S. Kassi, M. Chenevier, and D. Romanini,
“Fast, low–noise, mode–by–mode, cavity–enhanced ab-sorption spectroscopy by diode–laser self–locking,” Appl. Phys. B 80, 1027–1038 (2005).
2. D. Romanini, M. Chenevier, S. Kassi, M. Schmidt,
C. Valant, M. Ramonet, J. Lopez, and H.-J. Jost, “Optical–feedback cavity–enhanced absorption: A com-pact spectrometer for real–time measurement of atmo-spheric methane,” Appl. Phys. B 83, 659–667 (2006).
3. S. Kassi, M. Chenevier, L. Gianfrani, A. Salhi, Y.
Rouil-lard, A. Ouvrard, and D. Romanini, “Looking into the volcano with a Mid-IR DFB diode laser and Cavity En-hanced Absorption Spectroscopy,” Optics Express 14, 11,442–11,452 (2006).
4. E. R. T. Kerstel, R. Q. Iannone, M. Chenevier, S. Kassi,
H.-J. Jost, and D. Romanini, “A water isotope (2H,17O,
and18O) spectrometer based on optical feedback cavity–
enhanced absorption for in situ airborne applications,” Appl. Phys. B 85, 397–406 (2006).
5. A. A. Kosterev, A. L. Malinovsky, F. K. Tittel,
C. Gmachl, F. Capasso, D. L. Sivco, J. N. Baillargeon, A. L. Hutchinson, and A. Y. Cho, “Cavity ringdown spectroscopic detection of nitric oxide with a continuous-wave quantum-cascade laser,” Appl. Opt. 40, 5522–5529 (2001).
Based on Quantum Cascade Lasers,” IEEE J. Quantum Electron. 38, 582–591 (2002).
7. K. R. Parameswaran, D. I. Rosen, M. G. Allen, A. M.
Ganz, and T. H. Risby, “Off-axis integrated cavity out-put spectroscopy with a mid–infrared interband cascade laser for real–time breath ethane measurements,” Appl. Opt. 48, B73–B79 (2009).
8. J. B. Paul, L. Lapson, and J. G. Anderson,
“Ultrasensi-tive absorption spectroscopy with a high–finesse optical cavity and off–axis alignment,” Appl. Opt. 40, 4904– 4910 (2001).
9. E. J. Moyer1, D. S. Sayres, G. S. Engel, J. M. S. Clair,
F. N. Keutsch, N. T. Allen, J. H. Kroll, and J. G. Ander-son, “Design considerations in high–sensitivity off–axis integrated cavity output spectroscopy,” Appl. Phys. B 92, 467–474 (2008).
10. M. Carras, G. Maisons, B. Simozrag, M. Garcia, O.
Par-illaud, and X. Marcadet, “Room-temperature continous-wave metal grating distributed feedback quantum cas-cade lasers,” Appl. Phys. Lett. 96, 161,105 (2010).
11. P. Laurent, A. Clairon, and C. Breant, “Frequency Noise
Analysis of Optical Self-Locked Diodes Lasers,” IEEE J. Quantum Electron. 25, 1131–1142 (1989).