A Comparison of Formal Methods for Evaluating
the Language of Preference in Engineering Design
The MIT Faculty has made this article openly available.
Please share
how this access benefits you. Your story matters.
Citation
Honda, Tomonori, Maria C. Yang, Andy Dong, and Haifeng Ji. “A
Comparison of Formal Methods for Evaluating the Language of
Preference in Engineering Design.” Volume 5: 22nd International
Conference on Design Theory and Methodology; Special Conference
on Mechanical Vibration and Noise (2010).
As Published
http://dx.doi.org/10.1115/DETC2010-29045
Publisher
American Society of Mechanical Engineers
Version
Final published version
Citable link
http://hdl.handle.net/1721.1/109245
Terms of Use
Article is made available in accordance with the publisher's
policy and may be subject to US copyright law. Please refer to the
publisher's site for terms of use.
Proceedings of the 2010 ASME IDETC International Design Engineering Technical Conferences & Information in
Engineering Conference August 15 – 18, 2010, Montreal, Canada
DETC2010- 29045
A COMPARISON OF FORMAL METHODS FOR EVALUATING THE LANGUAGE OF
PREFERENCE IN ENGINEERING DESIGN
Tomonori Honda
Department of Mechanical Engineering Massachusetts Institute of Technology
Cambridge, MA
Maria C. Yang
Department of Mechanical Engineering and Engineering Systems Division Massachusetts Institute of Technology
Cambridge, MA
Andy Dong
The Design Lab University of Sydney Sydney, Australia Sydney, NSW, Australia Haifeng Ji Yahoo! Inc. Sunnyvale, CA 1 ABSTRACT
In design, as with many fields, the bases of decisions are generally not formally modeled but only talked or written about. The research problem addressed in this paper revolves around the problem of modeling the direct evaluation of design alternatives and their attributes as they are realized in linguistic communication. The question is what types of linguistic data provide the most reliable linguistic displays of preference and utility. The paper compares two formal methods for assessing a design team’s preferences for alternatives based on the team’s discussion: APPRAISAL and Preferential Probabilities from Transcripts (PPT). Results suggest that the two methods are comparable in their assessment of preferences. This paper also examines the nature of consistency in the way design teams consider the attributes of a design. Findings suggest that assessment of an attribute can change substantially over time.
2 INTRODUCTION
The creative nature of design means that designers routinely produce multiple alternative concepts to address a single design problem. Decision-making, including selecting parameters, selecting the best alternative, and selecting the most important attribute(s) is thus a routine and yet fundamental aspect of design. Engineering design research has focused on several methods to aid in making design decisions, including Pugh charts [1], Quality Function Deployment (QFD)
[2], and the Method of Imprecision [3]. In particular, Decision-Based Design (DBD) [4] is a framework for engineering design that models stages in engineering design such as concept generation, concept selection, and optimization from the perspective of decision-making. The aim of DBD is to assist engineering designers to make decisions in a consistent and optimal way, thereby avoiding irrationality under uncertainty. However, due to the cognitive burden of utility theory on the engineer to obtain consistent preferences, e.g. through lottery methods, and to determine a utility function, DBD can be applied naïvely, incorrectly, or not at all over the myriad of decisions actually made during design. Such methods generally require some quantitative expression of preference as inputs. Explicit preference information is sometimes quantitatively available, but often it is not. It is observed that it is more frequently available in unstructured natural language representations found in engineers’ logbooks [5, 6], notes [7], and meeting minutes.
This paper considers two key challenges in addressing the cognitive burden on the engineer to determine consistent preferences. First, this paper examines the issue of gaining access to preference information embedded in informal natural language. This paper examines two methods for analyzing natural language design text for preference information. The first method, APPRAISAL Preference Analysis (APA), is a systematic, qualitative approach for mathematically modeling attitudes towards a subject based on a functional grammar
Proceedings of the ASME 2010 International Design Engineering Technical Conferences & Computers and Information in Engineering Conference
IDETC/CIE 2010 August 15-18, 2010, Montreal, Quebec, Canada
analysis of linguistic communication. The second method, Preferential Probabilities from Transcripts (PPT), is a probabilistic approach to extracting preference-related information based on subject frequency. Given a transcript of design team discussion, this research aims to identify the type of linguistic data that leads to the most reliable measure of preference and utility. We compare the outcomes from these analyses to a baseline generated from the explicit elicitation of preferences from designers, Preferential Probabilities from Surveys (PPS)
Second, this paper investigates the role of consistency in the way design teams discuss a design’s attributes. Does a design team’s prioritization of a design’s attributes change over time? The method of APPRAISAL Preference Analysis is applied specifically to a set of design attributes discussed in a meeting transcript in order to assess positive and negative changes in attitudes towards individual design attributes.
These techniques described are not intended to find the “most rational” choice based on the predicted utility of the design alternatives. In other words, the techniques cannot find a better decision. Instead, the techniques allow us to model whether the designers make the correct decision given their stated preferences for a set of attributes. Their decision can then be compared to a normative optimal decision to determine whether their making violated any axioms of decision-making or whether their decision is sub-optimal. Finally, the aim is determine whether it is possible to use qualitative language in preference modeling so that this information could be used to model inconsistencies in preferences across multidisciplinary design teams.
3 RELATED WORK
Extracting preferences from text is a growing area of interest in computational linguistics, owing partially to the tremendous growth in consumer-generated product review Web sites such as TripAdvisor and others. The challenge is to model consumer sentiment towards a product or service, and then try to ascertain consumer preferences for various attributes and alternatives. One such study applied hedonic regression to predict consumer product demand based on textual and quantitative consumer reviews of product features [8]. The problem is similar in mechanical design: what are the designer’(s’) current preferences toward an alternative or their attributes and is the designer behaving rationally in making decisions based on those preferences?
Several formal approaches exist for modelling preference in decision-making. In the lottery method, pair-wise comparisons are made between alternatives to determine their relative desirability. A pair-wise approach is also used in the Analytical Hierarchy Process. Other quantitative pair-wise comparison approaches include those that employ a fuzzy preference relationship to discriminate among preference models [9] and those that apply a fuzzy preference relationship to select among alternatives [10]. In engineering design, Scott and Antonsson discuss methods to formally calculate overall
preferences using the Method of Imprecision [11]. All of these methods directly ask for preferences, or assume a value for them.
Another approach is to extract preferences from collective group actions. Collaborative filtering [12] assumes that individuals with similar profiles gravitate to the same choices. However, a relatively large number of individual opinions are required in order to be effective, far more than is typically found on an engineering design team.
This paper evaluates the ability of two methods, APPRAISAL Preference Analysis and PPT, to extract preference information embedded in the transcripts of group discussion. These approaches differ from related work in that they focus primarily on unstructured group discussion, rather than on more structured forms of embedded rationale. These methods also offer a way to observe decision-making activities on a statement-by-statement basis so that changes in design choices can be tracked over time.
4 METHOD
The experimental procedure for assessing preferences from linguistic design communication was to apply APA as well as PPT to a transcript of design team discussion. Details on the methods of APA and PPT follow below, along with a description of the case study used to generate the design discussion transcript. Next, the results of APA and PPT were compared with each other. However, in order to normalize the APA results so that this comparison could be made, PPT was also applied to the APA results.
To evaluate design attributes, the results of APA were re-analyzed with a specific focus on the design’s attributes. APA is capable of providing nuanced observations of linguistic attitudes towards a design’s attributes. PPT is an automated approach, and was not intended to disambiguate between attributes in as meaningful a way.
4.1 Method 1: Linguistic analysis using APPRAISAL
Preference Analysis
The aim of the linguistic analysis is to model preferences and their probabilities based on linguistic data. The model of language used in this analysis is the system of APPRAISAL, which is the system for construing affect and interpersonal relations in the theory of Systemic Functional Linguistics (SFL) [13]. An appraisal is the representation through language of favorable and unfavorable attitudes towards specific subjects. Within the system of APPRAISAL, linguists define five semantic resources to realize appraisals in text: (1) Attitude, (2) Engagement, (3) Graduation, (4) Orientation and (5) Polarity [14]. In communication, the system of APPRAISAL is used to negotiate inter-personal relations by flagging evaluations, particularly where the evaluation is explicitly realized rather than implied by the context or paralinguistic cues.
Prior research has prescribed a method for a formal, grammatical analysis of appraisals of design processes, products and the people doing the design [15]. That method has
been used to analyze the way language is structured to adopt attitudinal stances in accounts of design experience [15, 16]. In this research, we modify the method to understand the preference-making taken by a design text’s authors in relation to expressing preference toward a design alternative and attributes. In coding linguistic appraisals expressing preference and utility in design text, the analysis is not looking for merely subjective statements. Rather, the interest is in how the language of appraisal is functioning as expressing judgments, that is, whether the designer’s attitude is positive or negative about an alternative or attributes related to an alternative. To illustrate the explicit registration of the semantic resources for appraisal as they relate to expressing preference and an associated qualitative measure of utility, consider the following clauses.
This is the design concept. This is not a good design concept. This is a terrible design concept.
It seems that this is a terrible design concept. This design concept is very light.
The first clause is not an appraisal as it does not negotiate an attitude toward the design concept; it is an existential clause. The second clause is an appraisal , which uses the semantic resource of Attitude (good) to express the author’s position toward the concept. The author’s position is characterized by the use of the semantic resource of Orientation, and it is negative. The negative orientation is explicitly marked using the semantic resource of Polarity (not). The third clause invokes a larger negative orientation by using the semantic resource of Graduation through the force of the word terrible as opposed to merely not good. The fourth clause slightly “uncommits” from the appraisal by using the semantic resource of Engagement (It seems that), which makes use of heteroglossia (leaving open the potential to negotiate with the reader). This is also an example of a modal verb of probability (such as must, could) that could express the chance of an event occurring. All three of these clauses express the author’s preference toward the design concept as a utility, wherein with these examples the utility descends from ‘low’ (not a good) to ‘lowest’ (terrible) to ‘somewhere in between’ (it seems that). The last clause appraises the design concept in relation to an implied attribute (weight) and expresses the utility of the attribute (very light).
As these sample clauses illustrate, the semantic resources of the system of APPRAISAL can be used to characterize linguistic realizations of the alternatives and attributes, the author’s preference toward them, and qualitative utility. Any design text can thus be parsed to extract the lexicalized concepts to identify the alternatives and their attributes and then the preference and utility of the alternatives and the attributes. The job of the qualitative analyst is thus to code texts for appraisals and then to code the appraisals for ongoing expressions of preference as driving the decision-making during the design process.
The following notation is used in the discussion of the linguistic analysis:
N: total number of design alternatives in the design selection problem
T: total number of time intervals dn: the nth design alternative; 1 ≤ n ≤ N
D: the vector of all design alternatives, D = {d1, d2, … , dN}
μi: the preference value of a design alternative in time interval i, 0 ≤ μ ≤ 1
μi (dn): the preference value of a design alternative dn in time interval i
πi: the most preferred design alternative in time interval i
M: total number of attributes associated with the design alternatives
αm: the mth design alternative; 1 ≤ m ≤ M
Q: the vector of all attributes, Q = {α1, α2, … , αM} θi : most preferred attribute at time interval i
θn,i : the n-th most preferred attribute at time interval i υi (αm): the preference value of attribute αm in time interval
i
µi(dn)(αm): the preference value (utility) of alternative dn with respect to attribute αm
++ (--): increasing (decreasing) utility
This notation is used to model that a design alternative dn or attribute αm is the most preferred one in time interval i, given the utterance data in time interval i. The linguistic analysis proceeds in four steps, which we describe alongside sample data from the Case Study (to be described later):
1. Identify an appraisal clause in the text, following the method prescribed by Dong et al. [15].
This clause uses the semantic resources of Graduation (most) and Engagement (seems).
(i=41) Glass Coffee Carafe seems (Engagement/Heteroglossia) to have the most (Graduation/Force) capacity.
2. Identify if the clause contains an alternative, an attribute, or both. Based on the rules of analysis in the system of TRANSITIVITY, an alternative is generally specified as the Carrier in a relational clause and is realized as a noun or nominal group. The attribute is the Attribute participant in the relational clause and can also be realized in the semantic resource of Attitude in the APPRAISAL system.
The sample clause is a relational clause, given the verb have, and the attribute (of the coffee pot) appears as a Participant in the relational clause.
(i=41) Glass Coffee Carafe seems (Engagement/Heteroglossia) to have (Relational) the most (Graduation/Force) capacity (Attribute)
3. Identify the preference toward or away from an alternative or attribute based on the expression of utility. The utility will be realized in the semantic resource of Graduation, Orientation, Polarity and Engagement.
The preference for capacity is trending toward higher levels of storage capacity (most capacity).
4. Identify the preference value as increasing (decreasing) utility toward the alternative or attribute, and whether an alternative or attribute is the most preferred at that time interval.
The preference value is increasing (most) despite the hedging (seems). We can qualitatively designate the increase as:
µ41(d1)++ (preference for alternative d1 is
increasing)
µ41(d1)(α7)++ (preference for alternative d1 along
attribute α7 (=capacity) is increasing)
4.2 Method 2: Preferential Probabilities extracted from design team Transcripts (PPT)
Preferential Probabilities from Transcripts (PPT) is a probabilistic method for assessing preference-related information from unstructured group design discussion. This method assumes that designers use language during design discussion that reflects their design process and can thus provide insights into their rationale and preferences [17, 18]. Preferential Probabilities from Transcripts (PPT) extracts preferential probabilities from the language generated during design team discussion. A detailed explanation of the formulation of PPT can be found in [19] and will only be described at a high level in this paper. Additional discussion of the steps of PPT can be found in [20]. PPT approximates the likelihood a design alternative will be “most preferred” based on what a design team says during a discussion. The transcript of the design team’s discussion is divided into time intervals that allow observation of how preferential probabilities change over time. It is implicit in PPT that what design team members say to each other during a design discussion largely corresponds with what they think [21].
PPT employs two basic models: the Preference Transition Model, which describes a relationship between what designers think from one time interval to the next, and the Utterance-Preference Model, which describes a relationship between what designers say and think within the same time interval. These two models are extracted from transcripts of team discussion and then used to predict latent preference data.
The approach for deriving PPT from the transcript follows 6 steps:
1. Analyze the word occurrences of all design alternatives and synonyms in a transcript of a design team’s discussion.
2. Construct an initial utterance-preference model and a preference transition model with hidden parameters. The utterance-preference model describes the likelihood the most-preferred alternatives and the less-preferred alternatives will be uttered in a discussion. The preference transition model describes how likely a most-preferred alternative is to change in the next interval.
3. Estimate reasonable initial parameters for the utterance-preference model and the preference transition model.
4. Apply the two models to predict preferential probabilities.
5. Apply a traditional Expectation-Maximum (EM) algorithm [22] to re-estimate the parameters of the two models with the utterance data and predicted preference data.
6. Iterate on Steps 4 and 5 until the hidden parameters of the models converge. As the EM algorithm improves the likelihood of the occurrences of the utterance data at each iteration [23], parameters are guaranteed to converge.
In applying PPT, it is assumed that designers do not change their preferences for a set of design alternatives within one time interval. Furthermore, preferences can only be changed at the transitions between time intervals.
4.3 Baseline: Preferential Probabilities extracted from design team Surveys (PPS)
APA and PPT are both methods that draw on the transcripts of design team discussion to determine preferences. A more traditional strategy to elicit preferences from both individuals and teams is a survey [24]. In this study, a design team was surveyed periodically to elicit individual and team ratings and rankings for a set of design alternatives. These preferences were used to establish a baseline for comparison with APA and PPT. However, raw survey ratings and rankings are not in a form that is readily comparable to APA or PPT. This study uses a method called Preferential Probabilities extracted from Surveys (PPS) to translate ratings and rankings into preferential probabilities. This approach is drawn from the principle of maximum entropy [25, 26] so that surveyed preferential probabilities can be compared with those found using PPT. The principle of maximum entropy is chosen because it provides the least biased distribution for the given information. This method does not assume a distribution a priori. The distribution and parameters are calculated while maximizing information entropy so that it does not have any unknown parameters. The approach also considers the boundary constraint while applying the principle of maximum entropy, which generates distinctive distributions for different stated ratings.
Details of the derivation of PPS are given in [27] and are briefly summarized here. Additional description of the steps of
PPS can be found in [28]. PPS assumes preference ratings can be random for both the individuals providing the rankings and the team overall, and applies the principle of maximum entropy to both the individual survey ratings and the team’s ratings. Through simulation, statistical results are collected for estimating the preferential probabilities.
PPS includes three main steps:
1. Construct a probability distribution for each individual’s rating preference for each alternative 2. Construct a probability distribution for the team’s
rating preference for each alternative
3. Generate team preferential probabilities through simulation
4.4 Case study
To demonstrate the application of the analysis method, we used data from a case study on the selection of a design alternative. This case study was reported on previously in [29]. This case draws on a design team of three engineering graduate students at a major university on the West Coast of the United States. One participant was a Mechanical Engineer with 7 years of work experience, one was an Electrical Engineer with 2 years of work experience, and the third was a Mechanical Engineer without any work experience.
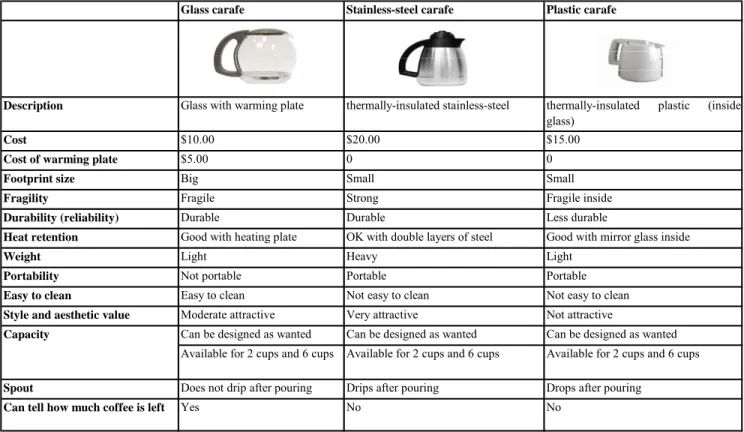
The team’s task (below) was to choose a carafe and filter for a coffeemaker, each with three possible design alternatives. Note that in this paper, only the transcript statements regarding the carafe were analyzed:
Imagine you are a retired person who is a coffee connoisseur. Your day cannot begin until you make coffee each morning for you and your spouse. You are in good health but are not as strong or mobile as you were when you were younger. As a connoisseur, you prefer fresh ground coffee to instant coffee like Folger’s, and you are well informed about the various types of gourmet coffee available, as well as the tools and equipment to prepare it. However, you are now on a fixed income and are conscious about how you spend your money which is why you make coffee at home rather than visit Peet’s every morning.
The team was told that the total cost for the carafe and filter could not exceed $35. Prior to the experiment, each participant was trained using a think-aloud exercise to practice saying each alternative using its proper name (“glass carafe” or “glass pot”) rather than an ambiguous pronoun (“this” or “that”) in order to facilitate the tracking of design alternatives in the transcript. During the experiment, they discussed their preferences and rationale with each other until a consensus was reached. This discussion was audio- and video-recorded and then transcribed. Table 1 lists the three alternatives for the carafe (glass, stainless-steel, and plastic) along with additional features and specifications that might play a role in their preferences for the carafe.
During the same exercise, participants were asked to fill out surveys approximately every 10 minutes with their preference ratings for design choices. The experiment lasted 50 minutes, including 10 minutes for instruction and training, and
Glass carafe Stainless-steel carafe Plastic carafe
Description Glass with warming plate thermally-insulated stainless-steel thermally-insulated plastic (inside
glass)
Cost $10.00 $20.00 $15.00
Cost of warming plate $5.00 0 0 Footprint size Big Small Small Fragility Fragile Strong Fragile inside Durability (reliability) Durable Durable Less durable
Heat retention Good with heating plate OK with double layers of steel Good with mirror glass inside
Weight Light Heavy Light
Portability Not portable Portable Portable
Easy to clean Easy to clean Not easy to clean Not easy to clean Style and aesthetic value Moderate attractive Very attractive Not attractive
Can be designed as wanted Can be designed as wanted Can be designed as wanted Available for 2 cups and 6 cups Available for 2 cups and 6 cups Available for 2 cups and 6 cups
Spout Does not drip after pouring Drips after pouring Drops after pouring
Can tell how much coffee is left Yes No No Capacity
8 minutes for filling out 5 surveys during the session. Paper-based surveys were completed individually. Each team member was asked to provide an optional, brief rationale for their rating and ranking to decrease the possibility of arbitrary ratings.
Research on how groups engage in discussion suggests that members begin a discussion with only partial, independent knowledge of a topic. Group discussion can then play a role in eliciting this incomplete knowledge so that better decisions may be made [30]. In order to encourage discussion among the group members as well as better simulate a more realistic team experience, information about the design choices was provided in the following ways. First, team members were individually provided with detailed information about one of the three alternatives (for example, only the glass carafe), thus simulating a partial knowledge scenario. Team members would then discuss product features as a group in order to uncover additional information about the other alternatives (the stainless steel and plastic carafes).
5 RESULTS
5.1 APPRAISAL Preference Analysis
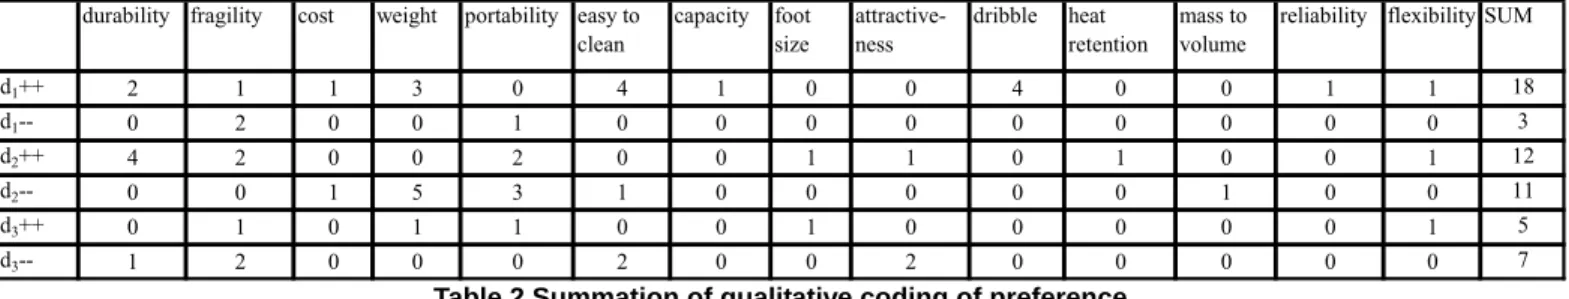
The entire case study transcript was first coded following the method prescribed above. In the summation (Table 2) of the qualitative data, a ranking of the alternatives is identified by summing up the number of increases (++) and decreases (--) assigned to an alternative for a given attribute. No weighting factors are assigned to any of the attributes. By comparing the frequencies of ++ and -- between alternatives (last column of Table 2), it is possible to determine that alternative d1 is the preferred alternative because there are more attributes for which d1 receives more ++ than any of the other alternatives
and the least number of decreasing utility values. Thus, at the level of alternatives, the group is behaving rationally. However, the team is not always consistent in their evaluation of the alternatives and the attributes. Alternative d1 is given one
Appraisal 6 -1 7 -7 4 -5 Cum. Appraisal 6 -1 7 -7 4 -5 Net Appraisal Avg. Appraisal Appraisal PPT PPT Avg. Rating PPS Appraisal 6 0 5 0 0 -2 Cum. Appraisal 12 -1 12 -7 4 -7 Net Appraisal Avg. Appraisal Appraisal PPT PPT Avg. Rating PPS Appraisal 6 -2 1 -2 0 0 Cum. Appraisal 18 -3 13 -9 4 -7 Net Appraisal Avg. Appraisal Appraisal PPT PPT Avg. Rating PPS Time interval Method
Alternatives for Carafe
Glass Steel Plastic
1 5 0 -1 0.714 0.000 -0.111 0.615 0.270 0.114 0.864 0.129 0.006 0.533 0.367 0.100 0.659 0.322 0.019 2 11 5 -3 0.846 0.263 -0.273 0.652 0.329 0.019 0.962 0.036 0.002 0.533 0.333 0.133 0.679 0.271 0.050 3 15 4 -3 0.714 0.182 -0.273 0.860 0.086 0.054 0.886 0.098 0.016 0.989 0.010 0.000 0.700 0.200 0.100
Table 3 APPRAISAL PPT, PPT, and PPS values (italicized and highlighted in yellow)
durability fragility cost weight portability easy to clean capacity foot size attractive-ness dribble heat retention mass to volume
reliability flexibility SUM
d1++ 2 1 1 3 0 4 1 0 0 4 0 0 1 1 18 d1-- 0 2 0 0 1 0 0 0 0 0 0 0 0 0 3 d2++ 4 2 0 0 2 0 0 1 1 0 1 0 0 1 12 d2-- 0 0 1 5 3 1 0 0 0 0 0 1 0 0 11 d3++ 0 1 0 1 1 0 0 1 0 0 0 0 0 1 5 d3-- 1 2 0 0 0 2 0 0 2 0 0 0 0 0 7
increasing value of utility for attribute α2 (fragility) and 2
decreasing values, and 4 increasing values for attribute α6
(“easy to clean”) and one decreasing. Either the team is negotiating their evaluations or is uncertain about their evaluations.
5.2 Comparison of APA with PPT
Table 3 shows the key values for APA PPT, PPT only, and PPS. To show how APA is converted into a form that can be compared to PPT and PPS, the table also includes the row-by-row results of each step in the conversion APPRAISAL, beginning with the raw appraisal values (both positive and negative), the cumulative sum of appraisal values over consecutive time intervals, the net sum of the appraisal values, and the average of the appraisal values (net sum divided by total appraisal count). The PPT method is then applied to the appraisal count. Positive appraisals are treated as word frequencies. Negative appraisals are divided by the number of other alternatives to fairly distribute the negative references. The result is shown as APPRAISAL PPT. PPT values based on word frequency appear in the next row. Note that these values were calculated in another paper [19] and are included here for comparison purposes. The next row lists the normalized rating values of designers gathered from students, followed in the next row by their converted PPS values. Note here that the PPS values originally appeared in [27]. This table shows that the calculated values for APPRAISAL PPT and PPT all have the same rank ordering for the three carafe choices.
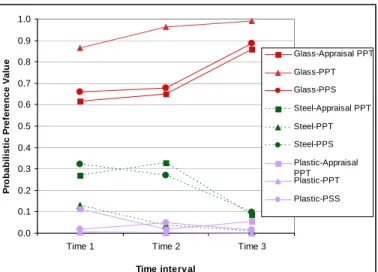
Figure 1 is a plot of the values of APPRAISAL, APPRAISAL PPT, and PPS given in Table 3. While the numeric values for all APPRAISAL PPT, PPT, and PPS are not the same, the trends between the three methods are generally similar. All three methods show the glass carafe as being the most preferred choice in all three time intervals, the steel carafe as the second choice in all intervals, and the plastic carafe as the lowest ranked choice throughout the discussion. This is also consistent with a qualitative reading of the transcript.
0.0 0.1 0.2 0.3 0.4 0.5 0.6 0.7 0.8 0.9 1.0
Time 1 Time 2 Time 3
Time interval P ro b a b il is ti c P re fe re n c e V a lu e Glass-Appraisal PPT Glass-PPT Glass-PPS Steel-Appraisal PPT Steel-PPT Steel-PPS Plastic-Appraisal PPT Plastic-PPT Plastic-PSS
Figure 1: Time variation of preferences toward alternatives
The Pearson correlations between these three sets of data are shown in Table 4. The p-values calculated for these correlations are given in Table 5 and indicate that the correlations are very strong, with p-values < 0.005.
Avg. Appraisal Net Appraisal Appraisal PPT PPT PPS Avg Rating Avg. Appraisal - 0.911 0.906 0.833 0.888 0.891 Net Appraisal - - 0.924 0.915 0.919 0.908 Appraisal PPT - - - 0.947 0.990 0.978
Table 4: Pearson correlation between preference extraction methods Avg. Appraisal Net Appraisal Appraisal PPT PPT PPS Avg Rating Avg. Appraisal - 0.001 0.001 0.005 0.001 0.001 Net Appraisal - - 0.000 0.001 0.001 0.001 Appraisal PPT - - - 0.000 0.000 0.000
Table 5: p-values for correlations
5.3 Analysis of design attributes using APA
A similar analysis can be done for the attributes to determine the rank ordering of attributes, i.e., which is the most important attribute, which is the least important attribute. The team has a brief two-minute discussion of the ranking of the attributes at 22 min 51 sec into the discussion. For example:
(i=92) Cost is the most (Graduation/Force) important (Attitude/Appreciation) thing.
υ90(α1)++
θ90 = α1
(i=95) My opinion is the durability and easy to clean, because they drink it, like everyday. The durability probably may (Engagement/Monogloss) be very (Graduation/Force) important (Attitude/Appreciation).
υ95(α2)++
These are summarized in Table 6, which includes the appraisal value (utility) for an attribute when it is evaluated independent of an alternative (the Appraisal row) and the appraisal value for an alternative when it is evaluated in relation to an attribute (the rows d1, d2 and d3). For each time interval, Table 6 shows the cumulative appraisal values for each attribute in one row, followed by the rank of the attribute compared to the 13 others based on its cumulative value. The next row, Qualitative Reading Rank, orders attributes that are based on implied appraisals. In generals, APA is applied only to explicit references to an alternative or attribute. However, it was found that attributes are often unclear or implied in the
transcript. To address this, the transcript was read with the intent to identify such implied references to attributes. These were ranked and are included in the table. Next, the table shows the raw word count for the attribute.
The coffeemaker carafe included 14 attributes: durability, fragility, cost, weight, portability, “easy to clean”, capacity, foot size, attractiveness, dribble, heat retention, mass to volume, reliability, and flexibility. Note that these attributes are not the same as the ones that appear in Table 1. Table 1’s attributes were defined a priori. The 14 attributes described here were identified during the process of APPRAISAL Preference Analysis. There is some overlap between these two sets of attributes (“cost”), but also some divergence, including the “mass to volume ratio.”
When the attributes were evaluated independently, that is, when the team evaluated their preferences toward the attributes independent of the alternatives, the rank ordering of the attributes identified based on the above analysis showed that cost and fragility are the most important attributes, followed by durability, weight and “easy to clean”. Four of the attributes, dribble, mass to volume, reliability, and flexibility, are evaluated alongside each alternative in the transcript, that is, these attributes are used to evaluate alternatives, but there is no explicit evaluation of these attributes. Note however that the “dribble” attribute is evaluated (discussed) 4 times for alternative d1, suggesting that this attribute, while not explicitly
evaluated on its own, may be quite important. Finally, while cost is the most important attribute, the cost is evaluated only once each for alternative d1 and d2. Such a finding suggests that
frequency counts alone of alternatives assessed against attributes would be insufficient to ascertain the preference for an alternative and the importance of an attribute; linguistic knowledge of the appraisal (rank ordering) of the attributes is
needed.
Next, we analyzed the preferences toward the alternatives in relation to their rank ordering of attributes to determine if their choice of most preferred alternative followed their preference for most important attribute(s). While cost is the most important attribute, it is the least often discussed attribute in relation to an alternative. In contrast, the evaluation of the alternatives along the attributes of durability, fragility and weight are more frequently discussed, suggesting that there is some level of uncertainty about the values of these attributes for these alternatives or the rank ordering of the alternatives along these attributes.
6 DISCUSSION
The PPT values calculated based on APA and PPT based on subject frequency counts agreed with each other and with PPS. This means that, in this case, language is a reliable source of data about designer preferences and that it is possible to model preference from language both qualitatively and formally. That the PPT calculation based the subject frequency counts turns out to be reliable is somewhat intuitive, but a limitation of PPT is that it currently does not offer context for those words. It is impossible to know whether a reference reflects a positive or negative sentiment. For example, subject frequency could either signal a strong interest in a particular alternative, and hence the design team would discuss its merits, or that the design team is uncertain about a particular alternative, and hence needs to negotiate its preference ranking. In the second case, it is more likely, though, that the design team would discuss a more preferred alternative more frequently than an alternative that the team could easily discard. In other words, if it were straightforward for the team
Time
interval Method durability fragility cost weight portability easy to clean capacity foot size attractive-ness dribble heat retention mass
to vol. reliability flexibility
d1 +1 +1 0 +1 -1 0 +1 0 0 0 0 0 +1 +1 d2 +1 +1 -1 -5 +2 -1 0 +1 0 0 +1 0 0 +1 d3 -1 -2 0 +1 +1 -1 0 +1 -1 0 0 0 0 +1 Appraisal +1 0 +2 +1 +1 +1 +1,-1 -1 0 0 0 0 0 0 Appraisal Rank 2 6 1 2 2 2 6 6 6 6 6 6 6 6 Qual. Read Rk - - 1 - - - -Word count 11 5 20 13 12 4 6 3 1 0 1 0 1 1 d1 +1 +1 0 +1 -1 +3 +1 0 0 +3 0 0 +1 +1 d2 +3 +3 -1 -5 +2 -1 0 +1 +1 0 +1 0 0 +1 d3 -1 -2 0 +1 +1 -2 0 +1 -2 0 0 0 0 +1 Appraisal +3 +5 +4 +1 +1,-1 +1 +1,-1 -1 -1 0 +1 0 0 0 Appraisal Rank 3 1 2 4 7 4 7 13 13 7 4 7 7 7 Qual. Read Rk 2 3 1 4 - 4 - - - -Word count 21 20 35 18 13 15 6 3 7 6 2 0 1 1 d1 +2 +1,-2 +1 +3 -1 +4 +1 0 0 +4 0 0 +1 +1 d2 +4 +3 -1 -6 +2 -1 0 +1 +1 0 +1 -1 0 +1 d3 -1 -2 0 +1 +1 -2 0 +1 -2 0 0 0 0 +1 Appraisal +3 +5,-1 +4 +1 +1,-1 +1 +1,-1 -1 -1 0 +1 0 0 0 Appraisal Rank 3 1 1 4 - 4 - - - -Qual. Read Rk 2 3 1 3 - 3 - - - -Word count 24 24 52 20 13 21 6 3 7 7 2 0 1 1 1 2 3
to agree upon the most preferred alternative, they would not need to discuss it much. Conversely, if the team could easily discard an alternative, they would also not discuss it. It is the alternative that is preferred by some but possibly not by others, or the alternative for which the attributes are least certain, that would likely elicit the most discussion. In this experiment, that the design team generally preferred the glass carafe meant that the design team was likely ‘extolling’ its merits. However, we would argue caution in extrapolating that subject frequency would always be a reliable indicator of strong preference. On the other hand, the strength of APA is that it seems to be a reliable indicator of preference, particularly when the design team members use the semantic resource of Graduation/Force to ‘scale up’ the size of the evaluation, e.g., most, lightest, least, etc.
Another consequence of relying primarily on subject counts for determining PPT is the possibility of missing references to a subject that are only implied and not explicitly uttered in discussion. In this case example, participants were trained to use the proper name for the subject (“glass carafe”) rather than a more general pronoun (“that thing”). However, in practice, people often refer to subjects implicitly or ambiguously. This is a well known problem in the field of natural language known as anaphora. Further, often the context is needed to understand the implied appraisal and its appetitive or aversive orientation, such as when the team discusses the alternatives in relation to how the elderly would use it. For example, one designer says, “So because it is an old guy, maybe weight.” Explicitly, the evaluation of the attribute weight is not clear, but given that elderly would more likely prefer lightweight objects, the orientation of the appraisal of the of importance of the attribute of weight would be positive.
The main limitation of the APA method is that it cannot deal with implicitly stated evaluations, particularly those evaluations that rely on context or engineering or ‘common knowledge’. For example, the appraisal (t)he glass carafe drops easily is an evaluation of the physical ergonomics. However, an object that is ‘easy to drop’ is generally not desirable (unless perhaps the object is a toy in which the objective is to be able to hold onto the object). Yet, the negative evaluation is not directly evident from the language of the APPRAISAL. While the method itself picks up the evaluation, through the semantic resource of Attitude/Judgment (easily), the Orientation of the appraisal and the subsequent determination of the increasing or decreasing utility value must be assigned by the qualitative analyst. Otherwise, the main advantage of the APA method is that the coding is prescribed rigorously and can track the increase or decrease in the preference value for an alternative or attribute.
Where the design team ‘flip-flopped’ between increasing and decreasing preference values for an alternative or for an attribute may signal some form of argumentation or negotiation. While these are different labels attached to a form of discourse, the more important engineering issue is that the design team may be uncertain about its choice of an alternative
or about an attribute associated with an alternative; hence the need for extended discussion. Future work will take this into account in the formal modeling of preference and uncertainty based on the APA coding so that the most preferred alternative and most preferred attribute can be calculated, alongside with any uncertainty in the preference. Such information can then be used to make suggestions for the most rational decisions or to compare the group’s final decision to the calculated most rational decision based on the discussion of preferences and uncertainty.
7 CONCLUSIONS
This paper presented two linguistically-based methods, APA and PPT, to derive preferences from the communication between designers selecting one alternative from three options given a specified set of attributes. The results from the two methods agree with each other and with a survey-based elicitation method, suggesting that language can be a reliable source of data about design team preference. Further work is needed to improve the APA method to be able to address the weighting of preferences and to assign a probability distribution around preferences. The challenge will lay in figuring out how the various semantic resources for APPRAISAL could be modeled formally, that is, the magnitude by which levels of Graduation decrease the uncertainty and by which level of Engagement increase the uncertainty. Future work on PPT should focus on extracting additional contextual information, such as positive and negative attitudes towards a subject that can be used to improve the quality of preferential probability assessment. A formal method like PPT may also benefit greatly from an initial pass of qualitative coding such as the APA method to provide a richer, more nuanced basis for preference extraction. These two approaches, quantitative and qualitative, combined together may likely offer a better strategy for analyzing and understanding the language of preference in design. Resolving these matters will allow us to develop a more complete means for formally modeling preference and uncertainty from language to better support optimal decision-based design.
These methods are part of a broader effort to understand how engineers make choices under uncertainty. Such knowledge can be applied toward understanding, for example, the influence of risk propensity during innovative design, e.g., how engineers handle risk during innovative design. To answer this question, we need to develop new methodologies to elicit decisions and preference information from engineers to understand whether their choices lead to different inferences about their risk attitudes. In other words, this research is about accounting for behavior by producing models that best explain their behavior. There are multiple models of choice under uncertainty, including expected utility theory and prospect theory. Knowing how designers actually make decisions and which model best explains their behavior would allow us to develop more useful tools for decision-based design.
ACKNOWLEDGEMENTS
The work described in this paper was supported in part by the National Science Foundation under Award CMMI-0900255. This research was also supported in part under Australian Research Council's Discovery Projects funding scheme (project number DP1095601). The opinions, findings, conclusions and recommendations expressed are those of the authors and do not necessarily reflect the views of the sponsors.
REFERENCES
[1] Pugh, S., 1991, Total Design: Integrated Methods for Successful Product Engineering, Addison-Wesley, Wokingham, England.
[2] Akao, Y., 1990, Quality Function Deployment, Productivity Press, Cambridge, MA.
[3] Wood, K. L., and Antonsson, E. K., 1989, "Computations with Imprecise Parameters in Engineering Design - Background and Theory," Journal of Mechanisms Transmissions and Automation in Design-Transactions of the ASME, 111(4), pp. 616-625.
[4] Lewis, K. E., Chen, W., and Schmidt, L. C., 2006, "Decision Making in Engineering Design," ASME Press, New York.
[5] Mcalpine, H., Hicks, B. J., Huet, G., and Culley, S. J., 2006, "An Investigation into the Use and Content of the Engineer's Logbook," Design Studies, 27(4), pp. 481-504.
[6] Yang, M. C., Wood, W., and Cutkosky, M., 2005, "Design Information Retrieval: A Thesauri-Based Approach for Reuse of Informal Design Information," Engineering with Computers, 21(2), pp. 177-192.
[7] Tyhurst, J. J., 1986, Knowledge-Based Expert Systems for Manufacturing, ASME Press, New York.
[8] Nikolay, A., Anindya, G., and Panagiotis, G. I., 2007, "Show Me the Money!: Deriving the Pricing Power of Product Features by Mining Consumer Reviews," ACM, San Jose, California, USA.
[9] Wang, J., 1997, "A Fuzzy Outranking Method for Conceptual Design Evaluation," International Journal of Production Research, 35(4), pp. 995-1010.
[10] Li, W., and Jin, Y., 2006, "Fuzzy Preference Evaluation for Hierarchical Co-Evolutionary Design Concept Generation," ASME Conference Proceedings, 2006(4255X), pp. 31-41.
[11] Scott, M. J., and Antonsson, E. K., 1999, "Arrow's Theorem and Engineering Design Decision Making," Research in Engineering Design, 11(4), pp. 218-228.
[12] Kohrs, A., and Merialdo, B., 2000, "Using Category-Based Collaborative Filtering in the Activewebmuseum," the 2000 IEEE International Conference on Multimedia and Expo, 1(pp. 351-354.
[13] Halliday, M. A. K., 2004, An Introduction to Functional Grammar, Arnold, London.
[14] Martin, J. R., and White, P. R. R., 2005, The Language of Evaluation: Appraisal in English, Palgrave Macmillan, New York.
[15] Dong, A., Kleinsmann, M., and Valkenburg, R., 2009, "Affect-in-Cognition through the Language of Appraisals," Design Studies, 30(2), pp. 138-153.
[16] Kleinsmann, M., and Dong, A., 2007, "Investigating the Affective Force on Creating Shared Understanding," ASME Press, New York.
[17] Dong, A., 2006, "Concept Formation as Knowledge Accumulation: A Computational Linguistics Study," Artificial Intelligence for Engineering Design, Analysis and Manufacturing, 20(1), pp. 35-53.
[18] Yang, M. C., Wood, W. H., and Cutkosky, M. R., 2005, "Design Information Retrieval: A Thesauri-Based Approach for Reuse of Informal Design Information," Engineering with Computers, 21(2), pp. 177-192.
[19] Ji, H., Yang, M. C., and Honda, T., 2007, "A Probabilistic Approach for Extracting Design Preferences from Design Team Discussion," Las Vegas, Nevada, USA.
[20] Ji, H., Yang, M. C., and Honda, T., 2008, "Ppt: A Probabilistic Approach to Extract Preferential Probabilities from Design Team Transcripts," Technical Report No. TR-2008A, Massachusetts Institute of Technology, Cambridge, MA.
[21] Cross, N., Christiaans, H., and Dorst, K., 1996, Analysing Design Activity, Wiley, Chichester.
[22] Dempster, A., Laird, N., and Rubin, D., 1977, "Maximum Likelihood from Incomplete Data Via the Em Algorithm," Journal of the Royal Statistical Society, Series B, 39(1), pp. 1-38.
[23] Bilmes, J. A., 1998, "A Gentle Tutorial of the Em Algorithm and Its Application to Parameter Estimation for Gaussian Mixture and Hidden Markov Models. Technical Report," Technical Report No. TR-97-021, International Computer Science Institute, Berkeley, CA, USA.
[24] Packard, D. J., 1979, "Preference Relations," Journal of Mathematical Psychology, 19(3), pp. 295-306.
[25] Jaynes, E. T., 1968, "Prior Probabilities," IEEE Transactions On Systems Science and Cybernetics, sec-4(3), pp. 227-241.
[26] Jaynes, E. T., 1957, "Information Theory and Statistical Mechanics," Physical Review, 106(4), pp. 620-630.
[27] Ji, H., 2008, "Extraction of Preferences from Early Stage Engineering Design Team Discussion," Doctoral, University of Southern California, Los Angeles, CA, USA.
[28] Ji, H., Yang, M. C., and Honda, T., 2008 "Example for Implementating Pps: Preferential Probabilities Translated from Survey under Principle of Maximum Entropy," Technical Report No. TR-2008B, Massachusetts Institute of Technology, Cambridge, MA.
[29] Yang, M. C., and Ji, H., 2007, "A Text-Based Analysis Approach to Representing the Design Selection Process," Proc. International Conference on Engineering Design, ICED07, Paris, France.
[30] Gigone, D., and Hastie, R., 1997, "The Impact of Information on Small Group Choice," Journal of Personality and Social Psychology, 72(1), pp. 132-140.