HAL Id: hal-00851248
https://hal.inria.fr/hal-00851248
Submitted on 20 Dec 2017
HAL is a multi-disciplinary open access archive for the deposit and dissemination of sci-entific research documents, whether they are pub-lished or not. The documents may come from teaching and research institutions in France or abroad, or from public or private research centers.
L’archive ouverte pluridisciplinaire HAL, est destinée au dépôt et à la diffusion de documents scientifiques de niveau recherche, publiés ou non, émanant des établissements d’enseignement et de recherche français ou étrangers, des laboratoires publics ou privés.
human repetitive sequences.
Béatrice Horard, Angéline Eymery, Geneviève Fourel, Nikita Vassetzky,
Jacques Puechberty, Gérard Roizes, Kevin Lebrigand, Pascal Barbry, Aurélie
Laugraud, Christian Gautier, et al.
To cite this version:
Béatrice Horard, Angéline Eymery, Geneviève Fourel, Nikita Vassetzky, Jacques Puechberty, et al.. Global analysis of DNA methylation and transcription of human repetitive sequences.. Epigenetics, Taylor & Francis, 2009, 4 (5), pp.339-50. �10.4161/epi.4.5.9284�. �hal-00851248�
Half of the human genome consists of repetitive DNA sequences. Recent studies in various organisms highlight the role of chromatin regulation of repetitive DNA in gene regula-tion as well as in maintainance of chromosomes and genome integrity. Hence, repetitive DNA sequences might be potential “sensors” for chromatin changes associated with pathogen-esis. Therefore, we developed a new genomic tool called RepArray. RepArray is a repeat-specific microarray composed of a representative set of human repeated sequences including transposon-derived repeats, simple sequences repeats, tandemly repeated sequences such as centromeres and telomeres. We showed that combined to anti-methylcytosine immunoprecipi-tation assay, the RepArray can be used to generate repeat-specific methylation maps. Using cell lines impaired chemically or genetically for DNA methyltransferases activities, we were able to distinguish different epigenomes demonstrating that repeats can be used as markers of genome-wide methylation changes. Besides, using a well-documented system model, the thermal stress, we demonstrated that RepArray is also a fast and reliable tool to obtain an overview of overall transcriptional activity on whole repetitive compartment in a given cell type. Thus, the RepArray represents the first valuable tool for systematic and
genome-wide analyses of the methylation and transcriptional status of the repetitive counterpart of the human genome.
Introduction
The human genome is burdened with repetitive sequences, while less than 2% of nucleotide sequence code for proteins.1 Repetitive
sequences may be simple repeats such as DNA satellites, that are found commonly in pericentromeric and subtelomeric heterochro-matin, or transposable elements found interspersed throughout the genome (see Suppl. Table 1). Because of their high level of sequence homology, repetitive sequences can potentially mediate genomic rearrangements through illegitimate recombination or formation of unusual DNA structure during DNA replication, repair or meiosis (review in ref. 2). Additionally, although most of the transposable element copies are degraded and thus inactive, some remains actively mobile in the human genome and become mutagenics by “jumping” into genes (review in refs. 3–7).
Due to their involvement in numerous genetic disorders, DNA repeats were initially presumed to be parasitic DNA.8,9
However, over the years, evidences accumulated supporting a role as a reservoir of regulatory functions at gene and whole genome level (review in refs. 10 and 11). Repetitive sequences are often packaged into silent chromatin due to the combined action of DNA methylation and/or histone modifications (review in refs. 2, 12 and 13). Furthermore, evidences from different systems suggest a critical role for transcription across repeats in shaping transcriptome profile and genome architecture (review in refs. 11, 14 and 15). Also, studies in organisms ranging from fission yeast to mammals have shown that non-coding RNAs transcribed from DNA repeats might serve as “guides” for heterochromatin assembly across large chromosomal domains
*Correspondence to: Béatrice Horard; Laboratoire de Biologie Moléculaire de la Cellule; UMR CNRS 5239; ENS Lyon; Université Lyon 1; HCL, 46 allée d’Italie, 69364 Lyon Cedex 07 France; Email: bhorard@ens-lyon.fr/ Eric Gilson; Laboratoire de Biologie Moléculaire de la Cellule; UMR CNRS 5239; ENS Lyon; Université Lyon 1/ HCL, 46 allée d’Italie, 69364 Lyon Cedex 07 France; Email: egilson@ens-lyon.fr
Submitted: 05/04/09; Accepted: 06/17/09
Previously published online as an Epigenetics E-publication: http://www.landesbioscience.com/journals/epigenetics/article/9284
Research Paper
Global analysis of DNA methylation and transcription of human
repetitive sequences
Béatrice Horard,1,* Angéline Eymery,2 Geneviève Fourel,1,† Nikita Vassetzky,3 Jacques Puechberty,4,‡ Gérard Roizes,4
Kevin Lebrigand,5,6 Pascal Barbry,5,6 Aurélie Laugraud,7 Christian Gautier,7 Elsa Ben Simon,1 Frédéric Devaux,8
Frédérique Magdinier,1 Claire Vourc’h2 and Eric Gilson1,*
1Laboratoire de Biologie Moléculaire de la Cellule UMR CNRS 5239; ENS Lyon; Université LYON 1; HCL; Lyon, France; 2Université Joseph Fourier; Institut Albert Bonniot
INSERM U823; La Tronche, Grenoble, France; 3Engelhardt Institute of Molecular Biology, Russian Academy of Sciences; Moscow, Russia; 4Institut de Génétique Humaine
UPR CNRS 1142; Montpellier, France; 6Université de Nice Sophia Antipolis, 5Institut de Pharmacologie Moléculaire et Cellulaire UMR CNRS 6097; Sophia Antipolis, France; 7PRABI/Laboratoire de Biométrie et Biologie Evolutive UMR CNRS 5558; Université LYON 1; Villeurbanne, France; 8Laboratoire de Génétique Moléculaire UMR CNRS
8541; ENS; Paris, France
†Present address: INSERM ADR Rhône-Alpes; Auvergne, C.H. Vinatier; Bron, France
‡Present address: Centre de Référence “Anomalies du Développement et Syndromes Malformatifs,” Service de Génétique Médicale, C.H.R.U. Hôpital Arnaud de Villeneuve;
Montpellier, France
Key words: human repetitive DNA, microarray, epigenetic, DNA methylation, non coding transcripts
Long primers probes corresponding to a fragment within a satel-lite repetitive unit or over the LTR or UTR or internal segments of various transposons were derived from the identified conserved region (Table 1 and Suppl. Table 3). The oligonucleotide probes were designed using OligoArray2.0 software22,23 with defaults
parameters. An antisense probe was then deduced from each sense probe. Additionally, thirteen control probes including unique sequences from Arabidopsis thaliana, Drosophila melanogaster,
Bacillus subtilis, Escherichia coli, Nicotiana tabacum, Photonis pyralis
were added on the array as negative controls.
Probes were arrayed as duplicate in a random order to minimize the possibility that a geometric artifact during array hybridization would be incorrectly interpreted. The strategy offers a cluster analysis of repeats but does not allow the detection of differences that may be present at one particular chromosomal locus. Indeed, a particular hybridization signal will represent the mean status of all individual elements within one repeat family subgroup.
Specificity and sensitivity of printed array. In all the
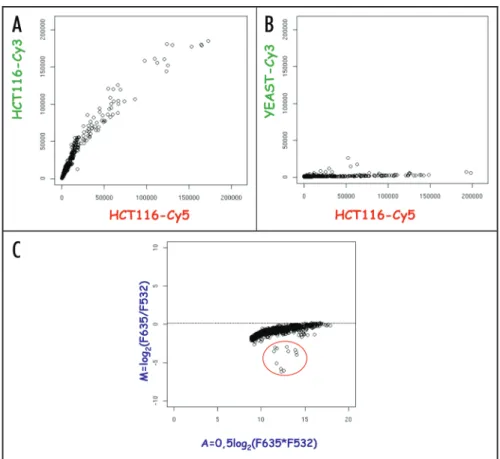
experi-ments described herein we used comparative hybridization of genomic representations prepared in parallel. The major chal-lenge of the RepArray is the generation of hybridization signals that are sufficiently intense, specific and quantitative to detect depleted or enriched representations. In order to evaluate whether our method of probe design and selection is valid to give a good signal-to-noise ratio, we labeled fragmented genomic DNA and hybridized it in a two-color experiment. Graphing the Cy5 hybridization intensities of each probe versus the Cy3 ones reveals that probes give an acceptable signal-to-noise ratio (Fig. 1A). Since some probes account for 50 copies in the genome while other can account for 5 x 10⁷ copies, we observed large amplitude of signal
intensity. Therefore, each array was scanned at three different PhotoMultipliersTubes (PMT) settings (Low, Median and High). In order to correlate the measurements over a wide range of inci-dental light intensities we developped a linear predictive model (Suppl. Methods 1).
In the validation assay, almost 70% of the probes exhibited a satisfying signal-to-noise ratio (Flags ± 0 and SNR635 and SNR532 > 3). Inspection of blank spots showed uniform low intensities as expected (data not shown). In addition, probes speci-ficity was demonstrated in a dual color hybridization experiment using human genomic representation labeled with Cy5 versus a distant eukaryote representation such as S. cerevisiae labeled with Cy3. As expected, all probes failed to exhibit elevated intensity signals in the yeast genomic representation (Fig. 1B).
For further validation, “enriched” representations were prepared by spiking human genomic DNA with a ten molar excess of a plasmid containing one copy of the megasatellite D4Z4 in the labeling reaction.24 Probes that we predict to display higher
inten-sity in the enriched-representation are grouped on the lower part of a MAplot illustration (Fig. 1C). Among the differential signals, we found the expected four spots (duplicated sense and anti-sense) corresponding to the D4Z4 oligonucleotide, but also four spots corresponding to the probes of LSau repeat present within D4Z4,25 and the four negative control spots for LacZ since the
plasmid we used in this assay contains a LacZ reporter gene. Thus, (review in refs. 15 and 16). Finally, repetitive DNA are
essen-tial in the maintenance of chromosome function and genome integrity at specific domains such as centromeres and telomeres (review in refs. 2, 10 and 17).
Disruption of the tigtht equilibrium that keeps DNA repeats under control might be a source of genome instability and genome dysregulation. Consistently, hypomethylation of both highly and moderately repeated DNA is frequently observed in cancer (review in ref. 18). This hypomethylation likely facilitates chromosomal rearrangements and unwanted transcription by cis- or trans-effects, and is believed to contribute to disease onset and/or progression. Advances in the understanding of the epigenetic mechanisms that regulate the repetitive DNA sequences may thus contribute to elucidate their specific action in processes such as malignant transformation.
Our ability to interrogate chromatin structure over large chromosomal domains has been transformed in the past few years thanks to the development of chromatin assays combined to microarrays (ChIP-chip) or more recently to deep sequencing technologies (ChIP-Seq). However, technologies aimed at inves-tigating the relationship between epigenetic changes and/or transcription and repetitive sequences are currently limited. First, precise repositioning of pulled-down DNA repeats in tiling arrays remains intricate due to the high sequence homologies. Also, DNA repeats, especially tandem satellites, are highly suscep-tible to biais in PCR-based approach such as high-throughtput sequencing. Consequently, most genome-wide analyses designed so far for mapping of chromatin marks or regulatory sequences tend to ignore repetitive elements. Here, we report a novel DNA microarray, named RepArray, allowing a systematic and comprehensive analysis of all the main families of repetitive DNA sequences found in the human genome. We show that the use of RepArray coupled to DNA methylation immunoprecipitation (MeDIP) distinguishes three related epigenomes. We also validate the ability of RepArray to analyze transcription profiles of DNA repeats by comparing the repeat expression in cells before and after a thermal stress, a situation known to trigger the transcription of at least a subset of repetitive sequences.19,20
Results
RepArray overview and procedure. We designed 236
oligo-nucleotides corresponding to various basic repeats found in the human genome. DNA repeats can be clustered into distinct fami-lies each traceable to a closely related group or to a single ancestral sequence (Table 1 and Suppl. Table 1). Prototypic sequences of each repeat subfamily were extracted from RepBase Update21
or from Genbank databases. Sequence similarity searches were conducted against the complete human genome using the Fasta algorithm. A conserved region specific for each subfamily was inferred from alignment of the 50 most similar sequences in order to maximize the probability to detect most if not all the members of each repeat family using a single oligonucleottide target. Indeed, most elements in a family are sufficiently similar in DNA sequence that most copies present throughout the genome are expected to efficiently anneal to the consensus sequence present on the array.
5-aza-2'deoxycytidine (5-azadC) provided another opportunity to validate our assay.29 Both the genetic and the pharmacological
strategies were reported to result in global DNA hypomethylation of the HCT116 cells.28,30-32
Methylated DNA was fractionated using an antibody that specifically recognize 5-methylcytosine and cohybridized with total genomic DNA to the array.26 In all cases, sufficient amount
of material was obtained after pull-down to allow direct microarray hybridization without PCR amplification. For each array’s hybrid-ization, raw feature intensities were used to determine log2 ratios using MeDIP intensity in the numerator and the total DNA this successful simulation predicts the power of the array to detect
copy-number alterations of a probe.
Methylation analysis of repetitive elements using RepArray.
In order to draw a global picture of the methylation status of repetitive elements in a given cell type we combined the methylated-DNA immunoprecipitation (MeDIP) methodology26
with our repeat-specific microarray. As test samples, two cell lines were used: HCT116, a human colon carcinoma cell line presenting a high level of CpG islands methylation27 and DKO, a
cell line derived from HCT116 in which DNA methyltransferases 1 and 3b were disrupted.28 DNA methyltransferase inhibitor
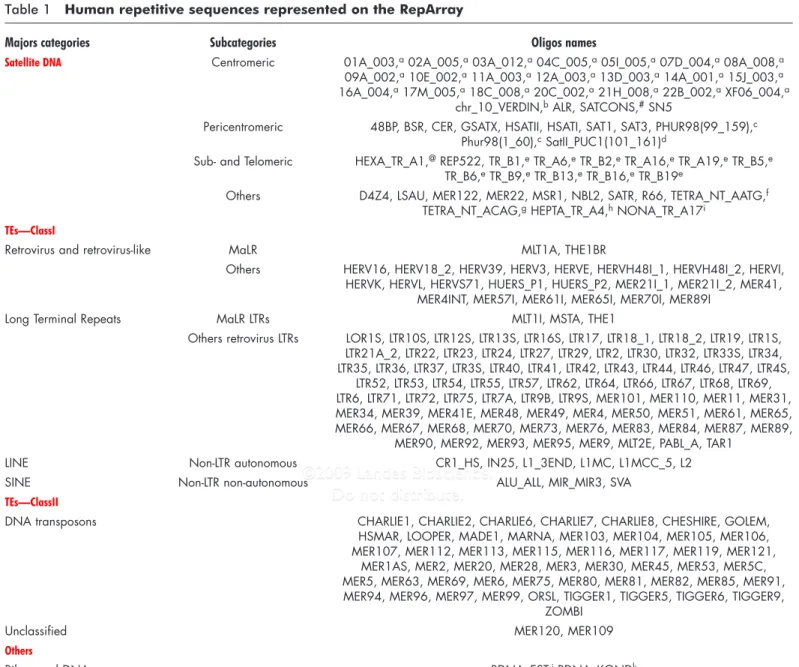
Table 1 Human repetitive sequences represented on the RepArray
Majors categories Subcategories Oligos names
Satellite DNA Centromeric 01A_003,a 02A_005,a 03A_012,a 04C_005,a 05I_005,a 07D_004,a 08A_008,a
09A_002,a 10E_002,a 11A_003,a 12A_003,a 13D_003,a 14A_001,a 15J_003,a
16A_004,a 17M_005,a 18C_008,a 20C_002,a 21H_008,a 22B_002,a XF06_004,a
chr_10_VERDIN,b ALR, SATCONS,# SN5
Pericentromeric 48BP, BSR, CER, GSATX, HSATII, HSATI, SAT1, SAT3, PHUR98(99_159),c
Phur98(1_60),c SatII_PUC1(101_161)d
Sub- and Telomeric HEXA_TR_A1,@ REP522, TR_B1,e TR_A6,e TR_B2,e TR_A16,e TR_A19,e TR_B5,e
TR_B6,e TR_B9,e TR_B13,e TR_B16,e TR_B19e
Others D4Z4, LSAU, MER122, MER22, MSR1, NBL2, SATR, R66, TETRA_NT_AATG,f
TETRA_NT_ACAG,g HEPTA_TR_A4,h NONA_TR_A17i
TEs—ClassI
Retrovirus and retrovirus-like MaLR MLT1A, THE1BR
Others HERV16, HERV18_2, HERV39, HERV3, HERVE, HERVH48I_1, HERVH48I_2, HERVI, HERVK, HERVL, HERVS71, HUERS_P1, HUERS_P2, MER21I_1, MER21I_2, MER41,
MER4INT, MER57I, MER61I, MER65I, MER70I, MER89I
Long Terminal Repeats MaLR LTRs MLT1I, MSTA, THE1
Others retrovirus LTRs LOR1S, LTR10S, LTR12S, LTR13S, LTR16S, LTR17, LTR18_1, LTR18_2, LTR19, LTR1S, LTR21A_2, LTR22, LTR23, LTR24, LTR27, LTR29, LTR2, LTR30, LTR32, LTR33S, LTR34, LTR35, LTR36, LTR37, LTR3S, LTR40, LTR41, LTR42, LTR43, LTR44, LTR46, LTR47, LTR4S,
LTR52, LTR53, LTR54, LTR55, LTR57, LTR62, LTR64, LTR66, LTR67, LTR68, LTR69, LTR6, LTR71, LTR72, LTR75, LTR7A, LTR9B, LTR9S, MER101, MER110, MER11, MER31, MER34, MER39, MER41E, MER48, MER49, MER4, MER50, MER51, MER61, MER65, MER66, MER67, MER68, MER70, MER73, MER76, MER83, MER84, MER87, MER89,
MER90, MER92, MER93, MER95, MER9, MLT2E, PABL_A, TAR1
LINE Non-LTR autonomous CR1_HS, IN25, L1_3END, L1MC, L1MCC_5, L2
SINE Non-LTR non-autonomous ALU_ALL, MIR_MIR3, SVA
TEs—ClassII
DNA transposons CHARLIE1, CHARLIE2, CHARLIE6, CHARLIE7, CHARLIE8, CHESHIRE, GOLEM,
HSMAR, LOOPER, MADE1, MARNA, MER103, MER104, MER105, MER106, MER107, MER112, MER113, MER115, MER116, MER117, MER119, MER121,
MER1AS, MER2, MER20, MER28, MER3, MER30, MER45, MER53, MER5C, MER5, MER63, MER69, MER6, MER75, MER80, MER81, MER82, MER85, MER91, MER94, MER96, MER97, MER99, ORSL, TIGGER1, TIGGER5, TIGGER6, TIGGER9,
ZOMBI
Unclassified MER120, MER109
Others
Ribosomal DNA RDNA_EST,j RDNA_KONDk
Oligos names are listed according to their affiliation and nomenclature in Repbase Update database except for sequences referring to some satellite DNA:achromosome-specific subsets of human alphoid DNA were
designed with the first number referring to the chromosome,bchromosome 10 alpha satellite DNA corresponding to a preferential integration site for HIV virus,64#Human alpha satellite DNA consensus as defined
by Vissel and Choo,65 c clone pHuR 98, a variant satellite 3 sequence, specific to chromosome 9qh,66 d clone Sat_II Puc 1a variant of satellite II from chromosome 1q,67 @ telomere-specific hexanucleotide (TTAGGG)
n,68 e = subtelomeric minisatellites found at 1kb to 840 kb of the telomeric tract, f(AATG)n simple repeat, g(ACAG)n simple repeat, h(AACAAAAC)n simple repeat, i(TTTTGTTTG)n simple repeat, j5’end of the 28S
component of ribosomal DNA,69kribosomal DNA.70
116 cells the vast majority (72%) of hypermethylated repeats are tandem satellites in particular those constitutive of pericentromeric and subtelomeric domains. In contrast, centromeric alphoid satel-lites are largely excluded from methylated classes. Only a small fraction of transposable elements are hypermethylated (1.5%), most show intermediate methylation (71%).
We next examined the DNA methylation profiles in 5-azadC treated HCT116 and DKO cells. HCT116 cells treated with the demethylating agent 5-azadC display a global reduction in the average methylation level (Fig. 4A and B). The overall level of DNA demethylation was even more dramatic in DKO compared to the 5-azadC-treated cells (Fig. 4A and B). Most importantly, the hypermethylation of DNA repeats detected in HCT116 was absent in DKO cells and most sequences were defined as unmethylated. Individual results were validated by real time polymerase chain reaction with specific primer pairs and confirmed that the array measurement accurately reflects the enrichment in the MeDIP procedure (Fig. 4D).
In order to assess differences in methylation profiles between cell lines, we carried out pairwise comparisons of all probes. We observed a significant methylation loss for a subset of repeats intensity in the denominator. Thereby, larger
values represent high level of methylation. The overall quality of individual hybridizations was assessed by inspection of the signal-to-noise ratios for each array. Data were collected from at least four independent biological assays including one dye swap. A non-parametric Friedman’s analysis of variance was performed on each cell line specific dataset to control the coherence between the different hybridization attempts (data not shown). Both sense and antisense populations display similar DNA methylation profiles. Subsequent analysis can thus be performed either on the methylation mean value of one strand or after averaging values from both strands (Suppl. Fig. 1A–D). In the present study, analyses were performed on averaged values from both strands.
To ensure that hybridization signals are not simply a consequence of non-specific enrichment of certain repeats during the immu-noprecipitation procedure, we systematically processed the DNA samples in a mock immu-noprecipitation (IgG-IP) and both experimental MeDIP and mock samples were separately hybridized to the same genomic DNA sample used as a reference. A reduced dimension projection obtained by principal component analysis (PCA) of each MeDIP and its mock counterpart datasets, revealed the specificity of the method. As illustrated in Figure 2, distinct clusters encompass data derived from mock and MeDiP samples respectively in each cell line tested. Nevertheless, a substantial overlapping between mock and DKO MeDIP samples was
observed, in compliance with the idea that DKO cells display a markedly depleted DNA methylation level at hundred loci.
A reduced dimension projection obtained by principal compo-nent analysis (PCA) of each specific MeDIP datasets revealed the capacity of the array to delineate different methylation patterns. Indeed, the HCT116 specific methylation profile detected differs from the one of the DKO and 5-azadC-treated (AZA) cells (Fig. 3). However, the three clusters are closely related suggesting a partial overlap in methylation profiles between the methyltransferases knockout, 5-azadC treated and the parental HCT116 cells.
To explore the underlying patterns of repeats methylation we categorized sequences based on mean methylation enrichment values obtained on the array (defined by log2 (MeDIP/input) ratios). According to a previous work,33 we defined three separate
groups: (1) no methylation (log2 ratio < -0.4); (2) hypermethyla-tion (log2 ratio > 0.4) and (3) intermediate-methylated (0.4 > log2 ratio > -0.4) sequences (Fig. 4A and B). Although the common concept is that the majority of repetitive elements are heavily methylated in post-natal somatic tissues,34 only a small subset of
sequences (6%) showed strong MeDIP enrichment in HCT116 (Fig. 4A and Suppl. Fig. 1B). As illustrated in Figure 4B, in HCT
Figure 1. Array and Probes validation. (A and B) Representative scatter plots of raw signal intensities measured on RepArray in dual color experiment. Synthetic values of fluorescence intensities are plotted, y axis = Cy3 versus x axis = Cy5. A) Colon carcinoma HCT116 DNA cell line versus itself. B) HCT116 DNA versus S. cerevisiae DNA. C) Array simulation using an «enriched» representation. The enriched representation consists of HCT116 DNA spiked with recombinant pDY01 plasmid that contains a D4Z4 repeat juxtaposed to a LacZ expression cas-sette (a gift from D. Gabellini). On a MA plot, 12 spots stand apart from the bulk thus conveying differential signals. The negative M-values correspond to the expected enrichment for sense and antisense D4Z4, LSau and LacZ probes in the «enriched» representation.
rich in transposable elements and clustered repetitive elements at centromeres and telomeres has been described in several systems.36-40 Since a high-throughput, accurate and easily
acces-sible technique, is not yet available, we tested the capacity of our array for profiling expression of repeat-derived transcripts.
As test samples, we used an already well-documented cellular model: heat-shock stressed HeLa cells which show transcriptional activation of specific pericentromeric heterochromatic domains in response to thermal and chemical stresses.19,20 We analyzed
the pool of transcripts from HeLa cells upon heat shock stress and compared to the unstressed counterpart. For each repeat, the relative transcriptional activity upon heat shock compared to unstressed HeLa cells was determined from the mean log2 ratios of raw intensity from replicated probes subsequently to normalization.
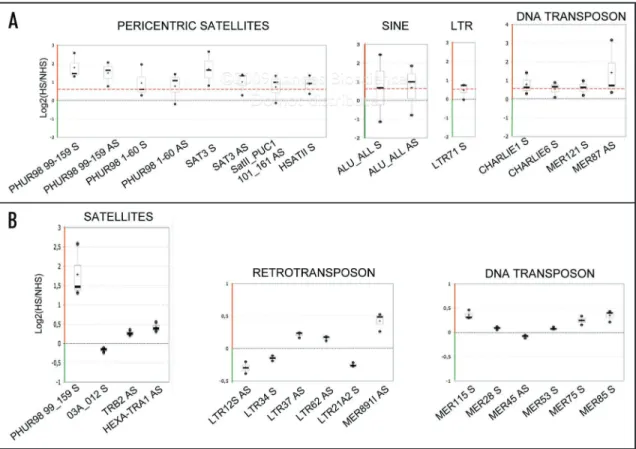
Differential expression was discriminated through a simple fold change cut-off with the criterion that the average fold change in the three samples was larger than 1.5. In agreement with previous reports,19,20,41,42 we found an upregulation of pericentromeric
satellites transcription upon thermal stress (Fig. 5A and Suppl. Fig. 2). While tandem satellites III and II were clearly overex-pressed, satellites I were almost unaffected. Several reports based on northern blot indicate that satellite III transcription is highly asym-metrical and that most of the transcripts contain the G-rich strand of the repeat.19,20 However, another report42 indicates that heat
shock stimulates satIII transcription on both strands, although to different extents and with different kinetics. Indeed, expression of C-rich RNAs initially parallels that of G-rich molecules and is maximal at the end of 1 hr heat shock while the abundance of G-rich transcripts dramatically increases and peaks after 1 hr hour of recovery from stress.42 In agreement with these previous
obser-vations, we detected large proportion of both sense and antisense transcripts across satellite repeats at the end of heat-shock.
Using the same cut-off filter, we also observed a substantial increased expression of several interspersed DNA repeats including DNA transposons and SINEs such as Alu (Fig. 5A). This latter observation is consistent with several reports indicating a transient stimulation of Alu transcription in response to a variety of stress including heat shock (review in ref. 43).
One-sample T-statistic analysis (cut-off p value <0.05) also revealed several other sequences presenting changes in their in DKO and 5azadC-treated cells compare to the parental line
(Suppl. Table 2). Based on T-statistic results we grouped probe sequences into three distinct classes (Fig. 4C and Suppl. Table 2): Class I, repeats largely demethylated by the methyltransferases knockout (DKO) and partially affected by 5-azadC; Class II, largely demethylated by both DKO and 5-azadC treatment and Class III, essentially unaffected in DKO and 5-azadC treatment. We did not observe sequences demethylated by drug treatment but not affected in DKO. Although some repeats tend to be significantly demethylated only in DKO and listed as Class I, they systematically present an intermediate MeDIP enrichment upon 5-azadC treatment (Fig. 4C). Real time PCR analysis on these sequences revealed that while the absolute enrichment values were variable, all individual MeDIP experiments showed the same trends of methylation level reduction upon 5-azadC treatment (Fig. 4C and D). In summary, our PCR analyses suggest a more widespread effect of 5-azadC on repetitive DNA sequences than T-statistic analysis of the microarray data.
Profiling repeat-associated transcripts using microarray-based approach. RNA profiling studies revealed that transcription
is widespread throughout the genome including noncoding domains.35 Furthermore, unexpected PolII association and
transcription of noncoding RNAs from heterochromatic domains
Figure 2. Comparison of MeDiP and mock hybridization profiles establishes the method specificity. Principal Component Analysis (PCA) displays the cor-relations in datasets by compressing informations in a low number of dimensions. Individual hybridization attempts are represented by dots and ellipses delineating variability inside a dataset are drawn. Partial overlapping of PCA projections might be due to non-specific enrichment of certain sequences in the mock samples or on the contrary to the relatively low abundance of some sequences in the MeDiP samples such as for the DKO cell lines. ns = non specific i.e., IgG immunoprecititation as blue ellipse, s = MeDIP as green ellipse.
Figure 3. The MeDIP/RepArray approach delineate three epigenomes. The graph represents PCA exploration performed on a minimum of four independent hybridizations, including one dye swap, for each cell line. Three distinct clusters encompass the datasets derived from HCT116 (red ellipse), 5azadC-treated (blue ellipse) and DKO (green ellipse) cells.
Figure 4. Comparison of methylation profiles in HCT116, HCT116 treated with 5-azadC (AZA) and HCT116 -DNMT1,3b knockout (DKO) cell lines. (A) Representation of estimated DNA methylation level (mean log2 ratios from replicates). MeDIP enrichment of a target is a function of its methylation rate and also of its CpG content.t Based on the observations from Weber and colleagues, we predicted that log2 ratio > 0.4 might be indicative of heavy
methylation whatever the CpG content of the target (hypermethylation group). Log2 ratio < -0.4 indicates a strong hypomethylation irrespective of the CpG density (no methylation group) and (0.4 > log2 ratio > -0.4) corresponds either to sequences showing high CpG density but low rate of methyla-tion or sequences displaying relatively high level methylamethyla-tion owing to low CpG content (intermediate methylamethyla-tion group). A small propormethyla-tion of repeats was categorized as hypermethylated in HCT116 and repeats are mostly classed in the intermediate methylation group. Upon treatment with 5-azadC or knockout of DNA methyltransferase activities, we observed an increased proportion of unmethylated sequences. (B) Relative frequency of repeats among the unmethylated, hypermethylated and intermediately methylated groups defined in (A) in HCT116, 5-azadC-treated HCT116 (AZA) and DKO cell lines. Alpha = alphoid DNA; peric = pericentromeric sat I, II and III, telo= telomeric and subtelomeric satellites ; others = others satellites DNA, retrovirus = TEs ClassI, LTR-retrotransposons, LTR = TEs ClassI, Long Terminal Repeats ; LINE= TEs ClassI, autonomous Non-LTR_retrotransposons ; SINE = TEs ClassI, Non autonomous Non-LTR-retrotransposons; DNA transposons = TE ClassII; rDNA = ribosomal DNA. (C) Box plots show DNA methylation levels of repetitive DNA sequences identified as statistically differentially methylated in HCT116’s, 5-azadC-treated’s and DKO’s genomes. Here, black thick line marks the median, lower and upper limits of the box mark the 25th and 75th percentiles, and lower and upper horizontal lines mark the 10th and 90th percentiles. The dashed lines represent log2(MeDIP/Input) = 0 ratios. P values were calculated using student t-test (* indicates p < 0.05), for complete list of sequences identified as differentially methylated in a pairwise comparison test see supplementary Table 2. Target sequences were grouped in three distinct classes. Class I = sequences demethylated by methyltransferases knockout but slightly affected by 5-azadC treatment (non-significant p-value), illustrations are tandem (D4Z4) and dispersed (solitary LTRs such as LTR72, endogenous retrovirus HERV-L family such as HERV18-2, HERV-R family such as HERV3) repeats. Class II = sequences affected both by methyltransferases knockout and 5-azadC treatment such as tandem pericentromeric satel-lites (satelsatel-lites II (satII_puc1) and satelsatel-lites III (PhUR) families). Class III = sequences apparently not affected neither by methyltransferase knockout nor 5-azadC. This class includes highly repetitive elements (SINEs (Alu_all)), and sequences presenting low level of methylation in the parental cell lines [LINEs (L1_3’end)]. (D) Validation by sequence-specific real time PCR of DNA methylation status on MeDIP samples. As controls, PCR were performed on promoter sequences with a methylation profile in HCT116, DKO and 5-azadC-treated HCT116 cells already described in the litterature (ICR H19, RASSF1 and RARbeta 63,30). Means ± s.d. of experimental replicates are shown.
Figure 5. Transcription profiling using the repeat-specific microarray. (A) Box plots show transcriptional upregulation upon heat shock of repetitive sequences identified using a simple fold change filter (1.5 fold change cut-off illustrated as a dashed red line) in HeLa. In addition to juxtacentromeric satellites SatII and SatIII, we observed an upregulation of Alu elements and several DNA transposons. Transcriptional difference are expressed as log2(HS/NHS) ratios averaged from duplicated features arrayed. HS = 1 hour heat shock; NHS = non-heat shocked HeLa cells. (B) Comparison of the mean score of each sequence to the population mean via one-sample T statistic (cut-off p value < 0.05) revealed sixteen repeats presenting reproducible expression changes relative to the underlying noise. Additionally to the pericentromeric satellites (PHUR-98_99) which harbor the strongest upregulation, we observed a modest expression change of telomeric tracks (HEXA_TR_A1 probe) but also LTR-retrotransposons, retroviruses and DNA transposons. Plotted are the sequences presenting statistically significant differences in their expression. In each array’s hybridization, log2 ratios were averaged from duplicated features; distribution of log2 ratios of individual repeats in three independent arrays is graphed as boxplots.
in HCT116. This might be explained by the fact that HCT116 is a cancer cell line displaying a lower 5-methylcytosine content respective to normal colon tissue.27,47 Besides, a previous report
demonstrates that MeDIP enrichment at a given region depends both on the degree of methylation and on the density of CpGs.33
Consequently, a modest enrichment around the median can repre-sent either a low percentage of methylated cytosine in a sequence with a high CpG content or a high relative methylation level owing to low or median CpG content. Recently, new algorithm that can estimate absolute DNA methylation levels from MeDIP-based experiments was developped.48 Although this new algorithm
performs well on a large proportion of the genome, it is still diffi-cult to assess absolute DNA methylation level using the Bayesian deconvolution strategy on MeDIP-chip data for repeated elements which might differ in CpG density between individual repeats.48
Some repeats failed to display the high level of methylation previously described in HCT116. These discrepancies may be due to inherent assay differences. For instance, methylation of alpha satellite tandem repeats was initially reported based on Southern blot assays45 whereas, in agreement with our data, a
real-time PCR-based methylation assay also failed to detect a high level methylation.32 We found that most of the retroviruses
and solitary LTRs display modest methylation enrichment while high level of methylation has been previously described for some endogenous retrovirus LTRs.49,50 Nevertheless, the same reports
demonstrate that methylation state of solitary- or proviral-LTR are not homogeneous throughout the genome.49,50 The relatively
low average methylation level we observed probably reflects the complexity of methylation patterns in a given retrovirus or LTR family. In agreement with previous reports28,51,52 we observed
that abundant repetitive elements such as LINE-1 or Alu retro-elements are not strongly methylated in cancer cell lines such as HCT116. Of course, this demethylation observed on a global scale does not exclude high level of methylation for some isolated DNA repeats.
Second, demethylation of repetitive sequences to various extend was observed upon modification of the methyltransferase activity, indicating a critical function for DNMT1 and DNMT3b in methylation of repetitive sequences in somatic tissues. However, methyltransferase knockout affects a fraction of the repeat fami-lies, while some sequences remain moderately methylated (~15%). Similar to previous findings, we observed a severe satellite II hypomethylation in the DKO cells.28,32 Consistent with D4Z4
demethylation observed in naturally occuring DNMT3b mutants, we also found hypomethylation of this repeat in DKO.53 The
significant reduced rDNA promoter methylation observed in DKO cells confirms previous finding that both DNMT1 and DNMT3b are essential to maintain methylation profile of this multiple-copy locus.46 In contrast, we could not detect a strong
hypomethylation of Alu repeats in DKO cells compared to the parental cell line as previously described.28,32 The unexpected
absence of overwhelming Alu demethylation might be linked to a relatively low number of completely unmethylated Alu sequences in DKO compare to the parental HCT116. Alu elements are indeed highly polymorphic and subdivided into several specific transcription. Indeed, we observed modest up or downregulation
of several non-pericentric satellites, retrotransposons and DNA transposons (Fig. 5B). In this respect and in agreement with a recent work using FISH probes,39 we detected a modest
overex-pression of telomeric transcripts upon thermal stress. Since our results corroborate previous observations using other approaches, one can considere that the sequences we identified via fold change cut-off filter and T-statisitic constitute good candidates for further investigations relative to thermal stress transcriptomic.
Discussion
Although full genome sequencing has provided precise maps of repetitive sequences in the human genome,1 their transcriptional
and epigenetic states remain poorly defined on large scale. Indeed, because of their nature the repetitive sequences are largely ignored in genome-wide scanning strategies. Here, we validated a novel micro-array designed for screening epigenetic changes in repetitive DNA sequences named RepArray. In a first theme, we used this tool to delineate the methylation changes occurring on repeated sequences upon genetically or pharmacologically-induced hypom-ethylation in human cells.
As a proof-of-principle, we demonstrate that a MeDIP/ RepArray analysis allowed to distinguish the epigenome of WT HCT116 colon carcinoma cells from the ones of HCT116 doubly KO for DNA methyltransferases 1 and 3b or treated with 5-azadC. Importantly, it should be emphasized that the probe used for RepArray hybridization does not require a PCR amplification step. Indeed, existing PCR-based approaches used to amplify pull-down material in exponential fashion are highly susceptible to bias. Consistently, we (data not shown) and others44 observed that
PCR procedures modify the relative abundance of some repeats especially tandem satellites such as centromeric, pericentromeric and subtelomeric ones.
As RepArray depicts the average DNA methylation level over a given repeat class, we cannot predict the behavior of “solitary” repetitive element in a given chromatin environment but rather the relative prevalence of a particular pattern of DNA methylation. The strongest feature of the RepArray platform is to simultaneously provide information on the relative epigenomic states of hundreds of repetitive sequences through the analysis of a restricted number of targets. This stands in contrast to a linear approach which would consist in “walking” on large portion of the genome and would require the analysis of hundreds of thousand of features. The RepArray can be used on a routine basis as a first lecture to detect putative alterations in the epigenetic status of repetitive DNA.
The outcome of this initial analysis demonstrates several powerful features of repeat detection using RepArray. First, in agreement with previous reports we detected methylation over a large range of DNA repeats in the HCT116 cell line chosen as an experimental model.32,45,46 These sequences include tandem
satellites repeats SatII, SatIII, tandem megasatellite D4Z4, some subtelomeric minisatellite, dispersed sequences such as Alu, retro-viral and solitary LTR-retrotransposons and also ribosomal DNA repetitive sequence. However, a large proportion (63%) of DNA repeats display a modest MeDIP enrichment around the median
is a cancer subtype-specific pattern for differents DNA repeats. Further investigations are also required to elucidate the relation-ship between DNA repeats epigenetic and disease onset and/or progression. In this regard, RepArray will be a useful tool that should extend and complement efforts using gene-specific loci to establish an epigenomic signature of different cellular states.
Materials and Methods
Cell lines and exposure to 5'-aza-2'-Deoxycytidine. Colon
cancer cell line HCT 116 and the double DNMT somatic cell knockout were obtained from B. Vogelstein.28 They were grown
in McCoy’s 5A medium (Invitrogen, France) containing 10% FBS at 37°C. HCT116 cell lines were seeded in culture medium and maintained for 24 h before treatment with a final concentration of 5 μM 5-aza-2'-Deoxycytidine (Sigma-Aldrich, France) for three days. The 5azadC containing medium was renewed every day during the treatment.
Human adenocarcinoma HeLa cells were grown in DMEM medium (Invitrogen, France), 10% FBS serum at 37°C. For heat shock experiments, cell monolayers were incubated for 1 h at 42°C in a warm bath and immediately collected for RNA extraction.
DNA extraction. Genomic DNA was prepared from culture
cells using DNeasy Blood and Tissue Kit according to manufac-turer’s recommendations (Qiagen SA, France). Purity and integrity were determined by gel analysis and spectrophotometry.
MeDIP assay. Genomic DNA was sonicated using a Bioruptor
(Diagenode, Belgium) to produce random fragments of approxi-mately 400 to 1,000 bp. Four micrograms of fragmented DNA is routinely used for a MeDIP assay. However, we found that one μg of fragmented DNA give efficient MeDIP. DNA is denaturated for 10 minutes at 94°C and immunoprecipitated with 10 μl of anti-m5
cytosine rabbit polyclonal antibody overnight at 4°C (Megabase Research Products, Lincoln, USA) as described in Weber et al. 2005.26 A control reaction was prepared using 10 μl of a rabbit
IgG (Sigma-Aldrich, France). The bound fraction was isolated by protein A chromatography and the methylated DNA recovered as described previously.26
Real-time PCR. Real time PCR were carried out using
QuantiTect SYBR Green PCR kit (Qiagen SA, France) on the MXP3000P PCR system (Stratagene, France). Reactions were done in duplicates and standard curves were calculated from serial dilutions (30–0.01 ng) of input genomic DNA. To evaluate the relative enrichment of target sequences after IP, we calculated the difference in cycles between the MeDiP-enriched sample and the input DNA for primer pair of interest and for a control (or back-ground) primer pair. Primer sequences are available upon request.
DNA labeling. A non fluorescent nucleotide analog,
amin-oallyl-dUTP (GE Healthcare, France) was incorporated into MeDIP-enriched or input DNA using a random primed Klenow polymerase reaction in an overnight incubation at 37°C. Cy-3 and Cy-5 fluorophore were then conjugated to aa-dUTP enriched and input DNA, respectively or vice versa, and co-hybridized to the printed arrays.
RNA isolation and targets preparation. Total RNAs were
isolated from control cells and heat shocked HeLa cells using Tri families which show striking differences in their methylation
level.54,55 Alternatively, this non-demethylation of Alu elements in
DKO cells might also suggest that additional methylating activities are involved at those loci. In this regard, the study by Kato et al.56
suggests that mouse sineB1 repeats are preferentially methylated by DNMT3a and DNMT3L enzymes. Additionally, it should be kept in mind that DKO cells are hypomorphs at DNMT1 locus.57
As previously described in CpG island promoters studies, gene disruption of both DNMT1 and DNMT3b altered DNA methylation to a much greater extent than drug treatment.30
Consistently, in our experience only a small number of sequences present statistically significant differences in their methylation profile upon drug treatment compared to the parental HCT116 cell line. One can expect that loss of DNA methylation after drug treatment might be more stochastic than methyltransferases knockout effect and thus promotes heterogeneity within a repeat family. In addition, 5-azadC was also demonstrated to be a potent inhibitor of DNMT1 and DNMT3a, but not of DNMT3b, expression in HCT116.58 It remains thus possible that the de novo
methyltransferases of DNMT3 family proteins function redun-dantly to maintain the methylation state.
In a second theme, we demonstrate that RepArray is a valuable tool to establish the repeats transcriptome. Indeed, the RepArray analysis of the RNA profile of repeats in Hela cells upon thermal stress is consistent with previous works reporting transcriptional activation of pericentromeric satellite repeats upon heat shock.19,41
Interestingly, we also detected a weak expression of several other repeats suggesting that transcriptional reprogramming of DNA repeats in response to stress is not limited to pericentromeric satellites but also concerns other repeat classes such as telomeric satellites, SINEs retroelements and DNA transposons. Our repeat-expression profiling using microarray-based approach provides thus further insight into the transcriptional reprogramming induced in response to thermal stress.
Previous repeat-specific microarray designed for transcrip-tiomic analysis were limited to a specific repeat family such as human endogenous retrovirus.59 In contrast, our repeat-specific
microarray might serve as a very fast and reliable tool to obtain an overview of overall transcriptional activity of the whole repetitive compartment in a given cell type.
Finaly, this study demonstrates that RepArray is a promising and valuable tool since it has the potential to combine DNA methylation and chromatin analysis with transcription pattern. The use of RepArray should considerably enhance our knowledge of epigenome and/or transcriptome maps in human. As such, changes in methylation and transcription patterns over repeti-tive DNA are attracrepeti-tive candidates as diagnostic or prognostic indicators for clinical investigations. Indeed, several examples of disease-related hypomethylation of DNA repeats have been reported.47 However, the etiology and consequence of
disease-associated hypomethylation of repetitive DNA sequences remain largely unknown. The vast majority of investigations only focused on few specific subfamilies of repetitive sequences.60-62 For
cancer-associated DNA hypomethylation for instance, it is still unclear whether there is a repeat subtype-specific pattern or whether there
Printed arrays. Sense and antisense oligonucleotides were made
with solid phase chemistry and printed on commercially prepared silinazed slides (Corning UltraGAPSTm) using a Microgrid TAS
arrayer and pins from Biorotics at The Transcriptome Platform from Biology Department Genomic Service at ENS, Paris—France (www.transcriptome.ens.fr/sgdb/).
Microarray hybridization. Printed microarray slides were
incu-bated in the 42°C prehybridization solution (5x SSC, 0.1% SDS, 1% BSA) for 45 min. After five washes in milliQ H2O, slides were dried spinning 3 min. The hybridization solution consisted of 25% deionized formamide, 5x SCC, 0.1% SDS. Samples were dena-tured for 5 min at 94°C, pipetted onto a slide and incubated for 14–16 h at 42°C in a water bath. After hybridization, slides were washed as follow: 2 min in 1x SSC, 0.2% SDS preheated at 42°C, 2 min in 0.1x SSC, 0.2% SDS, and twice in 0.1x SSC. Hybridized slides were scanned using the GenePix 4000B scanner (Molecular Devices, USA) and the images were analyzed with GenePix Pro 6.0 software package (Molecular Devices, USA).
MeDIP microarray data analysis. Preprocessing of raw data and
statistical analysis were performed using Bioconductor packages (http://www.bioconductor.org/) in R programming environment (http://cran.r-project.org/). The libraries used are limma (www. bioconductor.org/packages/2.2/Software.html), marray (www. bioconductor.org/packages/2.2/Software.html), ade4 (http://pbil. univ-lyon1.fr/ade4 html/00Index.html), gplots (http://cran.r-project.org/web/packages/gplots/index.html). Spots flagged “bad” or “unfound” by the GenePix software were excluded from the subsequent analysis. Ratios of the duplicated spots were aver-aged. For each probes on each individual array, a synthetic value from three different PMT setting scans was computed (Suppl. Method I). Slides were kept into the analysis or not according to quality criteria. Some of these criteria are described in the Supplemental Method I (deviance from the linear model control and flag incoherence check). Moreover, the ratio signal/noise has also been used as a criterion for quality checking and some diag-nostic plots as well. Data frames were generated from the high quality selected data using either log2 ratio of intensity values or rank value assigned to individual probes from the rating of inten-sity values within an individual hybridization attempt. Probes with insufficient data available (>25% of not available value) were removed for subsequent analysis. For each cell lines (HCT116, AZA or DKO) four replicates hybridization data frames were combined to generate a cell line-specific dataset.
Non-parametric Friedman’s analysis of variance allowing the detection of similarities between several permutations (N repli-cates) of objects (k probes) was conducted to statistically control for the variance attributable to the inherent differences among multiple hybridization attempts relative to the variance in indi-vidual probes response. It involves a rank ordering of the k probes within an individual experiment and then, a comparison of the k probe rank sums over the N replicates. Under the null hypothesis, the probe ranks should be distributed in random order for any individual test attempt.
In order to see whether the array can discriminate cell lines according to their methylation profile, Principal Component Reagent (Sigma-Aldrich, France) following the manufacturer’s
protocol. Purity and integrity were determined by gel analysis and spectrometry. Subsequently, fluorescent dye-labeled cDNAs were generated from 7 μg of sample RNA using AminoAllyl cDNA labeling kit according to manufacturer’s recommendations (Applied Biosystem-Ambion, France). Heat shocked and non-heat shocked cDNA were labeled with different dyes and co-hybridized to the printed slides. A total of three arrays were labeled including one dye-swap pair and hybridized.
Probes selection. Most probes were designed on the basis of
the RepBase Update database, a collection of repetitive genomic elements (www.girinst.org/repbase/update/index.html). Each human sequence in the database was compared (FASTA algo-rithm) to the same database to exclude similar repeats (truncations, subfamilies, duplicate annotations, etc…). Some DNA repeats not listed in RepBase Update database (www.girinst.org/repbase/ update/index.html) were extracted from GenBank database (www. ncbi.nlm.nih.gov/Genbank/index.html) using “repeat name and homo sapiens” key words and compared to the human genome database. If more than 50 similar sequences were found, a multiple alignment of the first 50 sequences was generated and the most conserved region was identified. This region was used to design oligonucleotide probes.
Alphoids centromeric chromosome-specific probes were designed on the basis of sequences picked up in GenBank database (www.ncbi.nlm.nih.gov/Genbank/index.html) using “alpha satel-lites and homo sapiens” key words. Sequences containing other non-alpha satellites repetitive sequences or sequences juxtaposed to euchromatin sequences (juxtacentromeric) were excluded from the selection. Individual chromosomal locations were assigned to each selected sequences. Then the 171 bp monomers were cut out from each chromosome-specific sequence and a multiple alignment including also the alpha satellilte consensus (X07685) was gener-ated using Multalin DNA sequences software (http://npsa-pbil. ibcp.fr/cgi-bin/npsa_automat.pl?page=/NPSA/npsa_multalinan. html). The most conserved region for each chromosome-specific monomere was identified and the domains presenting the highest divergence from the other chromosomes were selected to design oligonucleotide probes.
Oligonucleotide probes were calculated using OligoArray 2.0.22,23 This software integrates a BLAST analysis against a
non-redundant set of 289 sequences of interest and probe secondary structure analyses.23 Two-hundred and thrity-six probes were
obtained. The remaining sequences for which no probe was obtained were too short (about 50 nucleotides), and had extreme GC content. Oligonucleotide length was set between 50 and 52-mers, GC percentage between 25 and 65%, melting tempera-ture between 76 and 96°C. For 63 probes, the thresholds for the melting temperature were relaxed to the range 75–100°C. OligoArray 2.0 selected probes with the lowest cross hybridization, the absence of secondary structure and balanced the set of probes in term of melting temperature. Oligonucleotides containing five consecutive A, C, G or T sequences were discarded. The probes were checked not to overlap with the other probes.
References
1. Lander ES, Linton LM, Birren B, Nusbaum C, Zody MC, Baldwin J, et al. Initial sequencing and analysis of the human genome. Nature 2001; 409:860-921.
2. Peng JC, Karpen GH. Epigenetic regulation of heterochromatic DNA stability. Curr Opin Genet Dev 2008; 18:204-11.
3. Mills RE, Bennett EA, Iskow RC, Devine SE. Which transposable elements are active in the human genome? Trends Genet 2007; 23:183-91.
4. Morgan HD, Sutherland HG, Martin DI, Whitelaw E. Epigenetic inheritance at the agouti locus in the mouse. Nat Genet 1999; 23:314-8.
5. Medstrand P, Landry JR, Mager DL. Long terminal repeats are used as alternative pro-moters for the endothelin B receptor and apolipoprotein C-I genes in humans. J Biol Chem 2001; 276:1896-903.
6. Grover D, Kannan K, Brahmachari SK, Mukerji M. ALU-ring elements in the primate genomes. Genetica 2005; 124:273-89.
7. Han JS, Boeke JD. LINE-1 retrotransposons: modulators of quantity and quality of mammalian gene expression? Bioessays 2005; 27:775-84.
8. Orgel LE, Crick FH. Selfish DNA: the ultimate parasite. Nature 1980; 284:604-7. 9. Belancio VP, Hedges DJ, Deininger P. Mammalian non-LTR retrotransposons: for better
or worse, in sickness and in health. Genome Res 2008; 18:343-58.
10. Ugarkovic D. Functional elements residing within satellite DNAs. EMBO Rep 2005; 6:1035-9.
11. Feschotte C. Transposable elements and the evolution of regulatory networks. Nat Rev Genet 2008; 9:397-405.
12. Yoder JA, Walsh CP, Bestor TH. Cytosine methylation and the ecology of intragenomic parasites. Trends Genet 1997; 13:335-40.
13. Slotkin RK, Martienssen R. Transposable elements and the epigenetic regulation of the genome. Nat Rev Genet 2007; 8:272-85.
14. Hasler J, Samuelsson T, Strub K. Useful ‘junk’: Alu RNAs in the human transcriptome. Cell Mol Life Sci 2007; 64:1793-800.
15. Malone CD, Hannon GJ. Small RNAs as guardians of the genome. Cell 2009; 136:656-68.
16. Cam HP, Chen ES, Grewal SI. Transcriptional scaffolds for heterochromatin assembly. Cell 2009; 136:610-4.
17. Blasco MA. The epigenetic regulation of mammalian telomeres. Nat Rev Genet 2007; 8:299-309.
18. Ehrlich M. DNA methylation in cancer: too much, but also too little. Oncogene 2002; 21:5400-13.
19. Jolly C, Metz A, Govin J, Vigneron M, Turner BM, Khochbin S, et al. Stress-induced transcription of satellite III repeats. J Cell Biol 2004; 164:25-33.
20. Valgardsdottir R, Chiodi I, Giordano M, Cobianchi F, Riva S, Biamonti G. Structural and functional characterization of noncoding repetitive RNAs transcribed in stressed human cells. Mol Biol Cell 2005; 16:2597-604.
21. Jurka J. Repbase update: a database and an electronic journal of repetitive elements. Trends Genet 2000; 16:418-20.
22. Rouillard JM, Herbert CJ, Zuker M. OligoArray: genome-scale oligonucleotide design for microarrays. Bioinformatics 2002; 18:486-7.
23. Rouillard JM, Zuker M, Gulari E. OligoArray 2.0: design of oligonucleotide probes for DNA microarrays using a thermodynamic approach. Nucleic Acids Res 2003; 31:3057-62. 24. van Deutekom JC, Wijmenga C, van Tienhoven EA, Gruter AM, Hewitt JE, Padberg GW,
et al. FSHD associated DNA rearrangements are due to deletions of integral copies of a 3.2 kb tandemly repeated unit. Hum Mol Genet 1993; 2:2037-42.
25. Winokur ST, Bengtsson U, Feddersen J, Mathews KD, Weiffenbach B, Bailey H, et al. The DNA rearrangement associated with facioscapulohumeral muscular dystrophy involves a heterochromatin-associated repetitive element: implications for a role of chro-matin structure in the pathogenesis of the disease. Chromosome Res 1994; 2:225-34. 26. Weber M, Davies JJ, Wittig D, Oakeley EJ, Haase M, Lam WL, et al.
Chromosome-wide and promoter-specific analyses identify sites of differential DNA methylation in normal and transformed human cells. Nat Genet 2005; 37:853-62.
27. Paz MF, Fraga MF, Avila S, Guo M, Pollan M, Herman JG, et al. A systematic profile of DNA methylation in human cancer cell lines. Cancer Res 2003; 63:1114-21. 28. Rhee I, Bachman KE, Park BH, Jair KW, Yen RW, Schuebel KE, et al. DNMT1 and
DNMT3b cooperate to silence genes in human cancer cells. Nature 2002; 416:552-6. 29. Jones PA, Taylor SM. Cellular differentiation, cytidine analogs and DNA methylation.
Cell 1980; 20:85-93.
30. Paz MF, Wei S, Cigudosa JC, Rodriguez-Perales S, Peinado MA, Huang TH, et al. Genetic unmasking of epigenetically silenced tumor suppressor genes in colon cancer cells deficient in DNA methyltransferases. Hum Mol Genet 2003; 12:2209-19. 31. Yang AS, Estecio MR, Doshi K, Kondo Y, Tajara EH, Issa JP. A simple method for
estimating global DNA methylation using bisulfite PCR of repetitive DNA elements. Nucleic Acids Res 2004; 32:38.
32. Weisenberger DJ, Campan M, Long TI, Kim M, Woods C, Fiala E, et al. Analysis of repeti-tive element DNA methylation by MethyLight. Nucleic Acids Res 2005; 33:6823-36.
Analysis (PCA) were performed using the ade4 library (http://pbil. univ-lyon1.fr/ade4 html/00Index.html) on rank value assigned to individual probes in each hybridization attempt. Dots represent individual hybridization attempt, two dots in close proximity indicate that the k probes have similar rank values in the two hybridization attempts. Variability of hybridization attempts inside individual datasets (i.e., HCT116-MeDIP dataset, AZA-MeDIP dataset or DKO-MeDIP dataset, etc…) are represented as an ellipse, the length of axes has been arbitrary fixed to 1.5 standard deviation. It should be emphasize that the method is not super-vised and that the discrimination between groups is not an a priori of the analysis.
Two sided t-tests were performed on log2 (F635/F532) ratios data frames to enlight significantly differentially methylated elements between 5-azadC-treated cells (AZA) or DKO compara-tively to the parental HCT116 cells.
Expression microarray analysis. After quantification of spot
intensity, expression array data were imported into Acuity 4.0 software (Molecular Devices, USA) for further analysis. The spots marked as “bad” or “not found” by the GenePix software were excluded. The background-corrected intensity data were normal-ized using the intensity-based Lowess method implemented in the software. Only the spots with a small percentage of saturated pixels (F%Sat < 3) and detectable above background (SNR > 3) were kept for further analysis. Additionally, only probes with suffi-cient data among replicates were kept into analysis. Log2 (F635/ F532) ratios of the duplicates features printed on the array were averaged. Differentially expressed sequences were identified either using a simple fold-change filter (average fold change over the three microarrays ≥1.5 between HS versus NHS samples) or by looking at sequences presenting an unadjusted p-value lower than 0.05 (one-sample significance test).
Acknowledgements
We thank Dr. Bert Vogelstein for kindly providing the HCT116 wild type and DKO colon cancer cell lines used in the study; Dr. Davide Gabellini for the gift of pDY01 plasmid; Dr. Teresa Teixeira for sharing yeast genomic DNA; Dr. Dirk Schubeler for advices on MeDIP. We also thank Dr. Benjamin Loppin and Dr. Katia Ancelin for comments on the manuscript. This work was supported by European Union 6th framework program grant RISCRAD [E.G., H.B.]; Epimed and EpiPro framework programs from Canceropole Lyon Auvergne Rhône Alpes and Institut National du Cancer [E.G., G.F. and C.V.], the ARECA network program of the Association pour la Recherche sur le Cancer [E.G., G.F. and C.V.]; Ligue Nationale contre le Cancer [Equipe labelisée, E.G.]; ACI grant from the Ministère de la Recherche—France [G.F.]; RFBR grant n° 07-04-00462a [N.V.]. A.E. was the recip-ient of a fellowship from the region Rhône Alpes (Emergence) and the Fondation pour la Recherche Médicale. E.G. is an asso-ciate member of European Union 6th framework program The Epigenome Network of Excellence (NoE).
Note
Supplementary materials can be found at: www.landesbioscience.com/supplement/ HorardEPI4-5-Sup.pdf
61. Narayan A, Ji W, Zhang XY, Marrogi A, Graff JR, Baylin SB, et al. Hypomethylation of pericentromeric DNA in breast adenocarcinomas. Int J Cancer 1998; 77:833-8. 62. Roman-Gomez J, Jimenez-Velasco A, Agirre X, Castillejo JA, Navarro G, San Jose-Eneriz E,
et al. Repetitive DNA hypomethylation in the advanced phase of chronic myeloid leu-kemia. Leuk Res 2008; 32:487-90.
63. Jacinto FV, Ballestar E, Ropero S, Esteller M. Discovery of epigenetically silenced genes by methylated DNA immunoprecipitation in colon cancer cells. Cancer Res 2007; 67:11481-6.
64. Jordan A, Bisgrove D, Verdin E. HIV reproducibly establishes a latent infection after acute infection of T cells in vitro. EMBO J 2003; 22:1868-77.
65. Vissel B, Choo KH. Human alpha satellite DNA—consensus sequence and conserved regions. Nucleic Acids Res 1987; 15:6751-2.
66. Moyzis RK, Albright KL, Bartholdi MF, Cram LS, Deaven LL, Hildebrand CE, et al. Human chromosome-specific repetitive DNA sequences: novel markers for genetic analysis. Chromosoma 1987; 95:375-86.
67. Cooke HJ, Hindley J. Cloning of human satellite III DNA: different components are on different chromosomes. Nucleic Acids Res 1979; 6:3177-97.
68. Moyzis RK, Buckingham JM, Cram LS, Dani M, Deaven LL, Jones MD, et al. A highly conserved repetitive DNA sequence, (TTAGGG)n, present at the telomeres of human chromosomes. Proc Natl Acad Sci USA 1988; 85:6622-6.
69. Espada J, Ballestar E, Fraga MF, Villar-Garea A, Juarranz A, Stockert JC, et al. Human DNA methyltransferase 1 is required for maintenance of the histone H3 modification pattern. J Biol Chem 2004; 279:37175-84.
70. Kondo Y, Shen L, Yan PS, Huang TH, Issa JP. Chromatin immunoprecipitation microar-rays for identification of genes silenced by histone H3 lysine 9 methylation. Proc Natl Acad Sci USA 2004; 101:7398-403.
71. Lee C, Wevrick R, Fisher RB, Ferguson-Smith MA, Lin CC. Human centromeric DNAs. Hum Genet 1997; 100:291-304.
33. Weber M, Hellmann I, Stadler MB, Ramos L, Paabo S, Rebhan M, et al. Distribution, silencing potential and evolutionary impact of promoter DNA methylation in the human genome. Nat Genet 2007; 39:457-66.
34. Rollins RA, Haghighi F, Edwards JR, Das R, Zhang MQ, Ju J, et al. Large-scale structure of genomic methylation patterns. Genome Res 2006; 16:157-63.
35. Cheng J, Kapranov P, Drenkow J, Dike S, Brubaker S, Patel S, et al. Transcriptional maps of 10 human chromosomes at 5-nucleotide resolution. Science 2005; 308:1149-54. 36. Fukagawa T, Nogami M, Yoshikawa M, Ikeno M, Okazaki T, Takami Y, et al. Dicer is
essential for formation of the heterochromatin structure in vertebrate cells. Nat Cell Biol 2004; 6:784-91.
37. Cam HP, Sugiyama T, Chen ES, Chen X, FitzGerald PC, Grewal SI. Comprehensive analysis of heterochromatin- and RNAi-mediated epigenetic control of the fission yeast genome. Nat Genet 2005; 37:809-19.
38. Azzalin CM, Reichenbach P, Khoriauli L, Giulotto E, Lingner J. Telomeric repeat con-taining RNA and RNA surveillance factors at mammalian chromosome ends. Science 2007; 318:798-801.
39. Schoeftner S, Blasco MA. Developmentally regulated transcription of mammalian telomeres by DNA-dependent RNA polymerase II. Nat Cell Biol 2008; 10:228-36. 40. Horard B, Gilson E. Telomeric RNA enters the game. Nat Cell Biol 2008; 10:113-5. 41. Rizzi N, Denegri M, Chiodi I, Corioni M, Valgardsdottir R, Cobianchi F, et al.
Transcriptional activation of a constitutive heterochromatic domain of the human genome in response to heat shock. Mol Biol Cell 2004; 15:543-51.
42. Valgardsdottir R, Chiodi I, Giordano M, Rossi A, Bazzini S, Ghigna C, et al. Transcription of Satellite III non-coding RNAs is a general stress response in human cells. Nucleic Acids Res 2008; 36:423-34.
43. Kramerov DA, Vassetzky NS. Short retroposons in eukaryotic genomes. Int Rev Cytol 2005; 247:165-221.
44. Dean FB, Hosono S, Fang L, Wu X, Faruqi AF, Bray-Ward P, et al. Comprehensive human genome amplification using multiple displacement amplification. Proc Natl Acad Sci USA 2002; 99:5261-6.
45. Rhee I, Jair KW, Yen RW, Lengauer C, Herman JG, Kinzler KW, et al. CpG methylation is maintained in human cancer cells lacking DNMT1. Nature 2000; 404:1003-7. 46. Majumder S, Ghoshal K, Datta J, Smith DS, Bai S, Jacob ST. Role of DNA
methyltrans-ferases in regulation of human ribosomal RNA gene transcription. J Biol Chem 2006; 281:22062-72.
47. Wilson AS, Power BE, Molloy PL. DNA hypomethylation and human diseases. Biochim Biophys Acta 2007; 1775:138-62.
48. Down TA, Rakyan VK, Turner DJ, Flicek P, Li H, Kulesha E, et al. A Bayesian deconvolution strategy for immunoprecipitation-based DNA methylome analysis. Nat Biotechnol 2008; 26:779-85.
49. Reiss D, Zhang Y, Mager DL. Widely variable endogenous retroviral methylation levels in human placenta. Nucleic Acids Res 2007; 35:4743-54.
50. Lavie L, Kitova M, Maldener E, Meese E, Mayer J. CpG methylation directly regulates transcriptional activity of the human endogenous retrovirus family HERV-K(HML-2). J Virol 2005; 79:876-83.
51. Ehrlich M. DNA hypomethylation, cancer, the immunodeficiency, centromeric region instability, facial anomalies syndrome and chromosomal rearrangements. J Nutr 2002; 132:2424-9.
52. Estecio MR, Gharibyan V, Shen L, Ibrahim AE, Doshi K, He R, et al. LINE-1 hypom-ethylation in cancer is highly variable and inversely correlated with microsatellite insta-bility. PLoS ONE 2007; 2:399.
53. Kondo T, Bobek MP, Kuick R, Lamb B, Zhu X, Narayan A, et al. Whole-genome methy-lation scan in ICF syndrome: hypomethymethy-lation of non-satellite DNA repeats D4Z4 and NBL2. Hum Mol Genet 2000; 9:597-604.
54. Batzer MA, Deininger PL, Hellmann-Blumberg U, Jurka J, Labuda D, Rubin CM, et al. Standardized nomenclature for Alu repeats. J Mol Evol 1996; 42:3-6.
55. Rodriguez J, Vives L, Jorda M, Morales C, Munoz M, Vendrell E, et al. Genome-wide tracking of unmethylated DNA Alu repeats in normal and cancer cells. Nucleic Acids Res 2008; 36:770-84.
56. Kato Y, Kaneda M, Hata K, Kumaki K, Hisano M, Kohara Y, et al. Role of the Dnmt3 family in de novo methylation of imprinted and repetitive sequences during male germ cell development in the mouse. Hum Mol Genet 2007; 16:2272-80.
57. Egger G, Jeong S, Escobar SG, Cortez CC, Li TW, Saito Y, et al. Identification of DNMT1 (DNA methyltransferase 1) hypomorphs in somatic knockouts suggests an essential role for DNMT1 in cell survival. Proc Natl Acad Sci USA 2006; 103:14080-5. 58. Schneider-Stock R, Diab-Assef M, Rohrbeck A, Foltzer-Jourdainne C, Boltze C, Hartig R,
et al. 5-Aza-cytidine is a potent inhibitor of DNA methyltransferase 3a and induces apoptosis in HCT-116 colon cancer cells via Gadd45- and p53-dependent mechanisms. J Pharmacol Exp Ther 2005; 312:525-36.
59. Seifarth W, Frank O, Zeilfelder U, Spiess B, Greenwood AD, Hehlmann R, et al. Comprehensive analysis of human endogenous retrovirus transcriptional activity in human tissues with a retrovirus-specific microarray. J Virol 2005; 79:341-52. 60. Thoraval D, Asakawa J, Wimmer K, Kuick R, Lamb B, Richardson B, et al.
Demethylation of repetitive DNA sequences in neuroblastoma. Genes Chromosomes Cancer 1996; 17:234-44.