HAL Id: halshs-02036434
https://halshs.archives-ouvertes.fr/halshs-02036434
Preprint submitted on 20 Feb 2019HAL is a multi-disciplinary open access archive for the deposit and dissemination of sci-entific research documents, whether they are pub-lished or not. The documents may come from teaching and research institutions in France or abroad, or from public or private research centers.
L’archive ouverte pluridisciplinaire HAL, est destinée au dépôt et à la diffusion de documents scientifiques de niveau recherche, publiés ou non, émanant des établissements d’enseignement et de recherche français ou étrangers, des laboratoires publics ou privés.
”If You Were Me”: Proxy Respondents’ Biases in
Population Health Surveys
Bérengère Davin, Xavier Joutard, Alain Paraponaris
To cite this version:
Bérengère Davin, Xavier Joutard, Alain Paraponaris. ”If You Were Me”: Proxy Respondents’ Biases in Population Health Surveys. 2019. �halshs-02036434�
Working Papers / Documents de travail
WP 2019 - Nr 05
“If You Were Me”:
Proxy Respondents’ Biases in Population Health Surveys
Bérengère Davin
Xavier Joutard
Alain Paraponaris
“If you were me”: Proxy respondents’ biases in population health surveys
Bérengère Davin(1), Xavier Joutard(2), Alain Paraponaris(3)
Abstract
Proxy respondents are widely used in population health surveys to maximize response rates. When surveys target frail elderly, the measurement error is expected to be smaller than selection or participation biases. However, in the literature on elderly needs for care, proxy use is most often considered with a dummy variable in which endogeneity with subjects’ health status is rarely scrutinised in a robust way. Pitfalls of this choice extend beyond methodological issues. Indeed, the mismeasurement of needs for care with daily activities might lead to irrelevant social policies or to private initiatives that try to address those needs. This paper proposes a comprehensive and tractable strategy supported by various robustness checks to cope with the suspected endogeneity of proxy use to the unobserved health status of subjects in reports of needs for care with activities of daily living. Proxy respondents’ subjectivity is found to inflate the needs of the elderly who are replaced or assisted in answering the questionnaire and to deflate the probability of unmet or undermet needs.
Key words
Proxy respondent, measurement bias, endogeneity, selection, Copula, needs for care, ADLs, IADLs
JEL codes
C31, C35, C36, I12, J14 1. Introduction
Proxy respondents are widely used to maximize survey response rates (Bollinger and Hirsch, 2012; Bound, 1991; Graham and Jackson, 1993; Highton, 2005; Hyland et al., 1997; Reynolds and Wenger, 2012; Tamborini and Kim, 2013) and, to some extent, to objectify individual responses (Christensen and Kallestrup-Lamb, 2012; Datta Gupta and Larsen, 2010). In a population health survey, the use of a proxy respondent may make it possible to avoid the pitfall of questioning healthy individuals only (Santos-Eggimann et al., 1999; Shaw et al., 2000). When surveys are aimed at documenting the health status of frail elderly, the possible measurement error is thus expected to be smaller than the selection bias (investigator’s decision not to interview subjects) or participation biases (subjects’ refusal to be interviewed) (Corder et al., 1996; Elliott et al., 2008; Kelfve et al., 2013; Shardell et al., 2012; Stineman et al., 2004; Wolinsky et al., 2016). However, this measurement bias must be controlled (Hung et al., 2007) because it is intrinsically not uncorrelated with either dependent (subjects’ needs for human assistance with daily activities, for instance) or independent (subjects’ health status) variables (Bound et al., 2001; Grootendorst et al., 1997; Nelson et al., 1990). When available all at once, subjects’ and proxies’ assessments have historically been found to be different (Cartwright, 1957; Elinson and Trussell, 1957; Enterline and Capt, 1959), with proxies’ misperceptions of actual subjects’ health status and needs increasing with the physical distance from the subjects (Magaziner et al., 1988; Shardell et al., 2012; Snow et al., 2005; Wolinsky et al., 2011, 2014). However, proxy respondents’ bias in assessments of the subjects’ performance and needs for assistance with activities of daily living may also be related to how proxies are used, as caregivers, to accessing and storing information about the observed impairments of the subjects (Hill and Pylypchuk, 2006). In this regard, proxies may exaggerate the deterioration of the subjects’ health status or the magnitude of their needs because of their feeling of care burden (Dassel and Schmitt, 2008; Neumann et al., 2000; Perkins, 2007; Santos-Eggimann et al., 1999; Wehby et al., 2016; Zanetti et al., 1999). Nonetheless, subjects could be less subjective than proxy respondents in their assessments of their own health status and needs (Benítez-Silva et al., 2004). In the literature on elderly health status and needs for care with daily activities, attention is rarely paid to the bias involved in the use of a proxy respondent. The ways in which self- and proxy responses may differ are not assessed because both viewpoints are not available at the same time in population surveys (Iezzoni et al., 2000). For instance,De Meijer et al. seem to ignore the issue when assessing the evolution of long-term care use in the Netherlands (de Meijer et al., 2015). When addressed, the issue is most often addressed through the use of a dummy variable (Todorov and Kirchner, 2000; Van Houtven and Norton, 2004, 2008), whose contribution is – unsurprisingly – found to be positive. However, although the endogeneity that may affect the use of a proxy
(1) Aix Marseille Univ., INSERM, IRD, SESSTIM & Observatoire Régional de la Santé PACA, Marseille, France,
berengere.davin@inserm.fr
(2) Aix Marseille Univ., CNRS, LEST, Aix-en-Provence, France & OFCE, Paris, France, xavier.joutard@univ-amu.fr
(3) Aix Marseille Univ., CNRS, EHESS, Centrale Marseille, AMSE, Marseille, France & Observatoire Régional de la Santé PACA,
Marseille, France, alain.paraponaris@univ-amu.fr (corresponding author)
respondent with the subject’s health status is occasionally addressed, it is rarely scrutinised in a robust way. As a result, in this positive contribution, the logical consequence of the deteriorated subject’s health status is hardly separable from the proxy respondent’s subjectivity. The pitfalls of this choice extend beyond methodological issues. Indeed, the endogeneity of proxy respondent use and proxy respondent subjectivity may dramatically distort the measurement of actual needs for human assistance with daily activities, thus leading to irrelevant social policies or private initiatives to meet those needs (de Meijer et al., 2015; Van Houtven and Norton, 2004, 2008).
As addressed by Angrist, 2001 regarding the general framework of the estimation of models with a limited dependent variable explained by a dummy endogenous regressor, among other variables, this paper proposes a solution to cope with the possibly joint determination of both the outcome variables (care needs for daily activities and how these needs are met) and what can be considered as a treatment variable (the use of a proxy-respondent); this paper also proposes a way to control for the relation between omitted variables in the model (the actual subjects’ heath status) and both treatment and outcome variables. In this paper, the existence and the number of needs for care with activities and instrumental activities of daily living (ADLs and IADLs, respectively) are then jointly considered with the help of count models (zero inflated Poisson due to the possibly important proportion of zeros) linked with a Copula function due to the usual association of both types of needs (Lee and Kim, 2012a; So et al., 2011). Identically, whether and how these needs are met with any human assistance is modelled jointly when needs for care with ADLs and IADLs are separately reported. However, in both situations, the use of a proxy respondent must be seriously questioned because it is suspected to be correlated with the subject’s health status, which is not directly observable. Indeed, if the subject’s health status is particularly impaired, a proxy respondent may be used to assist or even to replace the subject for the administration of the questionnaire. At the same time, it may also give rise to the report of needs for care with ADLs and IADLs and to the declaration of needs that are insufficiently met or are unmet. The organization of the paper is as follows: the model, the estimation strategy contingent upon the available dataset, and the survey from which the data are taken are all presented in section 2; the statistics describing the sample, the results of the equation explaining the use of a proxy respondent, the report of needs of care with ADLs and IADLs and the declaration of unmet or undermet needs are discussed in section 3, where the relevance of the estimation strategy is discussed in light of the comparison with naive estimations and robustness checks are proposed; results and lessons for the assessment of met and unmet needs for care among the elderly are discussed in the conclusion.
2. Model and data
2.1 Econometric model
In population health surveys, health status is commonly self-assessed (Au and Johnston, 2014; Etilé and Milcent, 2006) because, among other reasons, it is not always possible to document actual health status with the help of health professionals at a very large scale. This choice naturally fuels discussion about the reliability of health status assessments (Doiron et al., 2015). In addition, subjects may also be questioned about their ability to undertake daily activities by themselves or with the help of a third party. If they report needs for care with either ADLs or IADLs, they may be asked whether these needs are met, unmet (Desai et al., 2001) or undermet (Lima and Allen, 2001). When the health status of the subjects prevents them from responding to these questions independently, they are most often helped or replaced by someone believed to have good knowledge of their health and needs. In this framework, it is quite obvious that the same unobserved phenomenon (the subject’s actual health status) may simultaneously explain the use of a proxy respondent, the report of needs for care and, possibly, the report of unmet or undermet needs. We address this tricky issue by specifying a complete model that jointly considers the use of a proxy respondent, the existence and the number of needs and whether those needs are met. In what follows, the individual subscript 𝑖 is omitted for simplification reasons, and the subscript 𝑗 refers to both types of daily activities (ADL or IADL).
The use of a proxy respondent is represented by the dummy variable 𝑦$, which is generated by a continuous
latent variable 𝑦$∗, describing the willingness to use a proxy respondent:
𝑦$= 1 if 𝑦$∗≥ 0, 𝑦$= 0 if not, where: 𝑦$∗= 𝑥$𝛽$+ ℎ∗𝛿$− 𝜀$ (1)
𝑦$ can be conceived in the following as a treatment variable.
The number of needs reported for ADLs and IADLs must be modelled in a way that simultaneously includes a selection or participation process. Actually, due to a potentially large number of zeros, the count problem associated with the identification of the number of needs for care with daily activities must be fixed, as in Lee
and Kim, 2012 or Bordone and de Valk, 2016. Recently, there has been a major emphasis on the development of econometric models dealing with the inflation of null-values in health decisions and/or healthcare consumption count data, requiring that distinctly extensive and intensive margins be modelled (Deb and Trivedi, 1997; Gurmu and Elder, 2000, 2008; Wang, 2003). These models are all based on zero-inflated Poisson (ZIP), zero-inflated negative binomial (ZINB) models or transformations of them. In this paper, we coped with this potential pitfall with the help of a zero-inflated Poisson (ZIP) function:
𝑛9:;𝑥9:∼ ZIP@𝜇9:B , 𝜇9:C with: 𝑃:@𝑛9: = 0;𝑥9:, ℎ∗C = 𝑃B:+ @1 − 𝑃B:Cexp (−𝜇9:) (2a) 𝑃:@𝑛9:;𝑥9:, ℎ∗C = @1 − 𝑃B:C exp@−𝜇9:C𝜇9:JKL 𝑛9:! if 𝑛9:> 0 where: 𝑃B:= O1 + 𝑒QRKL S TQ$ 𝜇9:B = exp@𝑥9:𝛽9:B + 𝑦$𝛼9:BC (2b) 𝜇9:= exp@𝑥9:𝛽9:+ 𝑦$𝛼9:+ ℎ∗𝛿9:C (2c)
With equations (2a), the probability of reporting no need regarding each daily activity may be due to the actual absence of need (no need actually declared by obviously healthy individuals) as well as a declaration bias (partial or total failure in reporting actual needs). In other words, the first term represents the probability of a
non-participation situation, generated by a probit model characterized by equation (2b).
Regarding whether needs in each daily activity are met, 𝑦V: can only be measured if a need is at least
reported. Both variables are supposed to be generated by continuous latent variables 𝑦V:∗, which represent the
assessment of how needs are met, respectively, for ADLs and IADLs:
𝑦V:= 1 if 𝑦V:∗ ≥ 0, 𝑦V:= 0 if not where: 𝑦V:∗ = 𝑥V𝛽V:+ 𝑦$𝛼V:+ ℎ∗𝛿V:− 𝜀V:𝑗 = 𝐴𝐷𝐿, 𝐼𝐴𝐷𝐿 (3)
In all these equations, the 𝑥[’s represent vectors of observed individual variables, expected to be exogenous; and
𝜀$ and 𝜀V:’s are non-observable error terms, expected to be independent and identically distributed according
to a standardized Normal. The latent variable ℎ∗, representing the unobserved subject’s health status, enters in
each equation, particularly in the two pairs of outcome variables: the declaration of care needs with daily activities (ADLs and IADLs) on one hand and the declaration of unmet needs (ADLs and IADLs) on the other may then be correlated with the use of a proxy respondent. In equations (1)-(3), this variable can be the potential cause of the endogeneity of the use of a proxy respondent and of (non-)participation, i.e., the declaration of (no-)need:
ℎ∗= 𝑧𝛾 − 𝜈 (4)
The introduction of equation (4) in equations (1)-(3) makes it possible to consider henceforth the observable variables determining the health status 𝑧 and the non-observable component 𝜈, which describes the various characteristics of the health status that the subjects or the proxy respondents are not able to observe or to depict accurately (because of, for instance, physical or psychological limitations, a limited ability to cope with illness or disabilities, emotional distress, etc.). Then, we obtain the following:
𝑦$∗= 𝑥$𝛽$+ 𝑧𝛾$− 𝑢$ (1’)
𝜇9:= exp@𝑥9:𝛽9:+ 𝑦$𝛼9:+ 𝑧𝛾9:− 𝑢9:C with 𝑗 = 𝐴𝐷𝐿, 𝐼𝐴𝐷𝐿 (2c’)
𝑦V:∗ = 𝑥V𝛽V:+ 𝑦$𝛼V:+ 𝑧𝛾V:− 𝑢V: if 𝑦9:≡ 𝐼cJKLdSe= 1 with 𝑗 = 𝐴𝐷𝐿, 𝐼𝐴𝐷𝐿 (3’)
In this semi-reduced form, the error terms structure entails a common heterogeneity factor 𝜈: 𝑢$= 𝛿$ 𝜈 + 𝜀$
𝑢9: = 𝛿9: 𝜈 with 𝑗 = 𝐴𝐷𝐿, 𝐼𝐴𝐷𝐿
𝑢V: = 𝛿V: 𝜈 + 𝜀V: with 𝑗 = 𝐴𝐷𝐿, 𝐼𝐴𝐷𝐿
The common non-observable factor 𝜈 actually fuels the endogeneity of the use of proxy respondent, and its contribution must be controlled when estimating both reported needs for human assistance and whether these needs are met. Thus, the use of a proxy respondent can be viewed as a treatment effect in which endogeneity can be considered in several alternative ways.
2.2 Identification
The most usual identification mechanism is given by instrumental variables to be introduced in equation (4), which must be correlated with the use of a respondent’s status but not with the error terms in equations (2c’) and (3’), and especially not with the common factor 𝜈. The usual identification of probit models is then based on exclusion restrictions concerning instruments introduced in the auxiliary equation and removed from equations of interest. To do so, several variables could be considered, such as the presence of children or grandchildren or the number of sons and daughters. Other variables, such as the type of residential area (rural or urban), which are expected to reveal family closeness as well as the availability of formal care (healthcare and personal services), are available but unfortunately not correlated with the use of a proxy respondent. Recently, Han and Vytlacil, 2017 demonstrated that in the general framework of a two-equation model with binary endogenous variables in which latent error terms are jointly modelled with a Copula function, an exclusion restriction is necessary and sufficient for the identification of models with no common exogenous regressors, and it is necessary for those with common regressors; however, the authors also showed that identification can be achieved without exclusion restrictions when regressors are common in both equations of a multiple probit model.
Another option would be to take advantage of over-identifying restrictions coming from the semi-structural model. Regarding the use of over-identifying restrictions, variables must be found that contribute to the model made of the three equations only through their impact on the assessment of health status ℎ∗. This need equates
to considering the only variables in 𝑧 that are not embedded in vectors 𝑥$, 𝑥9: and 𝑥V:, 𝑗 = 𝐴𝐷𝐿, 𝐼𝐴𝐷𝐿. If, for
instance, 𝑧 is made of one variable only explaining health status ℎ∗ without entering any other equations
(excluded from 𝑥$, 𝑥9: and 𝑥V:, 𝑗 = 𝐴𝐷𝐿, 𝐼𝐴𝐷𝐿), the parameters are constrained: 𝛾$ = 𝛿$𝛾, 𝛾9:= 𝛿9:𝛾, 𝛾V:=
𝛿V:𝛾, 𝑗 = 𝐴𝐷𝐿, 𝐼𝐴𝐷𝐿.
A condition for the over-identification of each equation of interest (needs for care and whether needs are met) is naturally deduced for 𝑗 = 𝐴𝐷𝐿, 𝐼𝐴𝐷𝐿:
𝛾9:= 𝛿9:𝛾
𝛾V:= 𝛿V:𝛾
It is then possible to take these conditions as assumptions to check the validity of the original structural model. Non-linear restriction tests on parameters can then be computed with the help of an LR statistic and can be viewed as robustness checks of the usual option of model identification with the help of exclusion restrictions. Parameters 𝛿$, 𝛿9: and 𝛿V: can be viewed as the impact of health status ℎ∗ on each latent variable in the three
equations of the model. These parameters especially enable us to take into account the potential correlation between the error terms from these equations. Given the available information, normalisation restrictions must be implemented to make possible the identification of the parameters in the error structure of the model. In probit models, a unit-variance is usually imposed for each error term, which consequently gives: 𝛿$= 1. The
correlation for error terms can then be derived: 𝑐𝑜𝑟𝑟@𝑢:, 𝑢iC =
𝛿:𝛿i
j@1 + 𝛿:9C(1 + 𝛿 i9)
, 𝑗, 𝑠 = 1,2_𝐴𝐷𝐿, 2_𝐼𝐴𝐷𝐿, 3_𝐴𝐷𝐿, 3_𝐼𝐴𝐷𝐿
2.3 Dependence between ADL and IADL needs
In addition to the endogeneity concern, attention must also be paid to the sample selection in equation (2), where the latent variable 𝑛9: is defined only when a need has at least been reported by the subject or the proxy
respondent. This strategy prevents heterogeneity bias, which could be substantial if there was no sample selection, because subjects reporting no need for care and those declaring met needs would have been put in the same class.
However, the strong dependence between the two count variables (number of needs reported for ADLs and IADLs) is not correctly represented by the common heterogeneity component used to control for selection and
endogeneity biases. In this regard, a Copula function is introduced, which has the advantage of keeping the marginal distributions of both variables 𝑛9:, 𝑗 = 𝐴𝐷𝐿, 𝐼𝐴𝐷𝐿 expressing the number of needs care taken from the
ZIP distribution with a large number of zeros while specifically modelling the dependence between the two categories of needs (ADLs and IADLs). The advantage of such a choice is to make possible: 1) the heterogeneity in the dispersion of the count variables, 2) the separate modelling of the high proportion of no needs for care with the two kinds of daily activities and 3) the specification of a parameter measuring the dependence level of the two count variables. This strategy is very similar to the one used by So et al., 2011 for the joint modelling of hospital stays and non-physician hospital outpatient visits of elderly Americans as reported in the 1987–1988 National Medical Expenditure Survey or by Winkelmann, 2012 for the joint modelling of insurance decisions and ambulatory care consumption.
Copula theory and its applications in econometrics have been detailed in Trivedi and Zimmer, 2007. The Copula function relies on the joint distribution function of the count variables to the marginal distributions:
𝐹@𝑛9_pqr, 𝑛9_spqrC = 𝐶u@𝐹pqr (𝑛9_pqr;𝑥9_pqr, 𝜈C, 𝐹spqr (𝑛9_spqr;𝑥9_spqr, 𝜈))
with:
𝐹: (𝑛9:;𝑥9:, 𝜈) = ∑ 𝑃: (𝑠;𝑥9:, 𝜈) JKL
iwB (5)
for 𝑗 = 𝐴𝐷𝐿, 𝐼𝐴𝐷𝐿 and where 𝜃 represents the dependence parameter between 𝑛9_pqr and 𝑛9_spqr.
Two alternative specifications for the Copula function may be considered: Clayton’s Copula: 𝐶u(𝑢$, 𝑢9) = @𝑢$Qu+ 𝑢9Qu− 1C
Qyz
with 𝜃 ≥ 0 as the only possible dependence,
Franck’s Copula: 𝐶u(𝑢$, 𝑢9) = −𝜃Q$𝑙𝑜𝑔 }1 +
@~•z€yQ$C@~•z€KQ$C
~•zQ$ • with −∞ < 𝜃 < ∞. (6)
The determination of which is relevant must be based on information criteria such as BIC.
Copulas may be used to model either the joint distribution of the selection index and the structural error as an alternative to Heckman modelling (Smith, 2003) or a dichotomous dependent variable and binary endogenous explanatory variables without the joint normality assumption (Winkelmann, 2012) in a bivariate probit framework (Keay, 2016). Our model may look like those considered by Winkelman, Smith or Keay, which consist of bivariate probits: two equations modelling the outcome variables (the needs reported in the first equation, the needs met or unmet in the second one) where the first equation also contributes to sample selection but, in addition, our model entails the estimation of a dummy variable (the use of proxy respondent) suspected to be endogenous with the subject’s health status that also explains the report of needs and unmet needs for care with daily activities.
Finally, our model is, in part, quite close to that of Bratti and Miranda, 2011, where a binary endogenous variable, considered as a treatment variable (in our paper, the use of a proxy-respondent), may influence the outcome variable, which takes the form of a count variable. This is, in part, the same framework because first, this count equation regarding needs for care with ADLs is, in our model, related through a Copula function to another similar model concerning needs with IADLs and, second, those two count equations act as selection equations for the estimation of whether these needs are met. As in their paper, we suppose that whether elderly persons have any needs for care with ADLs and/or IADLs (the extensive margin) and the number of their needs (the intensive margin) are determined by two distinct processes required by the magnitude of null values. With no attention paid to selection, estimates may present a heterogeneity bias due to the mixture in the subsample of individuals with null values: those whose needs for care are all met and those with no need. Kim, 2006 also proposed a three-equation model very similar to ours, where a dummy variable may be endogenous in both the selection and the censored equation. The main difference is that we propose a couple of selection equations linked by a Copula function because of the obvious relationship between needs for care with ADLs and IADLs and a couple of censored equations. The likelihood function is derived in the Appendix.
2.4 Data
Equations (1’)-(3’) are estimated with the help of the data from the French national representative survey on disability and health (Handicap-Santé Ménages – HSM survey) carried out by the French National Institute of Statistics (INSEE) and the Ministry of Health (Direction de la Recherche, de l’Evaluation, des Etudes et des Statistiques - DREES). The survey included approximately 30,000 individuals living in the community (see Bouvier,
2011; Bussière et al., 2016; Renaut, 2012 for a description). Data were collected with a standardized questionnaire administered in face-to-face interviews; the questionnaire covers medical information (diseases, impairments, functional limitations, restrictions of activity, healthcare use); socioeconomic characteristics (household composition, educational level, income) and a description of the environment (home layout and facilities, assistive devices). Depending on the ability of subjects to answer the questionnaire independently, responses were self-, proxy-assisted or proxy responses. Formal and informal care, if any, provided by professionals and relatives were also recorded. The survey has been approved by the French Commission on Information Technology and Liberties (decision CE2008-721). It included 4,580 elderly aged 75 and older living in the community.
The need for care with daily activities is defined with the answers to three successive questions. First, subjects and/or their proxy were asked about their ability to perform daily activities. If they reported not being able to do a given activity without help1, they were considered as needing care to complete the activity. If so, second, they
were asked whether they actually got assistance for the activity. Then, third, if they did not receive any help, the need for care was considered unmet; if they received assistance that was insufficient (subjects and/or proxies reporting needing more assistance), the need was considered undermet; if the assistance was sufficient (no remaining need), the need was considered met.
The ADLs retained in this paper are the seven most frequently used in the literature (Katz et al., 1963): bathing (or showering), dressing, using the toilet, transferring, eating, moving inside (or walking), and faecal and urinary elimination. Eight IADLs are also considered, based on those previously defined by Lawton and Brody, 1969: shopping, housework, cooking, managing money, use of transportation, taking medications, use of the phone, and communication2.
The regressors set in equations (1’)-(3’) are restricted to the most common variables considered in the literature documenting the existence of needs and unmet needs: the subject’s age (75-79, 80-84, 85 and older), gender, composition of the household (alone, with spouse only, other), education (no degree, less than A-level, A-level and higher), income (quartiles), self-assessed health status (very good or good, fairly good, bad or very bad) and living area (rural, urban). Following the behavioural model developed by Andersen and Newman (Andersen and Newman, 1973; Andersen, 1995), these variables are predisposing (gender, age, education), enabling (income) and need (self-assessed health status) factors expected to be associated with the declaration of needs and, potentially, unmet needs. The place where the subject lived is usually viewed as an indirect measure of the potential supply of home care (Clark and Dellasega, 1998). When a proxy respondent has been involved in the administration of the questionnaire, her closeness with the subject has been documented (spouse, child, other). Three variables in the dataset were found to be associated with the use of a proxy and not associated with the report of needs and unmet/undermet needs: meetings with friends in the last month, meetings with family in the last month, and the proportion of daughters in the progeny. As a result, these variables have been used as instruments for the use of a proxy respondent to ensure the identification of equations (2’)-(3’).
3 Results
3.1 Sample characteristics
In the HSM survey, one elderly person aged 75 years and older out of six was assisted or replaced by a proxy respondent for the completion of the questionnaire. The composition of proxy respondents leaves substantial room for spouses, compared to the distribution of informal caregivers in the US Health and Retirement Survey, for instance (composed of approximately three-quarters children and one-quarter other people) (Groneck, 2017). Unsurprisingly, the main informal caregivers and, as a result, the preferred proxy respondents, are the cohabiting ones (spouses or children).
Self-respondents and respondents assisted by a proxy exhibit statistically significant differences in age (the oldest old are more numerous among respondents assisted with a proxy), gender (self-respondents are more frequently female), household composition respondents more often live alone or with a spouse), education
1 Alternative definitions of the need for human assistance were used. In what follows, the definition is stricter than
considering that a need exists when the subject cannot perform the activity without help or when he/she is able to do it but with many difficulties. Intuitively, this broader definition enables us to identify a larger prevalence of needs and, possibly, unmet or undermet needs. However, the general thrust of the results presented in the next section remains the same if the needs are defined in much broader way (tables are not reproduced in the paper), which contributes to their robustness.
respondents reported higher degrees than assisted respondents) and self-assessed heath status (unsurprisingly, assisted respondents declared worsened heath statuses). No difference can be found regarding income or living area (Table 1). There is also an important heterogeneity among the respondents assisted by a proxy. Except for the living area, their main characteristics may indeed differ strongly. Hence, those whose spouse helped or even replaced when answering the questionnaire were younger and more often male than respondents who asked a child or another person to help or replace them when answering the questionnaire. These individuals naturally more frequently with their spouse and seemed to have higher degrees. They also distributed quite equally among the various income categories, and they reported worse health status.
Table 1. Sample statistics.
Variables Proxy respondents Self
respondents Total
p-value1 p-value2
Spouse
(n = 455) (n = 571) Child (n = 224) Other (n = 1250) Total (n = 3330) (n = 4580)
Age 75-79 39.8 22.6 18.8 28.2 47.2 42 <.0001 <.0001 80-84 36 23.6 32.1 29.6 32.1 31.4 85+ 24.2 53.8 49.1 42.2 20.7 26.6 Gender Male 66.8 20.3 28.6 38.7 35 36 <.0001 <.0001 Female 33.2 79.7 71.4 61.3 65 64 Household Alone 35.7 52.7 40.5 46.8 41.1 <.0001 <.0001
With spouse only 88.4 13.5 9.8 40.1 42 41.5
Other 11.6 50.8 37.5 34.1 12.2 17.4 Education No degree 44.4 58.7 63.8 54.4 35.7 40.8 <.0001 <.0001 < A-levels 45.9 38.3 30.4 39.7 52.4 48.9 ≥ A-levels 9.7 3 5.8 5.9 11.9 10.3 Income 1st quartile 22.9 28.7 37 28.1 28.2 28.2 .0078 .3710 2nd quartile 27.5 28.4 23.7 27.2 26.4 26.6 3rd quartile 28.1 23.5 24.1 25.3 23.8 24.2 4th quartile 21.5 19.4 15.2 19.4 21.6 21 Reported
health status Very good or good Fairly good 26.8 6.4 28.6 11 9.8 33 28.7 9.1 18.1 40.7 37.4 15.7 .0286 <.0001
Bad or very bad 66.8 60.4 57.1 62.1 41.1 46.9
Area Rural 27.7 23.8 27.2 25.8 23.6 24.2 .3201 .1167
Urban 72.3 76.2 72.8 74.2 76.4 75.8
1 Chi-square test p-value (null: no difference in the distribution of variables within proxy respondents’ categories) 2 Chi-square test p-value (null: no difference in the distribution of variables between proxy and self-respondents)
The prevalence of needs for care with ADLs and IADLs is obviously not the same when we compare self- and assisted respondents (Table 2). The sharp difference in the mean numbers of the reported needs with ADLs (.26 compared to 2.17) is strongly significant. Furthermore, the proportion of elderly with no needs is important in both categories but obviously more so regarding self-respondents (85.7% compared to 41.9%). At the same time, differences among the assisted respondents are much more negligible and non-statistically significant. Regarding IADLs, the findings are slightly different. There is still an important and statistically significant gap in the mean numbers of needs with IADLs reported by the elderly (1.06 versus 4.34), but the proportions of null values, although significantly different (64.4% versus 20.2%), are smaller than the ones concerning ADLs. These results are, for instance, in line with those of Magaziner et al., 1988, which stated that the disagreement between self- and proxy respondents is higher for IADLs than for ADLs.
In addition, the assisted respondents seemed significantly more heterogeneous regarding needs with IADLs, with individuals helped by their spouses having smaller probabilities of needing care than the others. Recalling the scope of IADLs, one may question the potential influence of living habits and the distribution of household chores, which may mitigate the magnitude of care that the assisted respondents actually receive but are not aware of. Contrary to Neumann et al., 2000 or Shaw et al., 2000 and as in Magaziner et al., 1988, the proxy respondents expected to have much more numerous contacts with the subjects they helped or replaced in answering the questionnaire (spouses compared to children or other proxies) did not report significantly higher care needs.
The report of needs for ADLs seems, moreover, to go hand in hand with that of of IADLs. Figure 1 first reveals an important accumulation of simultaneous null values for the reported needs with ADLs and IADLs, and those values must be taken into account when modelling the number of needs reported by the elderly. Second, the figure stresses that the declaration of needs with one type of daily activities (ADLs or IADLs) is rarely separated
from the report of needs with daily activities of the other kind, especially concerning the report of needs with IADLs conditional on the report of needs for care with at least one ADL. This finding must also be considered when modelling the declaration of needs for care with ADLs and IADLs with the help of an explicit dependence parameter in a copula function.
Table 2. Number of needs with ADL and IADL (% and mean).
Proxy respondents Self
respondents Total p-value1 p-value2
Spouse
(n = 455) (n = 571) Child (n = 224) Other (n = 1250) Total (n = 3330) (n = 4580) ADL 0 46.8 38.5 40.6 41.9 85.7 73.8 .2476 <.0001 1 13.6 16.3 17.9 15.6 8.9 10.7 2 6.6 10.2 10.3 8.9 2.4 4.2 3 5.7 6 5.8 5.9 1.3 2.5 4 3.3 5.6 4.9 4.6 .9 1.9 5 5.3 4.5 2.7 4.5 .4 1.5 6 6.1 5.1 6.2 5.7 .2 1.7 7 12.6 13.8 11.6 13.0 .2 3.7 Mean 2.08 2.27 2.07 2.17 .26 .78 .4377 <.0001 IADL 0 28.4 13.8 19.6 20.2 64.4 52.2 .0002 <.0001 1 5.5 6.8 8.5 6.6 10.4 9.4 2 5.5 7 3.6 5.8 7.1 6.8 3 5 7.4 7.1 6.5 5.1 5.5 4 6.6 7.9 7.6 7.4 4.6 5.3 5 8.1 9.5 8 8.7 4.4 5.6 6 11 11.6 15.6 12.1 2.7 5.3 7 9 13.3 10.7 11.3 1 3.8 8 20.9 22.7 19.3 21.4 0.3 6.1 Mean 3.95 4.66 4.3 4.34 1.06 1.96 .0007 <.0001
1 Chi-square (%)/ANOVA (mean) test p-value (null: no difference in the distribution of variables within proxy respondents categories) 2 Chi-square (%)/ANOVA (mean) test p-value (null: no difference in the distribution of variables between proxy and self-respondents)
Figure 1. Needs with ADLs and IADLs among people aged 75 years and over.
Differences in the prevalence of unmet and undermet needs are also statistically significant between self- and assisted respondents (Table 3). A total of 31.8% (35.7%) of the self- and 39.8% (45.5%) of the assisted respondents reported that they received no assistance or insufficient assistance, although they reported needs with ADLs and IADLs, respectively. Nevertheless, the discrepancies among the assisted respondents are not strong enough to be statistically significant even if, concerning both ADLs and IADLs, respondents assisted by their spouse or helped by a person other than a relative revealed substantially different needs. Bringing together the findings in Tables 2 and 3, we find that the elderly who relied on their spouse to answer the questionnaire
reported at least as many needs as the respondents assisted by a person who was not a relative, but they also declared higher difficulties in getting their needs met, which suggests that they are likely to be both less self-sufficient and more frail in their daily lives (Santos-Eggimann and Sirven, 2016).
Table 3. Unmet and undermet needs with ADLs and IADLs among the elderly needing assistance.
Proxy respondents Self
respondents Total p-value
1 p-value2
Spouse Child Other Total
ADL 41.3 41.3 33.1 39.8 31.8 36.6 .2177 .0184 IADL 47.2 45.9 41.1 45.5 35.7 40.2 .5110 .0033
1 Chi-square test p-value (null: no difference in the distribution of variables within proxy respondents categories) 2 Chi-square test p-value (null: no difference in the distribution of variables between proxy and self-respondents)
These findings are consistent with those of Khatutsky et al., 2006 concerning the differences in the numbers of needs for care with ADLs and IADLs. Of course, the absolute values are not the same because they may rely on different definitions of the needs and on the characteristics of the sample, but the sign of the difference in needs with ADLs and IADLs between self- and assisted respondents is the same. By contrast, in the paper by Khatutsky et al., 2006, respondents assisted by proxies reported slightly lower unmet needs than did self-respondents; without that difference, our results are more explicit.
3.2 Recursive estimation of the model
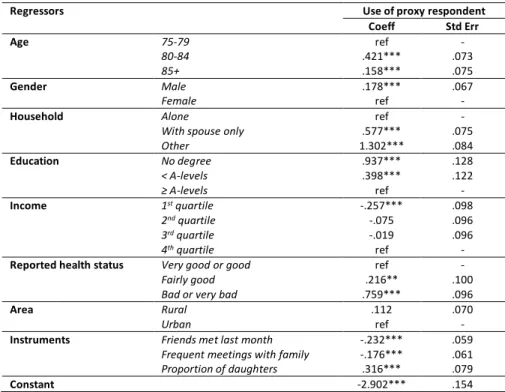
The use of a proxy respondent (equation (1’)) is positively and significantly related to the age of the subject; proxy respondents are more frequent when the subject is a man and not living alone (Table 4). Low education levels are also positively associated with the use of a proxy respondent and a bad self-assessed health status. Unsurprisingly, the subjects who rated their health status as neither good nor very good relied significantly more often on a proxy. Last, those with a low income (less than the first quartile) had a lower probability of using a proxy. Two of the three instruments for the use of a proxy respondent that signal social and family integration (whether friends have been met in the last month and the frequency of family visits) are negatively correlated with the use of a proxy; the proportion of daughters in the lineage is, by contrast, positively linked to the use of a proxy. These three variables are used as predictors of proxy use with the other covariates of equation (1’) to explain the declaration of needs for care with ADLs and IADLs (equations (2c’_ADL) and (2c’_IADL), respectively) and, conditionally on the report of needs, the existence of any unmet or undermet need with ADLs and IADLs (equations (3’_ADL) and (3’_IADL), respectively).
Table 4. Estimation of the recursive model with Franck copula: equation (1’)
Regressors Use of proxy respondent
Coeff Std Err Age 75-79 ref - 80-84 .421*** .073 85+ .158*** .075 Gender Male .178*** .067 Female ref -
Household Alone ref -
With spouse only .577*** .075
Other 1.302*** .084 Education No degree .937*** .128 < A-levels .398*** .122 ≥ A-levels ref - Income 1st quartile -.257*** .098 2nd quartile -.075 .096 3rd quartile -.019 .096 4th quartile ref -
Reported health status Very good or good ref -
Fairly good .216** .100
Bad or very bad .759*** .096
Area Rural .112 .070
Urban ref -
Instruments Friends met last month -.232*** .059
Frequent meetings with family -.176*** .061
Proportion of daughters .316*** .079
Table 4 (continued). Estimation of the recursive model with Franck Copula: equations (2c’_ADL)-(3’_ADL)
Equation (7_ADL) Equation (8_ADL) Regressors No need with ADL Number of needs with ADL Unmet need with ADL
Coeff Std Err Coeff Std Err Coeff Std Err
Age 75-79 ref - ref - ref -
80-84 -.232** .108 .213*** .060 .816*** .303
85+ -.781*** .112 .442*** .061 1.190*** .379
Gender Male .581*** .101 .052 .052 .491** .252
Female ref - ref - ref -
Household Alone ref - ref - ref -
With spouse only .260** .126 .247*** .071 .692** .310
Other -.063 .123 .541*** .062 1.615*** .459
Education No degree .079 .202 .402*** .110 1.258** .523
< A-levels -.161 .196 .322*** .107 .512 .436
≥ A-levels ref - ref - ref -
Income 1st quartile .006 .140 -.058 .068 -.189 .300
2nd quartile -.079 .143 -.168** .069 .067 .293
3rd quartile .013 .139 -.021 .066 -.036 .292
4th quartile ref - ref - ref -
Reported health status Very good or good ref - ref - ref -
Fairly good -.901*** .187 .071 .125 -.300 .461
Bad or very bad -1.741*** .176 .717*** .118 1.213** .526
Area Rural .112 .099 .140*** .048 -.320 .225
Urban ref - ref - ref -
Proxy respondent Spouse -1.431*** .140 .517*** .084 -2.496*** .715
Child -1.224*** .131 .385*** .076 -2.320*** .663
Other -1.212*** .170 .439*** .089 -2.743*** .781
Self respondent ref - ref - ref -
Constant 2.379*** .264 -1.033*** .174 -3.621*** 1.014
Table 4 (continued). Estimation of the recursive model with Franck Copula: equations (2c’_IADL)-(3’_IADL)
Equation (7_IADL) Equation (8_IADL) Regressors No need with IADL Number of needs with IADL Unmet need with IADL
Coeff Std Err Coeff Std Err Coeff Std Err
Age 75-79 ref - ref - ref -
80-84 -.300*** .084 .154*** .029 .222** .104
85+ -.980*** .095 .302*** .029 .384*** .109
Gender Male .787*** .082 -.012 .026 .125 .098
Female ref - ref - ref -
Household Alone ref - ref - ref -
With spouse only .419*** .089 .051 .032 .269** .113
Other .071 .110 .202*** .030 .504*** .121
Education No degree -.109 .152 .118** .052 .600*** .190
< A-levels -.238* .142 .074 .050 .266 .178
≥ A-levels ref - ref - ref -
Income 1st quartile .081 .119 .005 .034 -.016 .133
2nd quartile .002 .117 -.032 .034 -.079 .130
3rd quartile -.004 .117 .008 .034 .017 .131
4th quartile ref - ref - ref -
Reported health status Very good or good ref - ref - ref -
Fairly good -.937*** .124 .072 .053 -.011 .177
Bad or very bad -2.119*** .124 .331*** .050 .482*** .172
Area Rural -.099 .084 .061** .024 -.146 .094
Urban ref - ref - ref -
Proxy respondent Spouse -1.643*** .127 .431*** .041 -1.069*** .175
Child -1.819*** .140 .357*** .037 -1.002*** .155
Other -1.461*** .189 .347*** .045 -1.196*** .193
Self respondent ref - ref - ref -
Constant 1.800*** .174 .546*** .072 -1.202*** .252
*,**,***: statistical significance at .1, .05, .01 level
The contribution of the regressors of the needs for care with ADLs and IADLs usually considered within the framework of the Andersen and Newman behavioural model is globally the one expected (Bruni and Ugolini, 2016; Calsyn and Winter, 2001; Davin et al., 2005, 2009). The two-step estimation strategy related to the ZIP model used in this paper (reporting no need as a first step and conditional on the report of at least one need, estimating the number of needs) mainly enables decomposing the statistically significant contribution of the regressors as a negative one regarding the report of no need with ADLs (higher age groups, bad self-assessed health status) and IADLs (the same variables plus an education level less than A) and as a positive one concerning
the number of needs reported with both ADLs and IADLs (equations (2c’_ADL) and (2c’_IADL)). The same variables as those considered in the report of strictly positive numbers of needs are implied in the declaration of unmet or undermet needs, conditional on the previous report of needs with either ADLs or IADLs. Thereon, needs are all the more likely not to be met (unmet or undermet) for subjects who are among the oldest old, male (for ADLs only), not living alone, without any degree and who do not declare themselves healthy (equations (3’_ADL) and (3’_IADL)).
The estimated values of the parameters 𝛿 (Table 5) unambiguously support the endogeneity of the use of a proxy respondent with the unobserved subject’s health status; in the equations of both needs (𝛿9:, 𝑗 = 𝐴𝐷𝐿, 𝐼𝐴𝐷𝐿)
and unmet/undermet needs (𝛿V:, 𝑗 = 𝐴𝐷𝐿, 𝐼𝐴𝐷𝐿), the null hypothesis of nullity of the parameters 𝛿 is
systematically and strongly rejected. Second, the positive signs of the parameters 𝛿 suggest that the contribution of the proxy dummy would be overstated if the endogeneity were not controlled. In other words, the consideration of the endogeneity issue seems to assist in disentangling the pure contribution of the proxy respondent’s subjectivity from the reasons for her assistance that can be reduced to the subject’s health status.
Table 5. Estimation of the recursive model with Franck Copula: specification test statistics
Parameters ADL IADL
Coeff Std Err Coeff Std Err
𝛿$ 1 - 1 -
𝛿9 .449*** .044 .167*** .020
𝛿V 2.770*** .706 1.208*** .117
𝜃 7.368*** .240
*,**,***: statistical significance at .1, .05, .01 level
Moreover, the formal link between the declaration of needs and unmet/undermet needs with ADLs on one hand and with IADLs on the other, which has been marked explicitly with the help of Franck’s copula function, is found relevant. Parameter 𝜃 is indeed significantly positive, in line with what could be expected following Figure 1.3
Finally, the analysis of the estimated correlation parameters of the error terms in equations (1’)-(3’) highlights a positive structure backed by the values of the 𝛿 parameters previously estimated (Table 6). In addition, two results are of particular interest: 1) the error term taken from the proxy use equation is very positively correlated to the error term in the unmet/undermet needs equation; 2) although weaker, the value and the statistical significance of the correlation parameters 𝑐𝑜𝑟𝑟@𝑢9_pqr, 𝑢V_pqrC and 𝑐𝑜𝑟𝑟@𝑢9_spqr, 𝑢V_spqrC state that the
omitted variables in (2c’) are positively correlated with the ones in (3’) and justify the use of a sample selection between equations (2c’) and (3’), conditioning the estimation of unmet/undermet needs on the primary report of a need for human assistance with daily activities.
Table 6. Correlation estimates of error terms of equations (1’)-(3’).
Coeff Std Err 𝑐𝑜𝑟𝑟@𝑢$, 𝑢9_pqrC .4224*** .0335 𝑐𝑜𝑟𝑟@𝑢$, 𝑢9_spqrC .1728*** .0190 𝑐𝑜𝑟𝑟@𝑢$, 𝑢V_pqrC .9404*** .0149 𝑐𝑜𝑟𝑟@𝑢$, 𝑢V_spqrC .7688*** .0299 𝑐𝑜𝑟𝑟@𝑢9_pqr, 𝑢V_pqrC .3973*** .0301 𝑐𝑜𝑟𝑟@𝑢9_spqr, 𝑢V_spqrC .1328*** .0146 𝑐𝑜𝑟𝑟@𝑢9_pqr, 𝑢V_spqrC .3248*** .0258 𝑐𝑜𝑟𝑟@𝑢9_spqr, 𝑢V_pqrC .1625*** .0175
*,**,***: statistical significance at .1, .05, .01 level
As an alternative to the use of instruments for the purpose of model identification, the use of over-identifying restrictions has been suggested above concerning the parameters 𝛾9:= 𝛿9:𝛾 and 𝛾V:= 𝛿V:𝛾, 𝑗 = 𝐴𝐷𝐿, 𝐼𝐴𝐷𝐿,
where 𝛾 is the parameter associated with the observable variables 𝑧 assumed to explain the latent variable ℎ∗.
The F-statistic computed for the appropriate LR test is given by F(8,4468)=1,5950, where the p-value is equal to .1207. It is thus not possible to reject the null hypothesis made by the overidentifying restrictions, thus supporting the validity of the original semi-structural model.
Concerning the use of a proxy respondent in particular, the results stress differentiated contributions, depending on the report of needs or the report of unmet/undermet needs. The report of a strictly positive number of needs
3 The use of the Clayton’s copula led to similar results. The estimation of parameter 𝜃 is in this case equal to 3.574, with a
standard error equal to .171. As in So et al., 2011, Franck’s Copula has been preferred on the basis of the usual information criteria (AIC and BIC).
for care with both ADLs and IADLs is positively and significantly explained by the use of a proxy respondent (equations (2c’_ADL) and (2c’_IADL)). This finding supports the idea that proxy use would inflate the declaration of needs, as in previous studies (Desai et al., 2001; Lima and Allen, 2001; Todorov and Kirchner, 2000), although, unlike in those papers, the endogeneity of proxy use with health status has been controlled in ours. In this regard, Table 7 in sub-section 3.3 below will be useful in demonstrating the sign and magnitude of the bias that can be prevented by the estimation strategy developed in this paper. Because the proxy respondents are most often also the caregivers, they can be expected to overstate needs compared to those that the elderly would have declared by themselves (Ball et al., 2001; Dorevitch et al., 1992; Rothman et al., 1991) and to bring out both the health and disability status of the surveyed person (Epstein et al., 1989; Iezzoni et al., 2000) and their role as caregiver (Bandayrel and Johnston, 2014; Neumann et al., 2000; Roydhouse and Wilson, 2017). However, being assisted or replaced by a proxy respondent strongly and significantly reduces the probability of declaring unmet or undermet needs (equations (3’_ADL) and (3’_IADL)). As in Desai et al., 2001, these results support the view that the proxy respondents may have given value to the assistance they are likely to have provided, in opposition to the view that the burden of care (caregivers are found to develop morbidities and depressive symptomatology due to caregiving) affects carers’ ability to cope with the needs experienced by the elderly (Hsu et al., 2017; Long et al., 1998).
3.3 Comparison of naive and recursive estimations
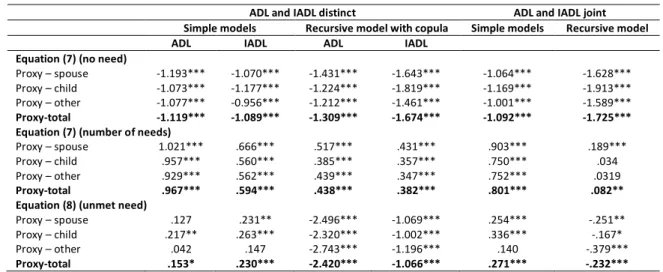
Table 7 compares the parameters associated with the proxy dummies estimated with the help of simple probit equations and the ones we obtained with our recursive model made of equations (1’)-(3’). The table also distinguishes the results according to the distinct or joint consideration of ADLs and IADLs. The results first reveal that the control for the endogeneity of the dummy used to signal the use of a proxy respondent does not significantly distort its negative contribution to the absence of declaration of any need with ADLs or IADLs when a Franck’s copula is used (equations (2c’), no need). This observation is slightly modified but still holds when ADLs and IADLs are jointly considered. In contrast, the control for endogeneity reduces the contribution to the number of reported needs with ADLs and, to a lesser extent, IADLs (equations (2c’), number of needs). The result is strengthened when ADLs and IADLs are not distinguished. Thus, the dummy signalling the use of a proxy respondent still explains the declaration of needs and the number of needs reported even when the endogeneity of the dummy is taken into account. This finding supports the idea that, independently of all the arguments related to the unobservable subjects’ health status justifying the use of proxies, proxy respondents demonstrate subjectivity by overstating needs.
Table 7. Proxy parameter estimates in simple and recursive models.
ADL and IADL distinct ADL and IADL joint Simple models Recursive model with copula Simple models Recursive model
ADL IADL ADL IADL
Equation (7) (no need)
Proxy – spouse -1.193*** -1.070*** -1.431*** -1.643*** -1.064*** -1.628*** Proxy – child -1.073*** -1.177*** -1.224*** -1.819*** -1.169*** -1.913*** Proxy – other -1.077*** -0.956*** -1.212*** -1.461*** -1.001*** -1.589*** Proxy-total -1.119*** -1.089*** -1.309*** -1.674*** -1.092*** -1.725*** Equation (7) (number of needs)
Proxy – spouse 1.021*** .666*** .517*** .431*** .903*** .189***
Proxy – child .957*** .560*** .385*** .357*** .750*** .034
Proxy – other .929*** .562*** .439*** .347*** .752*** .0319
Proxy-total .967*** .594*** .438*** .382*** .801*** .082** Equation (8) (unmet need)
Proxy – spouse .127 .231** -2.496*** -1.069*** .254*** -.251**
Proxy – child .217** .263*** -2.320*** -1.002*** .336*** -.167*
Proxy – other .042 .147 -2.743*** -1.196*** .140 -.379***
Proxy-total .153* .230*** -2.420*** -1.066*** .271*** -.232*** *,**,***: statistical significance at .1, .05, .01 level
The differences in the results concerning the unmet/undermet needs are much more challenging (equations (3’)). In fact, proxy use is found to deflate the declaration of unmet/undermet needs, whereas it would have inflated it if the dummy endogeneity were not controlled. The reversal of the sign of the estimated parameter associated with the endogenous dummy is meaningful. Admittedly, Desai et al., 2001, Lima and Allen, 2001 and Long et al., 1998 found similar results in countries and time periods different than ours. However, their results relied on the logit estimation of a single equation where the use of a proxy respondent is simply indicated by a dummy variable, and they paid no specific attention to the endogeneity issue. In addition, their samples were at once
restricted to only those elderly who reported needs, which ignored the common factors that may explain both whether elderly reported needs and whether those needs were met or not.
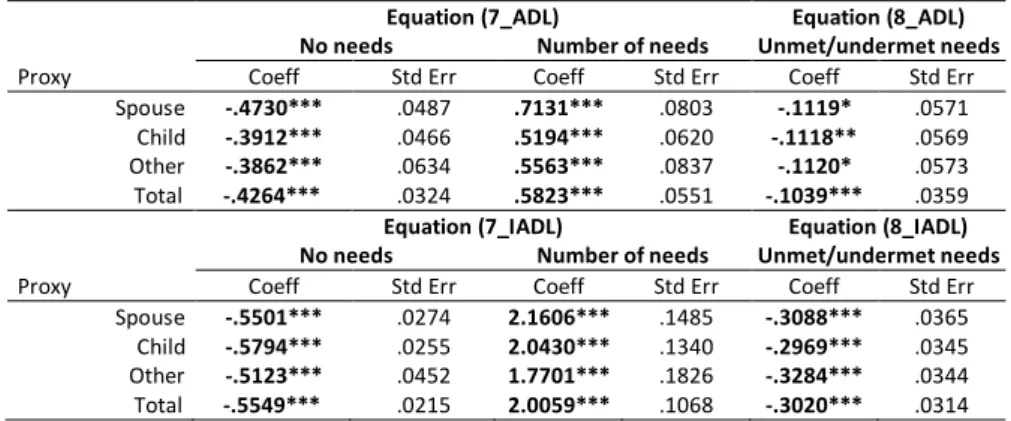
3.4 Marginal effects
The marginal effects concerning the contributions of the covariates in equations (1’)-(3’) are nonlinear functions of the parameter estimates (Table 8). The Delta method has been used to obtain a linear approximation of the standard errors (Greene, 2012). If the closeness of the proxy with the subject is not questioned, being helped or replaced by a proxy respondent reduces the probability of declaring no need with ADLs by .43 (by .55 with IADL). It adds .58 need for care with ADLs and 2.01 needs with IADLs and reduces the probability of reporting unmet/undermet needs with ADLs by .10 (by .30 for unmet/undermet needs with IADLs). Distinguishing the proxies according to their privacy with the elderly they helped or replaced in responding to the questionnaire reveals an upward gradation, although not a statistically significant one, in the intensity of the marginal effects in equations (2c’_ADL) and (2c’_IADL) but not in equations (3’_ADL) and (3’_IADL). Thus, there would be no expectation to include in our dataset the identification of the proxy closeness, unlike what was found in Elliott et al., 2008, Magaziner et al., 1988, Santos-Eggimann et al., 1999 or Wolinsky et al., 2016 for instance4, where
the overestimation of needs with ADLs and/or IADLs was mainly from close relatives.
Table 8. Marginal effects associated with proxy respondents’ parameters (average individual).
Equation (7_ADL) Equation (8_ADL) No needs Number of needs Unmet/undermet needs
Proxy Coeff Std Err Coeff Std Err Coeff Std Err
Spouse -.4730*** .0487 .7131*** .0803 -.1119* .0571 Child -.3912*** .0466 .5194*** .0620 -.1118** .0569 Other -.3862*** .0634 .5563*** .0837 -.1120* .0573 Total -.4264*** .0324 .5823*** .0551 -.1039*** .0359 Equation (7_IADL) Equation (8_IADL) No needs Number of needs Unmet/undermet needs
Proxy Coeff Std Err Coeff Std Err Coeff Std Err
Spouse -.5501*** .0274 2.1606*** .1485 -.3088*** .0365 Child -.5794*** .0255 2.0430*** .1340 -.2969*** .0345 Other -.5123*** .0452 1.7701*** .1826 -.3284*** .0344 Total -.5549*** .0215 2.0059*** .1068 -.3020*** .0314 *,**,***: statistical significance at .1, .05, .01 level
4. Conclusion
Population health surveys face the challenge of documenting population health status at a very large scale. The quality of health data can actually suffer from the way they are collected, jeopardizing the usefulness of that data to researchers and public health policy decision-makers. To prevent the risk of questioning only healthy people and to avoid excessive missing data, a usual option in these population surveys is to appeal to proxy respondents who help or even replace people with particularly poor health status in providing survey answers. The choice of a proxy respondent entails potential perception errors about health status, functional and cognitive limitations, impairments and disabilities, and these errors have been widely reported in the literature. The choice of a proxy also raises obvious endogeneity problems that, in the context of the reporting of both needs and unmet-undermet needs with daily activities, this paper proposed to solve. This paper was based on a convenient and tractable model made of three equations that were recursively estimated and enabled 1) a double endogeneity control of the use of a proxy respondent with the unobserved health status of the elderly assisted or replaced in answering the questionnaire, 2) sample selection in the estimation for unmet/undermet needs conditional on the report of needs and 3) the consideration of the association of ADLs and IADLs in the usual process of autonomy loss. That estimation strategy contributed to disentangling proxy respondents’ own sensitivity and subjectivity from objective motives based on subjects’ health and disabilities. The results unambiguously support the idea that the subjectivity of the proxy respondents, most often recruited among the caregivers of the surveyed elderly, inflates the probability of declaring both needs and the number of reported needs for care with ADLs and IADLs and deflates the probability of declaring unmet/undermet needs. As a result, the impact of the
4 The marginal effects computed for the median individual (a woman, aged more than 74 years and less than 80, living alone
in a urban area, with a A-level at least, an income higher than 𝑄V and reporting a good to very good health status) with no
distinction regarding the proxy closeness to the subject were oriented globally in the same way. Using a proxy reduces by .13 (𝑝=.017) the probability to declare no need with ADLs (.42 with IADLs, 𝑝<.0001), increases by .10 (𝑝<.0001) the number of reported needs with ADLs (.92 with IADLs, 𝑝<.0001) and reduces by .0002 (𝑝=.606) the probability to report unmet/undermet needs with ADLs (.10 with IADLs, 𝑝=.0098).
use of proxy respondents in population health surveys undoubtedly requires attention and suitable treatments in forthcoming research on that topic, without which the predictions of needs for long-term care will be undermined and public policies aimed at planning care provision will be rendered irrelevant (de Meijer et al., 2015; Van Houtven and Norton, 2004). Moreover, functional limitations are involved in a dynamic process, as are disabilities and needs for care with ADLs and IADLs (Hill and Pylypchuk, 2006). A challenging issue, therefore, is to assess how the respondent’s bias, depending on where the proxy, as a respondent, is located in her learning curve about the subject and, as a caregiver, in her knowledge of the elderly she is used to caring for, may evolve in a dynamic perspective.
References
Andersen, R., Newman, J.F., 1973. Societal and individual determinants of medical care utilization in the United States. Milbank Mem Fund Q Health Soc 51, 95–124.
Andersen, R.M., 1995. Revisiting the behavioral model and access to medical care: does it matter? J Health Soc Behav 36, 1– 10.
Angrist, J.D., 2001. Estimation of Limited Dependent Variable Models With Dummy Endogenous Regressors. Journal of Business & Economic Statistics 19, 2–28. https://doi.org/10.1198/07350010152472571
Au, N., Johnston, D.W., 2014. Self-assessed health: what does it mean and what does it hide? Soc Sci Med 121, 21–28. https://doi.org/10.1016/j.socscimed.2014.10.007
Ball, A.E., Russell, E.M., Seymour, D.G., Primrose, W.R., Garratt, A.M., 2001. Problems in using health survey questionnaires in older patients with physical disabilities. Can proxies be used to complete the SF-36? Gerontology 47, 334–340. Bandayrel, K., Johnston, B.C., 2014. Recent advances in patient and proxy-reported quality of life research. Health Qual Life
Outcomes 12, 110. https://doi.org/10.1186/s12955-014-0110-7
Benítez-Silva, H., Buchinsky, M., Man Chan, H., Cheidvasser, S., Rust, J., 2004. How large is the bias in self-reported disability? J. Appl. Econ. 19, 649–670. https://doi.org/10.1002/jae.797
Bollinger, C.R., Hirsch, B.T., 2012. Is Earnings Nonresponse Ignorable? The Review of Economics and Statistics 95, 407–416. https://doi.org/10.1162/REST_a_00264
Bordone, V., de Valk, H.A.G., 2016. Intergenerational support among migrant families in Europe. Eur J Ageing 13, 259–270. https://doi.org/10.1007/s10433-016-0363-6
Bound, J., 1991. Self-Reported Versus Objective Measures of Health in Retirement Models. The Journal of Human Resources 26, 106–138. https://doi.org/10.2307/145718
Bound, J., Brown, C., Mathiowetz, N., 2001. Measurement Error in Survey Data. Handbook of Econometrics 5, 3705–3843. https://doi.org/10.1016/S1573-4412(01)05012-7
Bouvier, G., 2011. L’enquête Handicap-Santé. Présentation générale. INSEE. Document de travail F1109, 61 p. Bratti, M., Miranda, A., 2011. Endogenous treatment effects for count data models with endogenous participation or
sample selection. Health Econ. 20, 1090–1109. https://doi.org/10.1002/hec.1764
Bruni, M.L., Ugolini, C., 2016. Delegating home care for the elderly to external caregivers? An empirical study on Italian data. Rev Econ Household 14, 155–183. https://doi.org/10.1007/s11150-014-9253-x
Bussière, C., Sicsic, J., Pelletier-Fleury, N., 2016. Simultaneous effect of disabling conditions on primary health care use through a capability approach. Social Science & Medicine 154, 70–84.
https://doi.org/10.1016/j.socscimed.2016.02.022
Calsyn, R.J., Winter, J.P., 2001. Predicting four types of service needs in older adults. Evaluation and Program Planning 24, 157–166.
Cartwright, A., 1957. The effect of obtaining information from different informants on a family morbidity inquiry. Applied Statistics 6, 18–25.
Christensen, B.J., Kallestrup-Lamb, M., 2012. The impact of health changes on labor supply: evidence from merged data on individual objective medical diagnosis codes and early retirement behavior. Health Econ 21 Suppl 1, 56–100. https://doi.org/10.1002/hec.2811
Clark, D., Dellasega, C., 1998. Unmet health care needs. Comparison of rural and urban senior center attendees. J Gerontol Nurs 24, 24–33.
Corder, L.S., Woodbury, M.A., Manton, K.G., 1996. Proxy response patterns among the aged: Effects on estimates of health status and medical care utilization from the 1982–1984 long-term care surveys. Journal of Clinical Epidemiology 49, 173–182. https://doi.org/10.1016/0895-4356(95)00507-2
Dassel, K.B., Schmitt, F.A., 2008. The impact of caregiver executive skills on reports of patient functioning. Gerontologist 48, 781–792.
Datta Gupta, N., Larsen, M., 2010. The impact of health on individual retirement plans: self-reported versus diagnostic measures. Health Econ 19, 792–813. https://doi.org/10.1002/hec.1523
Davin, B., Paraponaris, A., Verger, P., 2009. Socioeconomic determinants of the need for personal assistance reported by community-dwelling elderly: Empirical evidence from a French national health survey. The Journal of Socio-Economics 38, 138–146. https://doi.org/10.1016/j.socec.2008.10.005
Davin, B., Paraponaris, A., Verger, P., 2005. Facteurs démographiques et socio-économiques associés aux besoins d’aide des personnes âgées vivant à domicile : une étude à partir de l’enquête Handicaps-Incapacités-Dépendance. Revue d’Épidémiologie et de Santé Publique 53, 509–524. https://doi.org/10.1016/S0398-7620(05)84728-5
de Meijer, C., Bakx, P., van Doorslaer, E., Koopmanschap, M., 2015. Explaining Declining Rates of Institutional LTC Use in the Netherlands: A Decomposition Approach. Health Econ. 24, 18–31. https://doi.org/10.1002/hec.3114
Deb, P., Trivedi, P.K., 1997. Demand for Medical Care by the Elderly: A Finite Mixture Approach. J. Appl. Econ. 12, 313–336. https://doi.org/10.1002/(SICI)1099-1255(199705)12:3<313::AID-JAE440>3.0.CO;2-G
Desai, M.M., Lentzner, H.R., Weeks, J.D., 2001. Unmet Need for Personal Assistance With Activities of Daily Living Among Older Adults. Gerontologist 41, 82–88. https://doi.org/10.1093/geront/41.1.82
Doiron, D., Fiebig, D.G., Johar, M., Suziedelyte, A., 2015. Does self-assessed health measure health? Applied Economics 47, 180–194. https://doi.org/10.1080/00036846.2014.967382
Dorevitch, M.I., Cossar, R.M., Bailey, F.J., Bisset, T., Lewis, S.J., Wise, L.A., MacLennan, W.J., 1992. The accuracy of self and informant ratings of physical functional capacity in the elderly. J Clin Epidemiol 45, 791–798.
Elinson, J., Trussell, R.E., 1957. Some Factors Relating to Degree of Correspondence for Diagnostic Information as Obtained by Household Interviews and Clinical Examinations. Am J Public Health Nations Health 47, 311–321.
https://doi.org/10.2105/AJPH.47.3.311
Elliott, M.N., Beckett, M.K., Chong, K., Hambarsoomians, K., Hays, R.D., 2008. How Do Proxy Responses and Proxy-Assisted Responses Differ from What Medicare Beneficiaries Might Have Reported about Their Health Care? Health Serv Res 43, 833–848. https://doi.org/10.1111/j.1475-6773.2007.00820.x
Enterline, P.E., Capt, K.G., 1959. A validation of information provided by household respondents in health surveys. Am J Public Health Nations Health 49, 205–212.
Epstein, A.M., Hall, J.A., Tognetti, J., Son, L.H., Conant, L., 1989. Using proxies to evaluate quality of life. Can they provide valid information about patients’ health status and satisfaction with medical care? Med Care 27, S91-98. Etilé, F., Milcent, C., 2006. Income-related reporting heterogeneity in self-assessed health: evidence from France. Health
Econ 15, 965–981. https://doi.org/10.1002/hec.1164
Graham, P., Jackson, R., 1993. Primary versus proxy respondents: comparability of questionnaire data on alcohol consumption. Am. J. Epidemiol. 138, 443–452.
Greene, W., 2012. Econometric Analysis - 7th Edition, 7th ed. Pearson.
Groneck, M., 2017. Bequests and Informal Long-Term Care: Evidence from HRS Exit Interviews. Journal of Human Resources 52, 531–572.
Grootendorst, P.V., Feeny, D.H., Furlong, W., 1997. Does it matter whom and how you ask? inter- and intra-rater agreement in the Ontario Health Survey. J Clin Epidemiol 50, 127–135.
Gurmu, S., Elder, J., 2008. A bivariate zero-inflated count data regression model with unrestricted correlation. Economics Letters 100, 245–248. https://doi.org/10.1016/j.econlet.2008.02.001
Gurmu, S., Elder, J., 2000. Generalized bivariate count data regression models. Economics Letters 68, 31–36. https://doi.org/10.1016/S0165-1765(00)00225-1
Han, S., Vytlacil, E.J., 2017. Identification in a generalization of bivariate probit models with dummy endogenous regressors. Journal of Econometrics 199, 63–73. https://doi.org/10.1016/j.jeconom.2017.04.001
Highton, B., 2005. Self-Reported versus Proxy-Reported Voter Turnout in the Current Population Survey. Public Opin Q 69, 113–123. https://doi.org/10.1093/poq/nfi003
Hill, S.C., Pylypchuk, Y., 2006. Reports of fewer activity limitations: recovery, survey fatigue, or switching respondent? Med Care 44, I73-81. https://doi.org/10.1097/01.mlr.0000208199.13219.8b
Hsu, T., Loscalzo, M., Ramani, R., Forman, S., Popplewell, L., Clark, K., Katheria, V., Strowbridge, R., Rinehart, R., Smith, Dan, Matthews, K., Dillehunt, J., Feng, T., Smith, David, Sun, C., Hurria, A., 2017. Are Disagreements in Caregiver and Patient Assessment of Patient Health Associated with Increased Caregiver Burden in Caregivers of Older Adults with Cancer? Oncologist 22, 1383–1391. https://doi.org/10.1634/theoncologist.2017-0085
Hung, S.-Y., Pickard, A.S., Witt, W.P., Lambert, B.L., 2007. Pain and depression in caregivers affected their perception of pain in stroke patients. J Clin Epidemiol 60, 963–970. https://doi.org/10.1016/j.jclinepi.2006.12.010
Hyland, A., Cummings, K.M., Lynn, W.R., Corle, D., Giffen, C.A., 1997. Effect of Proxy-reported Smoking Status on Population Estimates of Smoking Prevalence. Am J Epidemiol 145, 746–751. https://doi.org/10.1093/aje/145.8.746
Iezzoni, L.I., McCarthy, E.P., Davis, R.B., Siebens, H., 2000. Mobility problems and perceptions of disability by self-respondents and proxy self-respondents. Med Care 38, 1051–1057.