HAL Id: hal-00945152
https://hal-enpc.archives-ouvertes.fr/hal-00945152
Submitted on 27 Oct 2020
HAL is a multi-disciplinary open access
archive for the deposit and dissemination of
sci-entific research documents, whether they are
pub-lished or not. The documents may come from
teaching and research institutions in France or
abroad, or from public or private research centers.
L’archive ouverte pluridisciplinaire HAL, est
destinée au dépôt et à la diffusion de documents
scientifiques de niveau recherche, publiés ou non,
émanant des établissements d’enseignement et de
recherche français ou étrangers, des laboratoires
publics ou privés.
application to Paris, France
Florian Couvidat, Youngseob Kim, Karine Sartelet, Christian Seigneur,
Nicolas Marchand, J. Sciare
To cite this version:
Florian Couvidat, Youngseob Kim, Karine Sartelet, Christian Seigneur, Nicolas Marchand, et al..
Modeling secondary organic aerosol in an urban area: application to Paris, France. Atmospheric
Chemistry and Physics, European Geosciences Union, 2013, 13, pp.983-996.
�10.5194/acp-13-983-2013�. �hal-00945152�
Atmos. Chem. Phys., 13, 983–996, 2013 www.atmos-chem-phys.net/13/983/2013/ doi:10.5194/acp-13-983-2013
© Author(s) 2013. CC Attribution 3.0 License.
Atmospheric
Chemistry
and Physics
Modeling secondary organic aerosol in an urban area:
application to Paris, France
F. Couvidat1, Y. Kim1, K. Sartelet1, C. Seigneur1, N. Marchand2,3, and J. Sciare4
1CEREA, Joint Laboratory ´Ecole des Ponts ParisTech/EDF R&D, Universit´e Paris-Est, 77455 Marne-la-Vall´ee, France 2Aix-Marseille Universit´e, Laboratoire Chimie Environnement, 13331, Marseille cedex 03, France
3CNRS, FRE 3416, 13331, Marseille cedex 03, France 4LSCE, CNRS-CEA-UVSQ, Gif-sur-Yvette, France Correspondence to: F. Couvidat (couvidaf@cerea.enpc.fr)
Received: 1 August 2012 – Published in Atmos. Chem. Phys. Discuss.: 10 September 2012 Revised: 5 December 2012 – Accepted: 3 January 2013 – Published: 23 January 2013
Abstract. A secondary organic aerosol (SOA) model, H2O (Hydrophilic/Hydrophobic Organic), is evaluated over the Paris area. This model treats the formation of SOA with two kinds of surrogate species: hydrophilic species (which con-dense preferentially on an aqueous phase) and hydrophobic species (which condense only on an organic phase). These surrogates species are formed from the oxidation in the atmo-sphere of volatile organic compounds (VOC) by radicals (HO and NO3) and ozone. These VOC are either biogenic
(iso-prene, monoterpenes and sesquiterpenes) or anthropogenic (mainly aromatic compounds). This model includes the for-mation of aerosols from different precursors (biogenic pre-cursors, aromatics), and semi-volatile organic compounds (SVOC) from traffic. The H2O aerosol model was incorpo-rated into the Polyphemus air quality modeling platform and applied to the Paris area and evaluated by comparison to mea-surements performed during the Megapoli campaign in July 2009.
The comparison to measurements in the suburbs and in the city center of Paris shows that the model gives satisfactory results for both elemental carbon (EC) and organic carbon (OC). However, the model gives a peak of OC concentrations in the morning due to high emissions from traffic, which does not appear in measurements. Uncertainties in the modeled temperature, which can affect the gas-particle partitioning, in the partitioning of primary SVOC or underestimation of pri-mary organic aerosol (POA) evaporation by the model could explain the differences between model and measurements. Moreover, using a theoretical mechanism for the oxidation of primary SVOC and intermediate volatility organic
com-pounds (IVOC), POA concentrations were found to be likely overestimated by models due to the use of simple partition-ing constants (which do not take into account the affinity of a compound with the liquid aerosol solution) or due to the assumption that the organic aerosol solution is a one-phase ideal solution. The organic aerosol in the city center of Paris was found to be originating mostly from distant sources with only 30 to 38 % due to local sources.
1 Introduction
Fine particulate matter (PM) with an aerodynamic diameter inferior to 2.5 µm (PM2.5) is regulated because of its impact
on human health, in particular, in urban areas with a high traf-fic density. Furthermore, PM2.5 degrades atmospheric
visi-bility and influences climate change. Organic aerosol con-centrations are difficult to represent in three-dimensional (3-D) air quality models, which estimate PM2.5 formation, due
to the complexity of phenomena involved (gas and parti-cle phase chemistry, oligomerization, hygroscopicity, non-ideality of particles) and to the large number of organic species involved originating from diverse sources (anthro-pogenic and biogenic). A large fraction of PM emissions from traffic is organic and, therefore, could contribute signifi-cantly to organic PM2.5in urban areas. As 19 of the 20 largest
European cities exceed the World Health Organization Air Quality Guideline (10 µg m−3annual mean), efforts have to be made to understand organic aerosol formation in urban areas and to represent organic matter (OM) as accurately as
possible in air quality models that are used for the design of emission control strategies. Organic PM is either primary (directly emitted as particles) or secondary (formed in the atmosphere by the formation of low-volatility compounds by chemical reaction). Both primary organic aerosols (POA) and secondary organic aerosols (SOA) are currently poorly understood (Kanakidou et al., 2005; Carlton et al., 2009; Jimenez et al., 2009).
Organic aerosol formation in an urban area has been stud-ied in numerous studies over US cities (e.g., Griffin et al., 2002; Russell and Allen, 2005; Vutukuru et al., 2006; Mur-phy and Pandis, 2009) and over Mexico City during the MI-LAGRO project (e.g., Dzepina et al., 2011; Hodzic et al., 2010; Tsimpidi et al., 2011; Shrivastava et al., 2011). How-ever, the modeling of organic aerosols in a European ur-ban megacity has not been extensively studied yet, although some comparisons of model simulations to measurements have been reported (Sciare et al., 2010).
In this work, a model based on the molecular surrogate ap-proach is used to simulate organic aerosols in the Paris area: the Hydrophilic/Hydrophobic Organic (H2O) model (Cou-vidat et al., 2012). The molecular surrogate approach (Pun et al., 2002, 2006) consists in associating experimental data with several molecular structures, which are surrogates of a large number of SOA species, to extrapolate SOA formation from smog chambers to the atmosphere. In the molecular sur-rogate approach, several properties, which are typically not taken into account in empirical approaches, can be readily es-timated (e.g., condensation on an aqueous phase, oligomer-ization, hygroscopicity, non-ideality) and treated explicitly in the model. This model includes primary semi-volatile or-ganic compounds (SVOC), oxidation of several precursors (aromatics, isoprene, monoterpenes, sesquiterpenes) under various conditions (oxidation by HO under high-NOx and
low-NOxconditions, oxidation by O3and by NO3) and
pro-cesses (condensation on an organic phase or an aqueous phase, oligomerization, hygroscopicity, and non-ideality).
The H2O organic model has already been implemented in the Polyphemus air quality platform (Mallet et al., 2007) and evaluated over Europe from June 2002 to July 2003 (Couvi-dat et al., 2012). This evaluation showed that, even if H2O tends to underestimate organic carbon (OC) concentrations, it gives satisfactory results as the model performance criteria proposed by Boylan and Russell (2006) are met for OC con-centrations and as it almost achieves the model goal criteria. However, the model has not been evaluated at the scale of a city and the performance of the model over on urban area with fresh emissions from traffic is unknown. Therefore, we present here a model performance evaluation over a megac-ity: organic aerosols are simulated over the Paris area during July 2009 and are compared to the results of the Megapoli (Megacities: emissions, urban, regional and Global Atmo-spheric POLlution and climate effects, and Integrated tools for assessment and mitigation) campaign. The origins of or-ganic aerosols in Paris and the effect of a detailed treatment
of primary organic aerosols on modeled concentrations are also investigated.
2 Model presentation
The Polair3D air quality model (Sartelet et al., 2007) of the Polyphemus air quality platform (Mallet et al., 2007) is used to simulate air quality over the Paris area. It is used with the Carbon Bond 05 model (CB05) (Sarwar et al., 2008) for the gas phase chemistry, ISORROPIA (Nenes et al., 1998) for the formation of inorganic aerosol, the SIze REsolved Aerosol Model (SIREAM) (Debry et al., 2007) for simulating the dy-namics of the aerosol size distribution, and the H2O model for SOA formation (Couvidat et al., 2012). RACM is modi-fied to take into account the reactions described by Couvidat et al. (2012).
H2O is based on the AER/EPRI/Caltech (AEC) model (Pun et al., 2002, 2003, 2006; Kim et al., 2011), which has already been used by Royer et al. (2011) to simulate par-ticle concentrations. It distinguishes two kinds of surrogate SOA species: hydrophilic species (which condense mainly on an aqueous phase) and hydrophobic species (which con-dense only on an organic phase due to their low affinity with water). Hydrophilic species may also condense on an organic phase in the absence of aqueous particles, i.e., at very low rel-ative humidities. Distinction between hydrophobic and hy-drophilic compounds is based on their octanol/water coef-ficient (Pun et al., 2006) or their partitioning between the organic and aqueous phases (Couvidat and Seigneur, 2011). However, aqueous-phase chemistry, which could lead to sig-nificant amount of SOA (Ervens et al., 2011), is not taken into account in this study and will be the object of future studies. Two approaches are used in this study to treat primary SVOC and their oxidation products. The first approach called “H2O-Ref” uses the parameterization of Couvidat et al. (2012) for primary and aged organic species. In this pa-rameterization, POA are treated as SVOC. Their concentra-tions in the particle phase depend on the amount of OM on which SVOC will partition and on temperature (which in-fluences the volatility of compounds). SVOC emissions are estimated from POA emissions by using a SVOC/POA fac-tor of 5 (Couvidat et al., 2012). Then, SVOC are distributed among three compounds: POAlP, POAmP and POAhP rep-resenting respectively 25 %, 32 % and 43 % of SVOC, with partitioning constants (inverse of the saturation concentra-tions C∗ defined by Donahue et al., 2006) of 1.1 m3µg−1,
0.0116 m3µg−1 and 0.00031 m3µg−1, respectively. More-over, SVOC in the gas phase can be oxidized and form less volatile compounds. The aging of primary SVOC is taken into account with the following three reactions:
POAlP + HO−→k SOAlP (R1)
F. Couvidat et al.: Modeling SOA formation over the Paris area 985
POAhP + HO−→k SOAhP (R3)
with k the kinetic rate constant equal to 2 × 10⁻¹¹molecule−1cm3s−1 (Grieshop et al., 2009). SOAlP, SOAmP and SOAhP are the aged SVOC and have respectively partitioning constants of 110.0 m3µg−1, 1.16 m3µg−1 and 0.031 m3µg−1. POAlP, POAmP, and POAhP are assigned an OM/OC ratio of 1.3 whereas SOAlP, SOAmP, and SOAhP are assigned an OM/OC ratio of 1.82 due to oxygen addition.
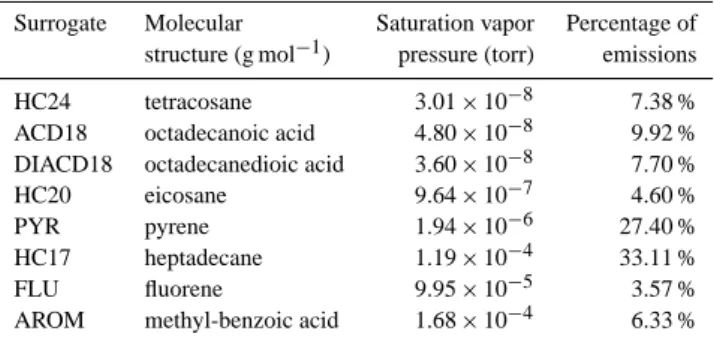
The second type of mechanism called “H2O-Mech” uses a detailed treatment of primary and aged SVOC where a speciation of primary SVOC is used to attribute molecular structures to primary compounds and to estimate the forma-tion of secondary organic aerosol by aging. The main goal of this mechanism is to attribute molecular structure to primary SVOC and their oxidation products to estimate their activity coefficients in the atmosphere with the UNIversal Functional group Activity Coefficient (UNIFAC) thermodynamic model (Fredenslund et al., 1975). The impact of activity coefficients on the partitioning of primary SVOC and their oxidation products are not taken into account in “H2O-Ref” whereas it is possible that POA and SOA have low affinities which each other (Pun, 2008; Song et al., 2007). With “H2O-Mech”, the structure of primary SVOC and their oxidation products are known and it is, therefore, possible to estimate the impact of activity coefficients on their partitioning. The speciation is based on the data of Schauer et al. (1999) on the identi-fied fraction of SVOC from medium-duty diesel trucks (14 % of SVOC). Molecules with similar properties (high, medium or low volatility) and type (acids, alkanes, polycyclic aro-matic hydrocarbons (PAH)) are lumped into a single surro-gate species. Isaacman et al. (2012) found that about 73 % of SVOC above 15 carbons are aliphatic and 27 % are aro-matic. With the speciation used in this study, 70 % of SVOC above 15 carbons are aliphatic and 30 % are aromatic. The SVOC speciation used here is, therefore, consistent with the results of Isaacman et al. (2012). Saturation vapor pressures and the emission fractions are chosen to respect the same di-lution curve than in the previous approach. Table 1 describes these primary SVOC and their properties.
The surrogate species are then used to develop an oxida-tion mechanism of primary SVOC. For the species HC17, the oxidation mechanism is based on the data of Presto et al. (2010) by fitting the saturation vapor pressure and mass yields of products. The most volatile product, AnALKF17, was assumed to be a product of first generation (struc-ture of 1,4-hydroxycarbonyls, which has been observed by Lim and Ziemann, 2009a), whereas the less volatile prod-uct AnALKS17 was assumed to be of second generation (structure of a hydroxy-dinitrate, which has been observed by Lim and Ziemann, 2009a). For the other species, oxida-tion was assumed to produce only less volatile species with-out fractionation. For the alkane species, HC20 and HC24, oxidation was assumed to add one hydroxy and one
car-Table 1. Properties of the different surrogate primary SVOC
species.
Surrogate Molecular Saturation vapor Percentage of
structure (g mol−1) pressure (torr) emissions
HC24 tetracosane 3.01 × 10⁻⁸ 7.38 %
ACD18 octadecanoic acid 4.80 × 10⁻⁸ 9.92 %
DIACD18 octadecanedioic acid 3.60 × 10⁻⁸ 7.70 %
HC20 eicosane 9.64 × 10⁻⁷ 4.60 %
PYR pyrene 1.94 × 10⁻⁶ 27.40 %
HC17 heptadecane 1.19 × 10⁻⁴ 33.11 %
FLU fluorene 9.95 × 10⁻⁵ 3.57 %
AROM methyl-benzoic acid 1.68 × 10⁻⁴ 6.33 %
bonyl group (1,4-hydroxycarbonyls are one of the first gener-ation products formed by oxidgener-ation of alkanes Lim and Zie-mann, 2009a,b). The oxidation of the acid species, ACD18 and DIACD18, was assumed to be similar to the oxida-tion of the alkanes. For the PAH species, PYR and FLU, oxidation was assumed to add two carbonyl groups (1,4-naphthoquinone and 9,10-phenanthrequinone are among the main products of the oxidation of naphthalene and phenan-threne respectively Wang et al., 2007; Lee and Lane, 2009, 2010; Kautzman et al., 2010). For the aromatics, AROM, oxidation was assumed to add a hydroxy group on the aro-matic ring. The effect of a group addition on the saturation vapor pressure was estimated using the method of Pankow and Asher (2008). The kinetics of the oxidation of alkanes are taken from Calvert et al. (2008). The kinetics of the other compounds were fitted to reproduce the results of the first ap-proach with the observed oxidation of Robinson et al. (2007) during the first hours of the oxidation at 10 µg m−3of POA.
Reactions leading to SOA formation from primary SVOC ox-idation and the properties of the SOA products are presented in Tables 2 and 3, respectively. This mechanism could be im-proved because it only takes into account one oxidation step, assumes that oxidation only leads to less volatile compounds and because aromatics oxidation products are mainly unsat-urated ring-opened products containing aldehyde groups that should oligomerize and react rapidly leading to further ag-ing. Nevertheless, the effect of a single-step aging on activity coefficients and on the interactions between POA and SOA can be estimated with this mechanism.
Formation of SOA from the oxidation of some interme-diate volatility organic compounds (IVOC) were also in-cluded in “H2O-Mech”. We used results from Schauer et al. (1999) on identified products from diesel exhaust to provide a speciation of IVOC. IVOC are separated into three prod-ucts: HC15 for long-chain alkanes, acids and aldehydes (pen-tadecane is used as surrogate), NAPH for naphthalene and MNAPH for alkylnaphthalenes (2-methylnaphtalene is used as surrogate). IVOC from diesel exhaust was assumed to con-sist roughly of 79 % of HC15, 6 % of NAPH and 15 % of MNAPH. The oxidation of HC15 is chosen to be similar to
Table 2. Reactions of oxidation of primary SVOC (top panel) and IVOC (bottom panel) species (the oxidant species is listed as both reactant
and product to ensure that the gas phase mechanism is not affected by these additional reactions).
Reaction Kinetic rate parameter (molecule−1cm3s−1) HC24 + HO → AnALKF24 + HO 1.19 × 10⁻¹¹ ACD18 + HO → AnACD18 + HO 1.1 × 10⁻¹¹ DIACD18 + HO → AnDIACD18 + HO 1.1 × 10⁻¹¹ HC20 + HO → AnALKF20 + HO 1.13 × 10⁻¹¹ PYR + HO → 1.0 AnPYR + HO 3.0 × 10⁻¹¹ HC17 + HO → 0.516 AnALKF17 + 0.0634 AnALKS17 + HO 1.09 × 10⁻¹¹ FLU + HO → 1.0 AnFLU + HO 3.0 × 10⁻¹¹ AROM + HO → 1.0 AnAROM + HO 3.0 × 10⁻¹¹ HC15 + HO → 0.053 AnALKS15 + 0.46 AnALKF15 + HO 1.07 × 10⁻¹¹ NAPH + HO → NAPHP + HO 2.44 × 10⁻¹¹
NAPHP + HO2→0.44 AnPAHlN + HO2 3.75 × 10⁻¹³×exp(980T )
NAPHP + ACO3→0.44 AnPAHlN + ACO3 7.40 × 10⁻¹³×exp(765T ) NAPHP + MO2→0.44 AnPAHlN + MO2 3.56 × 10⁻¹⁴×exp(708T )
NAPHP + NO → 0.26 AnPAHhN + NO 2.70 × 10⁻¹¹×exp(360T ) NAPHP + NO3→0.26 AnPAHhN + NO3 1.2 × 10⁻¹²
MNAPH + HO → MNAPHP + HO 2.44 × 10⁻¹¹
MNAPHP + HO2→0.46 AnPAHlN + HO2 3.75 × 10⁻¹³×exp(980T ) MNAPHP + ACO3→0.46 AnPAHlN + ACO3 7.40 × 10⁻¹³×exp(765T )
MNAPHP + MO2→0.46 AnPAHlN + MO2 3.56 × 10⁻¹⁴×exp(708T )
MNAPHP + NO → 0.37 AnPAHhN + NO 2.70 × 10⁻¹¹×exp(360T ) MNAPHP + NO3→0.37 AnPAHhN + NO3 1.2 × 10⁻¹²
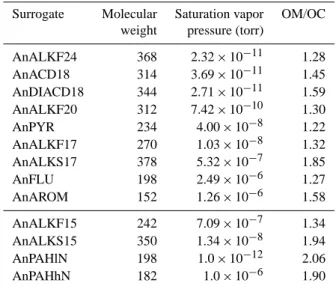
Table 3. Properties of the different surrogate secondary SVOC
species formed from primary SVOC oxidation (top panel) and IVOC oxidation (bottom panel).
Surrogate Molecular Saturation vapor OM/OC weight pressure (torr)
AnALKF24 368 2.32 × 10⁻¹¹ 1.28 AnACD18 314 3.69 × 10⁻¹¹ 1.45 AnDIACD18 344 2.71 × 10⁻¹¹ 1.59 AnALKF20 312 7.42 × 10⁻¹⁰ 1.30 AnPYR 234 4.00 × 10⁻⁸ 1.22 AnALKF17 270 1.03 × 10⁻⁸ 1.32 AnALKS17 378 5.32 × 10⁻⁷ 1.85 AnFLU 198 2.49 × 10⁻⁶ 1.27 AnAROM 152 1.26 × 10⁻⁶ 1.58 AnALKF15 242 7.09 × 10⁻⁷ 1.34 AnALKS15 350 1.34 × 10⁻⁸ 1.94 AnPAHlN 198 1.0 × 10⁻¹² 2.06 AnPAHhN 182 1.0 × 10⁻⁶ 1.90
that of HC17 and is based on fitting to data of Presto et al. (2010) for SOA formation from the oxidation of pentade-cane. Data from Chan et al. (2009) are used to fit two prod-ucts from the oxidation of NAPH and MNAPH: AnPAHlN (for SOA formed by PAH oxidation under low-NOx
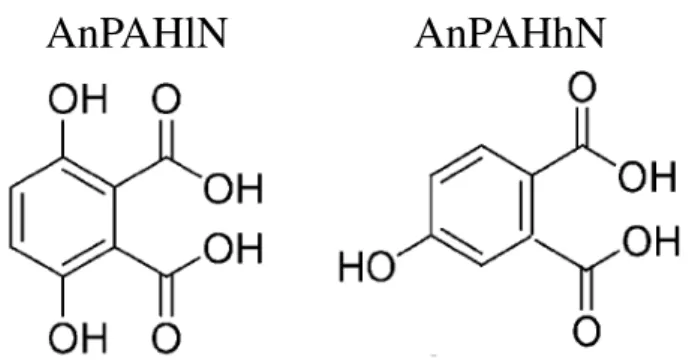
condi-tions) and AnPAHhN (for SOA formed by PAH oxidation under high-NOxconditions). The structures for these
surro-gates, shown in Fig. 1, are those of some major compounds detected under low-NOx and high-NOx by Kautzman et al.
(2010). These two structures seem suitable as surrogate com-pounds because their OM/OC ratios of 2.06 and 1.90 are sim-ilar to the OM/OC ratios for SOA from naphthalene oxida-tion of 1.96 for low-NOxconditions and 1.89 for high-NOx
conditions found by Chhabra et al. (2010). The kinetics of oxidation of NAPH and MNAPH with HO are taken from Calvert et al. (2002) for the reaction of naphthalene with HO. To determine whether the radical formed from the oxidation of NAPH or MNAPH (RO2) will react under low-NOx
con-ditions (RO2reacts with the radical HO2, the methylperoxy
radical MO2or the peroxyacetyl radical ACO3) or high-NOx
conditions (RO2reacts with the radical NO3or NO), the
ki-netics of the reactions of the radical formed from toluene ox-idation (TOLP) with these radicals used by Couvidat et al. (2012) are used. Reactions leading to SOA formation from
F. Couvidat et al.: Modeling SOA formation over the Paris area 987
Table 3. Properties of the different surrogate secondary SVOC species formed from primary SVOC
oxidation (top panel) and IVOC oxidation (bottom panel).
Surrogate
Molecular weight
Saturation vapor pressure (torr)
OM/OC
AnALKF24
368
2.32 × 10
−111.28
AnACD18
314
3.69 × 10
−111.45
AnDIACD18
344
2.71 × 10
−111.59
AnALKF20
312
7.42 × 10
−101.30
AnPYR
234
4.00 × 10
−81.22
AnALKF17
270
1.03 × 10
−81.32
AnALKS17
378
5.32 × 10
−71.85
AnFLU
198
2.49 × 10
−61.27
AnAROM
152
1.26 × 10
−61.58
AnALKF15
242
7.09 × 10
−71.34
AnALKS15
350
1.34 × 10
−81.94
AnPAHlN
198
1.0 × 10
−122.06
AnPAHhN
182
1.0 × 10
−61.90
AnPAHlN
AnPAHhN
Fig. 1. Molecular structures of AnPAHlN and AnPAHhN used as surrogates for SOA formation from
naphthalene and alkylnaphthalene oxidation under low-NO
xand high-NO
xconditions, respectively.
27
Fig. 1. Molecular structures of AnPAHlN and AnPAHhN used assurrogates for SOA formation from naphthalene and alkylnaphtha-lene oxidation under low-NOxand high-NOx conditions,
respec-tively.
IVOC oxidation and the properties of the SOA products are presented in Tables 2 and 3, respectively.
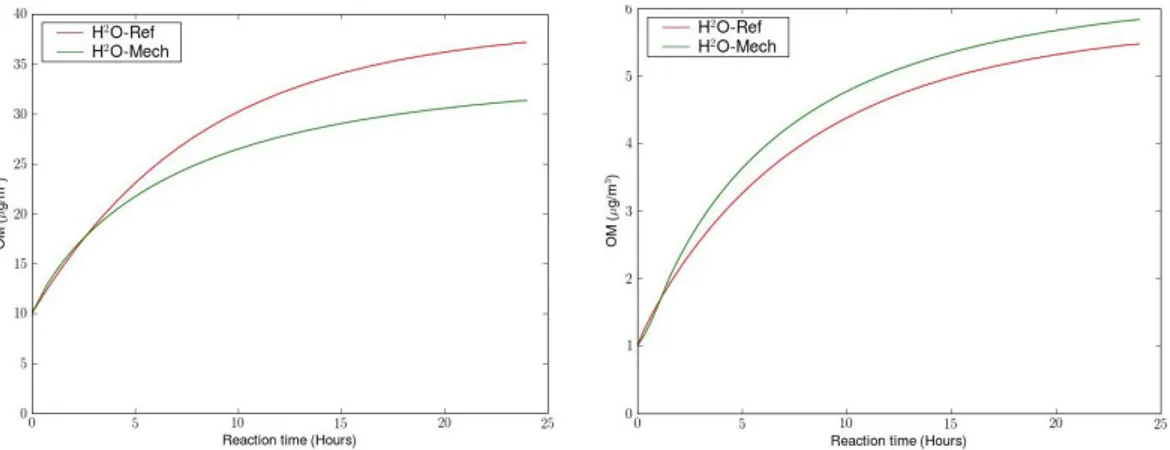
Figure 2 shows the concentrations of SOA from primary SVOC oxidation computed by a box model with the two mechanisms for 10 µg m−3 and 1 µg m−3 of POA at 298 K and [HO] = 2.0 × 10⁶molecules cm−3 (concentrations used to have an OM evolution similar to Robinson et al., 2007). The two mechanisms “H2O-Ref” and “H2O-Mech”, give similar concentrations of OM at both low and high organic aerosol loadings whereas these two mechanisms used differ-ent approaches. One significant difference between “H2 O-Mech” and “H2O-Ref” for the formation of SOA from pri-mary SVOC is in the degree of oxidation of SOA. SOA from “H2O-Ref” has a OM/OC ratio of 1.82, which is rather high for first-generation oxidation products. OM/OC ratios for “H2O-Mech” are more realistic (ratios between 1.27 and 1.85) because it uses molecular structures of some first-generation oxidation products. “H2O-Mech” and “H2O-Ref” should then give similar amounts of SOA from primary SVOC oxidation, when used in a 3-D air quality model simu-lation, but “H2O-Mech” should give higher concentrations of OC than “H2O-Ref”. Moreover, as the “H2O-Mech” mech-anism only takes into account one oxidation step, it proba-bly underestimates aging of SVOC that would become less volatile and more oxidized. More work should be done to develop a complete and more realistic aging mechanism for SOA formation from primary SVOC with numerous oxida-tion steps. Nevertheless, the use of “H2O-Mech” is useful here to obtain insight on the interaction between POA and SOA species, because such information is not available oth-erwise from mechanisms such as “H2O-Ref”.
3 Simulation setup and measurement dataset
OM was simulated over the Paris area during the Megapoli campaign of July 2009. Input data to Polair3D/Polyphemus were prescribed as follows, the simulation domain being the
same as in Royer et al. (2011). Boundary conditions for gaseous and particulate species were obtained from nested simulations over Europe and France. These simulations were conducted using the same data as Couvidat et al. (2012), i.e., the EMEP emission inventory (Vestreng, 2003) was used for anthropogenic emissions and the MEGAN emission model with the EFv2.1 dataset (Guenther et al., 2006) was used for biogenic VOC emissions. For simulations over the Paris area, anthropogenic emissions of gases and particles were obtained from the Airparif (the Paris air quality agency) in-ventory for the year 2005. Meteorology was simulated with the Weather Research & Forecasting (WRF) model (WRF) using an urban canopy model and an updated Corine land-use data base (Kim, 2011) with the YSU parameterization (Hong et al., 2006) for the planetary boundary layer (PBL) dynamics.
Emissions of PM from traffic were assumed to con-sist of 50 % EC, 40 % POA, and 10 % volatile non-carbonaceous PM based on measurements conducted in Paris in summer 2010 by Airparif (2011). Emissions of EI-POA (Emissions Inventory POA) are transformed into SVOC emissions using a SVOC/EI-POA ratio of 5 as done and dis-cussed by Couvidat et al. (2012). To estimate IVOC, we used an IVOC/SVOC factor of 1.70 based on emissions of Pye and Seinfeld (2010) for anthropogenic sources, which should be the major source of SVOC in the Paris area.
PM2.5OC was measured at two stations: the SIRTA station
(Site Instrumental de Recherche par T´el´ed´etection Atmo-sph´erique, Haeffelin et al., 2005), located southwest of Paris in a suburban setting, and the LHVP (Laboratoire d´Hygi`ene de la Ville de Paris) station located in downtown Paris. Two measurement datasets were used to compare model re-sults to measurements. The first dataset uses daily measure-ments of PM2.5 OC and EC with aerosol filters at both
sta-tions. PM2.5filter samples (150 mm-diameter quartz fiber
fil-ters, Tissuquartz®) were collected on a 12-h basis, using a high-volume sampler (Digitel, DA-80). A 1 cm2filter punch was analyzed for elemental carbon (EC) and organic carbon (OC), using a Sunset Lab analyzer and following the EU-SAAR 2 protocol temperature program proposed by Cavalli et al. (2010).
The second dataset uses semi-continuous hourly concen-trations of EC and OC in PM2.5, which were obtained at
LHVP from an OCEC Sunset field instrument (Sunset Labo-ratory, Forest Grove, OR, USA; Bae et al., 2004) running at 8 L mn−1. A denuder provided by the manufacturer was set up-stream in order to remove possible adsorption of VOC onto the filter used to collect PM2.5 in the instrument.
Measure-ment uncertainty given by the OCEC Sunset field instruMeasure-ment is poorly described in literature, although a 20 % uncertainty was estimated by Peltier et al. (2007).
Preliminary comparisons of OC and EC obtained by this instrument have been performed in the region of Paris against low-volume VOC denuded manual filter sampling
Fig. 2. Concentrations of SOA from primary SVOC oxidation computed with the two mechanisms for 10 µg m−3(left) and 1 µg m−3(right) of POA.
EC (µg m−3) OM (µg m−3)
Fig. 3. Simulated concentrations in µg m−3of EC (left) and OM (right) for July 2009. The red and black crosses correspond to the LHVP and SIRTA sites, respectively.
28
Fig. 2. Concentrations of SOA from primary SVOC oxidation computed with the two mechanisms for 10 µg m−3(left) and 1 µg m−3(right) of POA.
and showed very consistent results (Sciare et al., 2010, 2011). During the Megapoli campaign, a comparison was also per-formed between EC (OCEC Sunset field instrument) and un-corrected Black Carbon provided by the Aethalometer instru-ment (Magee Scientific, model AE31) leading also to very satisfactory results (r2=0.96; N = 620; with a slope of 1.65 without correction of the mass absorption efficiency; Sciare et al., unpublished data).
During this Megapoli campaign, dynamic filter blanks were performed on a daily basis by placing a total filter up-stream of the PM2.5cyclone of the OCEC Sunset field
instru-ment. A systematic offset of 1.0 µg m−3was found for July
2009. This offset, which depends strongly on the sampled air volume is traditionally considered to be due to VOC absorp-tion (Bae et al., 2004; Arhami et al., 2006; Polidori et al., 2006) and ranges from 0.5 to 2.0 µg m−3 (Offenberg et al., 2007). The filters and Sunset instrument measurements are consistent for EC at the LHVP station. However, filter mea-surements of OC are much higher than the Sunset instrument measurements especially for the second half of July 2009. The differences between the two measurements could be due to condensation of SVOC or adsorption of some VOC on the filter or to the evaporation of some SVOC from the Sun-set instrument. However, as OC concentrations during this campaign are very low, it is not surprising that the results from these two measurements are different since the analyt-ical bias (from the sampling and the chemanalyt-ical analysis) are then relatively strong compared to the signal.
Three simulations were conducted: two simulations with the “H2O-Ref” mechanism with and without anthropogenic emissions in the Paris area (all other emissions being the same) to estimate the local contribution of OM and one sim-ulation with the the “H2O-Mech” with all emissions. The simulation with “H2O-Ref” mechanism with anthropogenic emissions reaches the criteria of performance of Russel and Dennis (2000) for ozone (mean normalized bias of −44.2 % and mean normalized gross error of 15.4 %) and the model
performance goal of Boylan and Russell (2006) for PM2.5
(mean fractional bias of −9.0 % and mean fractional error of 39 %).
4 Comparison of the model results with measurements Concentrations of EC and OC simulated with “H2O-Ref” are shown in Fig. 3 at the LHVP and SIRTA stations, and are compared with the 12-h filter measurements at both sites and with hourly Sunset field instrument measurements (with or without the offset of 1 µg m−3) average over 12-h at the LHVP site. Comparisons with measurements for EC and OC are shown in Figs. 4 and 5, respectively with correlations and root mean square errors (RMSE) between filter measure-ments and model concentrations.
The model reproduces the high concentrations of OC at the SIRTA and LHVP sites on 1 July, which is a day of high pollution (Royer et al., 2011) and shows satisfactory results at the SIRTA site for EC and OC, although they are both slightly overestimated (0.50 µg m−3of modeled EC against 0.38 µg m−3 in measurements and 2.64 µg m−3 of modeled OC against 2.27 µg m−3in measurements). As EC is an in-ert pollutant (i.e. it does not undergo chemical transforma-tion), it may indicate an overestimation of anthropogenic emissions near the SIRTA site. At the LHVP site, the model shows satisfactory results for EC until 26 July (1.08 µg m−3 of modeled EC against 1.03 µg m−3in filter measurements)
but greatly underestimates EC and OC concentrations be-tween 26 and 29 July (1.22 µg m−3of modeled EC on
aver-age against 2.11 µg m−3in filter measurements). This under-estimation could be explained by difficulties in modeling ur-ban meteorology and/or underestimation of emissions due to missing sources: high traffic emissions due to holiday depar-tures, meteorology potentially favorable to PM resuspension, missing emissions of particles from cooking from the Air-parif inventory, whereas cooking was found by Prevot et al.
F. Couvidat et al.: Modeling SOA formation over the Paris areaFig. 2. Concentrations of SOA from primary SVOC oxidation computed with the two mechanisms for10 µg m−3(left) and 1 µg m−3(right) of POA. 989
EC (µg m−3) OM (µg m−3)
Fig. 3. Simulated concentrations in µg m−3of EC (left) and OM (right) for July 2009. The red and black crosses correspond to the LHVP and SIRTA sites, respectively.
28
Fig. 3. Simulated concentrations in µg m−3of EC (left) and OM (right) for July 2009. The red and black crosses correspond to the LHVP and SIRTA sites, respectively.
SIRTA (correlation = 0.62, RMSE = 0.33 µg m−3) LHVP (correlation = 0.39, RMSE = 0.88 µg m−3)
Fig. 4. 12 h averaged concentrations of EC modeled with “H2O-Ref” and measured with filters at the SIRTA site (left) and with both filters and Sunset filed instrument at the LHVP (right) site (correlations and RMSE are between the model and the filter measurements).
29
Fig. 4. 12 h averaged concentrations of EC modeled with “H2O-Ref” and measured with filters at the SIRTA site (left) and with both filters and Sunset filed instrument at the LHVP (right) site (correlations and RMSE are between the model and the filter measurements).
(2011) to be one of the main sources of organic aerosols in the Paris city center.
The modeled OC concentrations generally fall between the Sunset instrument measurements with and without offset, but are much lower than the filter measurements (on average, 2.87 µg m−3 of modeled OC, 3.15 µg m−3of measured OC with the Sunset instrument with the offset and 3.73 µg m−3of measured OC with filter measurements). The modeled con-centration peaks of OC are generally observed by the filter measurements but are not observed by the Sunset field instru-ment (for example, the peaks of 20, 28 and 29 July). Thus, the correlation coefficient (r) between the model and the fil-ter measurements (r = 0.75) is much higher than the cor-relation coefficient between the model and the Sunset field instrument measurements (r = 0.49). Due to the differences between measurements performed with filters and the Sunset instrument, it is difficult to conclude if the model underesti-mates or overestiunderesti-mates OC concentrations.
Since the Sunset instrument measurements are hourly, they provide insight into the temporal profiles of EC and OC at the LHVP station. Figure 6 shows the measured and modeled
daily temporal profiles for EC and OC at the LHVP station from 5 to 25 July (i.e., the period during which the Sunset in-strument, the filters and the model give similar EC concentra-tions). As shown in this figure, “H2O-Ref” shows two peaks corresponding to high EC emissions from traffic during rush hours. The first peak reproduces well the Sunset instrument measurements. However, the model also shows high EC con-centrations between 10:00 a.m. and 08:00 p.m. with a peak at 04:00–05:00 p.m. and low concentrations after 08:00 p.m. whereas the measurements show low concentrations between 08:00 a.m. and 08:00 p.m. and an increase in concentrations after 08:00 p.m.. This could be due to an incorrect temporal profile for traffic emissions in the Airparif inventory. Menut et al. (2012) studied the impact of hourly emission profiles and provided more realistic temporal profiles of traffic emis-sions for some cities (including Paris). Figure 7 shows the temporal profiles of traffic emissions of the Airparif inven-tory and Menut et al. (2012). The emission profile of the Airparif inventory gives very high emissions at the end of the afternoon whereas emissions from the temporal profile of Menut et al. (2012) (noted TPM hereafter) are much lower
SIRTA (correlation = 0.68, RMSE = 0.99 µg m−3) LHVP (correlation = 0.74, RMSE = 1.91 µg m−3)
Fig. 5. 12 h averaged concentrations of OC modeled with “H2O-Ref” and measured with filters at the SIRTA (left) and with both filters and Sunset field instrument at the LHVP (right) site (correlations and RMSE are between the model and the filter measurements).
Fig. 6. Measured and modeled daily temporal profiles for EC (left) and OC (right) at the LHVP site from July 5thto July 25th, 2009. H2O-TPM stands for the results of “H2O-Ref” with the temporal profile of Menut et al. (2012) for traffic emissions; H2O-Estimated corresponds to the use of an estimated emission temporal profile that matches the observed temporal profile of EC.
30
Fig. 5. 12 h averaged concentrations of OC modeled with “H2O-Ref” and measured with filters at the SIRTA (left) and with both filters and Sunset field instrument at the LHVP (right) site (correlations and RMSE are between the model and the filter measurements).
SIRTA (correlation = 0.68, RMSE = 0.99 µg m−3) LHVP (correlation = 0.74, RMSE = 1.91 µg m−3)
Fig. 5. 12 h averaged concentrations of OC modeled with “H2O-Ref” and measured with filters at the
SIRTA (left) and with both filters and Sunset field instrument at the LHVP (right) site (correlations and RMSE are between the model and the filter measurements).
Fig. 6. Measured and modeled daily temporal profiles for EC (left) and OC (right) at the LHVP site from July 5thto July 25th, 2009. H2O-TPM stands for the results of “H2O-Ref” with the temporal profile of
Menut et al. (2012) for traffic emissions; H2O-Estimated corresponds to the use of an estimated emission
temporal profile that matches the observed temporal profile of EC.
30
Fig. 6. Measured and modeled daily temporal profiles for EC (left) and OC (right) at the LHVP site from 5 to 25 July 2009. H2O-TPM stands for the results of “H2O-Ref” with the temporal profile of Menut et al. (2012) for traffic emissions; H2O-Estimated corresponds to the use of an estimated emission temporal profile that matches the observed temporal profile of EC.
Fig. 7. Temporal profiles of traffic emissions from the Airparif inventory, from Menut et al. (2012) (TPM) and from matching EC observations at the LHVP station (Estimated profile).
31
Fig. 7. Temporal profiles of traffic emissions from the Airparif
in-ventory, from Menut et al. (2012) (TPM) and from matching EC observations at the LHVP station (Estimated profile).
in the afternoon and higher at the end and beginning of the day. Using TPM gives better results with lower EC concen-trations during the afternoon and higher EC concenconcen-trations at night, but the second peak of concentrations given by the model still occurs too early and night concentrations are still too low (see Fig. 6). Underestimation of EC concentrations at night could be due to the overestimation of the nighttime PBL height by WRF using the YSU parameterization. It is also possible that TPM does not reproduce exactly the tem-poral profile of summer traffic emissions, because TPM is estimated by averaging “near traffic” concentrations values measured on Mondays during a whole year. This temporal profile is, therefore, an average temporal profile and is not specific to July, when holidays may strongly affect the emis-sion profile. To address this potential source of uncertainty, a temporal profile of traffic emissions was estimated by match-ing the temporal profile of EC concentrations. This estimated temporal profile of traffic emissions is shown in Fig. 7 and the corresponding modeled EC concentration profile is shown in Fig. 6.
F. Couvidat et al.: Modeling SOA formation over the Paris area 991
Fig. 8. Simulation of the daily temporal profiles of secondary OC compared with the daily temporal profile of measured OC (See Figure 7 for simulation descriptions).
32
Fig. 8. Simulation of the daily temporal profiles of secondary OC
compared with the daily temporal profile of measured OC (see Fig. 7 for simulation descriptions).
For OC concentrations, except for a peak at 10 pm, the measured temporal profile (shown Fig. 6) is almost con-stant with concentrations around 2.0 µg m−3without the off-set. Allan et al. (2010) found high concentrations of organic aerosols due to cooking between 08:00 p.m. and 10:00 p.m. in London and Manchester. The 10:00 p.m. peak observed in Paris could then be due to cooking activities. In that case, since cooking emissions are missing from the inventory, the model should not be able to reproduce this peak. The peaks of EC corresponding to rush-hour high emissions do not appear in the observed temporal profile of OC. “H2O-Ref” gives two peaks corresponding to high emissions from traffic given by the Airparif inventory, which do not appear in the measure-ments. However, the second OC peak disappears when TPM (which gives lower emissions in the afternoon and higher emissions at night) is used but the first peak is unchanged. Using the estimated temporal profile of traffic emissions con-firms the disappearance of the second peak but could not ex-plain the absence of the first peak which clearly appears in the temporal profile of EC.
One possible explanation is that evaporation of POA is un-derestimated by the model. This is possible since evaporation of POA is based on results of Robinson et al. (2007), which are based on measurements for organic loading higher than 20 µg m−3. Partitioning of primary SVOC is then highly un-certain at the conditions of the simulation with OC concen-trations around 2 µg m−3. Primary SVOC may not condense
and organic aerosols could then be secondary. It is also pos-sible that the gas-particle partitioning of primary SVOC is affected by temperature and that an underestimation of tem-perature during the morning rush hours could lead to a slight overestimation of POA. However, no measurements of tem-perature are available during the campaign at the LHVP site and therefore comparisons can not be made to verify if the temperature at this site is underestimated. Figure 8 shows the secondary OC (SOC) concentrations. This profile is
rel-Fig. 9. Comparison of modeled temporal profiles of OC (in red), SOC (in blue) and POC (in green) between “H2O-Ref” (solid lines) and of “H2O-Mech” (dashed lines)
33
Fig. 9. Comparison of modeled temporal profiles of OC (in red),
SOC (in blue) and POC (in green) between “H2O-Ref” (solid lines) and of “H2O-Mech” (dashed lines).
atively constant around 1.7 µg m−3with a small increase to 2.1 µg m−3 and, except for the evening peak, this profile is very similar to the profile of OC measured by the Sunset in-strument. It may indicate that primary SVOC from traffic did not condense in Paris in July 2009 or that POA from traf-fic were not captured by the Sunset field instrument, which could then explain the differences between the Sunset field instruments and the filter measurements.
5 Comparison of two mechanisms for primary SVOC aging
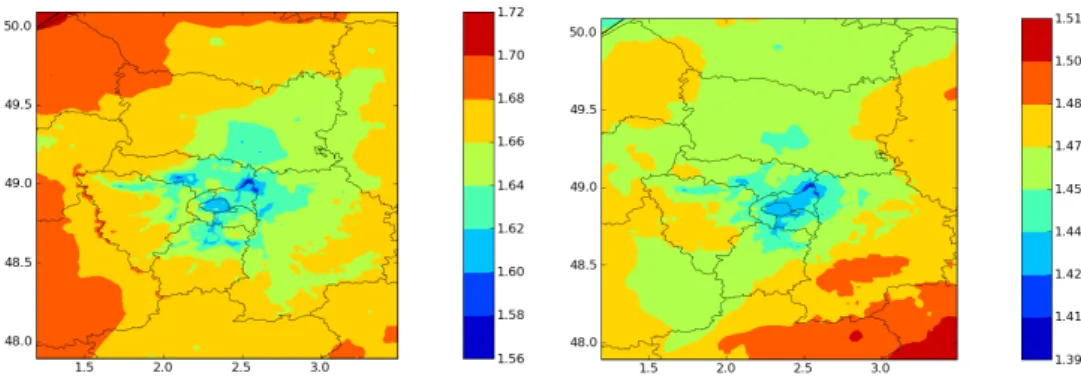
A comparison of OC, SOC and primary organic carbon (POC) concentrations between “H2O-Ref” and “H2O-Mech” is shown in Fig. 9 and the OM/OC ratios for July 2009 com-puted with the two mechanisms are shown in Fig. 10. The OM/OC ratios computed with “H2O-Ref” are higher than the OM/OC ratios computed with “H2O-Mech”. This difference is due to the lower OM/OC ratios of oxidized SVOC formed from the oxidation of primary SVOC in “H2O-Mech” (be-tween 1.27 and 1.85) than in “H2O-Ref” (equal to 1.82). However, only one oxidation step is taken into account in “H2O-Mech” and, in reality, oxidized SVOC should be more oxidized as numerous oxidation steps could occur. “H2 O-Ref” gives an OM/OC ratio around 1.6 in Paris area; these results are consistent with the results of Turpin and Lim (2001) for urban areas. Concentrations of POC are lower with “H2O-Mech” than with “H2O-Ref”. As the organic aerosol loading into which SVOC can be absorbed is the same in the two mechanisms, the lower concentrations of POC with “H2O-Mech” is due to the impact of activity co-efficients on the partitioning of primary SVOC (which is not taken into account in “H2O-Ref”). It indicates that pri-mary SVOC condense less readily on an oxidized aerosol. This point could be very important for SVOC partitioning in
Fig. 10. Modeled OM/OC ratios with “H2O-Ref” (left) and “H2O-Mech” (right).
34
Fig. 10. Modeled OM/OC ratios with “H2O-Ref” (left) and “H2O-Mech” (right).
the atmosphere and, since “H2O-Mech” only takes into ac-count one oxidation step whereas numerous oxidation steps are likely to occur in the atmosphere, this effect could be even greater than simulated here. The secondary aerosol should be more oxidized in reality than in the model and pri-mary SVOC are possibly unable to condense on an oxidized aerosol. Those results are confirmed by experimental stud-ies: POA and SOA were shown to possibly not mix (Song et al., 2007) or to mix but with interactions between com-pounds influencing the partitioning of SVOC (Asa-Awuku et al., 2009).
In contrast, SOC formation is higher in “H2O-Mech” than in “H2O-Ref” but SOA concentrations are similar (as shown in Fig. 11). Figure 11 shows that biogenic SOA are simi-lar with the two mechanisms. However, the concentrations of biogenic hydrophobic compounds (BiNIT, BiNIT3, BiNGA, BiBlP, BiBmP, AnBlP, AnBmP which are described in Cou-vidat et al., 2012), which are absorbed into the organic phase, concentrations are increased by 10 %. The higher concentra-tion of biogenic hydrophobic SOA compounds with “H2 O-Mech” is due to lower activity coefficients. “H2O-Ref” uses for the computation of activity coefficients the same molecu-lar structure as primary SVOC (POAlP, POAmP, POAhP) for SOA formed from the oxidation of primary SVOC (SOAlP, SOAmP, SOAhP) and, therefore, it does not take into ac-count the fact that these SOA compounds are more oxidized than the primary compounds; this phenomenon is taken into account in “H2O-Mech”. As the organic aerosol should be more oxidized in reality than they are in “H2O-Mech” (be-cause the model takes into account only one oxidation step), the condensation of some hydrophobic compounds leading to more SOA formation may be underestimated. Concentra-tions of SOA formed from IVOC oxidation are not insignif-icant (the average concentration at noon is 0.4 µg m−3) but
are low compared to SOA formation from SVOC oxidation.
Fig. 11. Modeled temporal profiles of total SOA (in red), of SOA from primary SVOC oxidation (in blue), of biogenic SOA (in green), and of SOA from IVOC oxidation -in black) for “H2O-Ref” (solid
lines) and for “H2O-Mech” (dashed lines)
35
Fig. 11. Modeled temporal profiles of total SOA (in red), of SOA
from primary SVOC oxidation (in blue), of biogenic SOA (in green), and of SOA from IVOC oxidation – in black) for “H2 O-Ref” (solid lines) and for “H2O-Mech” (dashed lines).
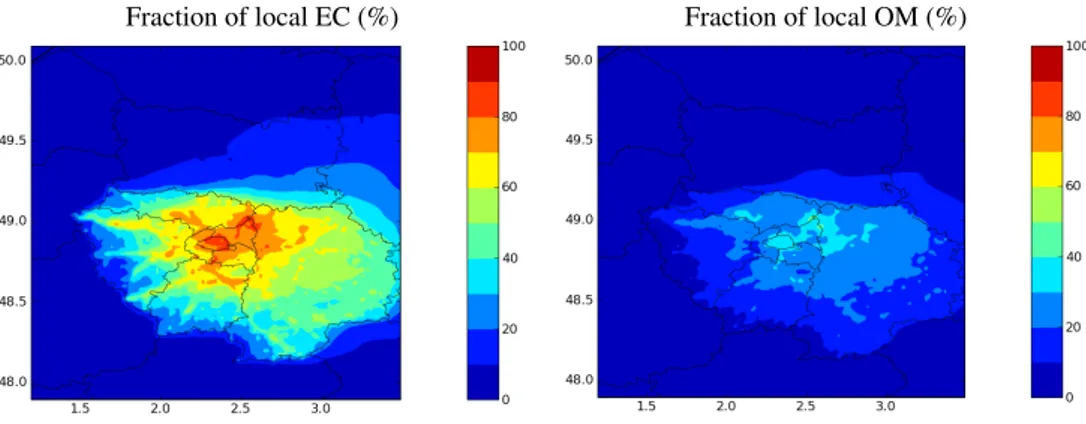
6 Origins of particulate organic matter in the Paris area The fraction of carbonaceous aerosol originating from the Paris area (i.e., from local sources) is estimated with “H2 O-Ref” by subtracting the results of a simulation without the anthropogenic emissions in the Paris area from the results of the base simulation, i.e., with those anthropogenic emis-sions. Figure 12 shows concentrations of EC and OM and the local contribution of anthropogenic sources for July 2009. Whereas EC is found to be almost entirely of local origin, OM inside Paris is found to have both local and regional contributions. About 30 to 38 % of OM in the city center of Paris (30 % at the LVHP site) can be attributed to local sources during July 2009. This result is commensurate with those obtained by Airparif (2011) using a receptor-based ap-proach: they estimated that at a background urban site, 27 % of OM was of local origin. Figure 13 shows the composi-tion of OM given by “H2O-Ref” at the LHVP and SIRTA sites. OM has a similar composition at the two sites, but there are more primary SVOC that have been oxidized at
F. Couvidat et al.: Modeling SOA formation over the Paris area 993
Fraction of local EC (%) Fraction of local OM (%)
Fig. 12. Fraction of local aerosol in % (bottom) for EC (left) and OM (right) for July 2009.
36
Fig. 12. Fraction of local aerosol in % (bottom) for EC (left) and OM (right) for July 2009.
SIRTA LHVP
Fig. 13. Averaged composition of OM at the SIRTA (left) and LHVP (right) sites modeled with “H2
O-Ref”. Red: POA, purple: SOA formed form oxidation of primary SVOC, orange: OM from bound-ary conditions used for the European simulation (long-range transport of OM), yellow: SOA formed from aromatics oxidation, blue: SOA formed from monoterpenes oxidation, green: SOA formed from sesquiterpenes oxidation, aqua: SOA formed from isoprene oxidation
37
Fig. 13. Averaged composition of OM at the SIRTA (left) and
LHVP (right) sites modeled with “H2O-Ref”. Red: POA, pur-ple: SOA formed form oxidation of primary SVOC, orange: OM from boundary conditions used for the European simulation (long-range transport of OM), yellow: SOA formed from aromatics oxida-tion, blue: SOA formed from monoterpenes oxidaoxida-tion, green: SOA formed from sesquiterpenes oxidation, aqua: SOA formed from iso-prene oxidation.
the suburban SIRTA site. At the LHVP site, OM consists of aerosols from the boundary conditions of the European simulation (28 %), POA (23 %), SOA formed from primary SVOC oxidation (19 %), SOA formed by oxidation of bio-genic precursors (29 %), and SOA formed by oxidation of aromatic precursors (1 %).
We defined the amount of local aerosol by the differ-ence between two simulations with or without anthropogenic emissions. However, the system is not linear. For example, the concentrations of some surrogates are higher over Paris with anthropogenic emissions due to the increase of the ab-sorbing media even they come from distant sources. 16 % of SOA formed from sesquiterpene oxidation is then found to be local. On the contrary, SOA concentrations from isoprene ox-idation increase by 28 % when anthropogenic emissions over Paris are removed. This is due to lower NOxconcentrations:
instead of being oxidized under high-NOx conditions,
iso-prene is oxidized under low-NOxconditions and forms SOA
with higher yields. As the effect of NOxconcentrations is not
taken into account for monoterpenes and sesquiterpenes, it is possible that more SOA could be formed from these precur-sors without anthropogenic emissions over the Paris area.
7 Conclusions
Organic aerosol formation was simulated over the Paris area during July 2009. Results of the model simulations were compared to measurements conducted during the Megapoli campaign. The model simulated a morning peak of concen-trations due to rush-hour traffic for both EC and OC; how-ever, this peak appears in the EC measurements, but does not appear in the OC measurements. This discrepancy be-tween the model and the measurements could be due to the underestimation of POA evaporation at low organic load-ing by the model, to uncertainties in the modeled tempera-ture, which can affect the gas-particle partitioning or to POA from traffic, which would not be captured by the Sunset field instrument. Using a mechanism for oxidation of primary SVOC that takes into account the molecular structure of pri-mary and secondary surrogate molecules and, therefore, in-cludes explicitly the effect of activity coefficients on SVOC gas/particle partitioning, it was found that oxidized organic aerosols have low affinity with POA and that POA and SOA do not mix well together. Condensation of primary SVOC is likely to be overestimated by a model that does not fully account for the non-ideality of the organic condensed phase, whereas SOA is likely to be underestimated. Moreover, treat-ing the organic aerosol solution as a one-phase ideal solution or using simple partitioning constants (which do not take into account the affinity of a compound with the liquid aerosol so-lutions) probably overestimates the condensation of primary SVOC.
Organic aerosols in Paris were found to be mainly anthro-pogenic with 30 to 40 % of OM due to local sources. Accord-ing to the model, most of the OM results from the conden-sation of primary SVOC and their oxidation products. Bio-genic VOC form only a small quantity of SOA (29 % of OM) and are minor precursors in this simulation. Comparisons of
modeled biogenic SOA concentrations with molecular SOA tracer measurements are needed to confirm this result and evaluate the biogenic emission inventory for Europe.
Acknowledgements. This work was funded in part by ADEME, the
French Agency for the Environment and Energy Management and by European Union’s Seventh Framework Programme FP/2007-2011 with the project Megapoli, grant agreement no. 212520, and from the French ANR Megapoli-Paris project. Thanks are due to Airparif, the Paris region air quality agency, for providing us with their air pollutant emission inventory. We also thank the staff of LHVP and SIRTA for hosting measurements and for technical and logical support and J. B. Nicolas and R. Sarda-Est`eve for their help in the field.
Edited by: J.-L. Jimene
References
Airparif: Source apportionment of airborne particles in Ile-de-France - Final Report, Tech. rep., Airparif, Paris, Ile-de-France, 2011. Allan, J. D., Williams, P. I., Morgan, W. T., Martin, C. L., Flynn, M.
J., Lee, J., Nemitz, E., Phillips, G. J., Gallagher, M. W., and Coe, H.: Contributions from transport, solid fuel burning and cook-ing to primary organic aerosols in two UK cities, Atmos. Chem. Phys., 10, 647–668, doi:10.5194/acp-10-647-2010, 2010. Arhami, M., Kuhn, T., Fine, P. M., Delfino, R. J., and Sioutas,
C.: Effects of sampling artifacts and operating parameters on the performance of a semicontinuous particulate elemental car-bon/organic carbon monitor, Environ. Sci. Tech., 40, 945–954, doi:10.1021/es0510313, 2006.
Asa-Awuku, A., Miracolo, M. A., Kroll, J. H., Robinson, A. L., and Donahue, N. M.: Mixing and phase partitioning of primary and secondary organic aerosols, Geophys. Res. Lett., 36, L15827, doi:10.1029/2009GL039301, 2009.
Bae, M.-S., Schauer, J. J., DeMinter, J. T., Tuner, J. R., Smith, D., and Cary, R. A.: Validation of a semi-continuous in-strument for elemental carbon and organic carbon using a thermal-optical method, Atmos. Environ., 38, 2885–2893, doi:10.1016/j.atmosenv.2004.02.027, 2004.
Boylan, J. W. and Russell, A. G.: PM and light extinction model performance metrics, goals, and criteria for three-dimensional air quality models, Atmos. Environ., 40, 4946– 4959, doi:10.1016/j.atmosenv.2005.09.087, 2006.
Calvert, J. G., Atkinson, R., Becker, K. H., Kamens, R. M., Sein-feld, J. H., Wallington, T. J., and Yarwood, G.: The mechanisms of atmospheric oxidation of the aromatic hydrocarbons, Oxford University Press, 2002.
Calvert, J. G., Derwent, R. G., Orlando, J. J., Tyndall, G. S., and Wallington, T. J.: Mechanisms of atmospheric oxidation of the alkanes, Oxford University Press, 2008.
Carlton, A. G., Wiedinmyer, C., and Kroll, J. H.: A review of Sec-ondary Organic Aerosol (SOA) formation from isoprene, At-mos. Chem. Phys., 9, 4987–5005, doi:10.5194/acp-9-4987-2009, 2009.
Cavalli, F., Viana, M., Yttri, K. E., Genberg, J., and Putaud, J.-P.: Toward a standardised thermal-optical protocol for measuring
atmospheric organic and elemental carbon: the EUSAAR proto-col, Atmos. Meas. Tech., 3, 79–89, doi:10.5194/amt-3-79-2010, 2010.
Chan, A. W. H., Kautzman, K. E., Chhabra, P. S., Surratt, J. D., Chan, M. N., Crounse, J. D., K¨urten, A., Wennberg, P. O., Flagan, R. C., and Seinfeld, J. H.: Secondary organic aerosol formation from photooxidation of naphthalene and alkylnaph-thalenes: implications for oxidation of intermediate volatility or-ganic compounds (IVOCs), Atmos. Chem. Phys., 9, 3049–3060, doi:10.5194/acp-9-3049-2009, 2009.
Chhabra, P. S., Flagan, R. C., and Seinfeld, J. H.: Elemental analysis of chamber organic aerosol using an aerodyne high-resolution aerosol mass spectrometer, Atmos. Chem. Phys., 10, 4111–4131, doi:10.5194/acp-10-4111-2010, 2010.
Couvidat, F. and Seigneur, C.: Modeling secondary organic aerosol formation from isoprene oxidation under dry and humid condi-tions, Atmos. Chem. Phys., 11, 893–909, doi:10.5194/acp-11-893-2011, 2011.
Couvidat, F., Debry, ´E., Sartelet, K., and Seigneur, C.: A hy-drophilic/hydrophobic organic (H2O) model: Model develop-ment, evaluation and sensitivity analysis, J. Geophys. Res., 117, D10304, doi:10.1029/2011JD017214, 2012.
Debry, E., Fahey, K., Sartelet, K., Sportisse, B., and Tombette, M.: Technical Note: A new SIze REsolved Aerosol Model (SIREAM), Atmos. Chem. Phys., 7, 1537–1547, doi:10.5194/acp-7-1537-2007, 2007.
Donahue, N. M., Robinson, A. L., Stanier, C. O., and N., P. S.: Coupled Partitioning, Dilution, and Chemical Aging of Semivolatile Organics, Environ. Sci. Technol., 40, 2635–2643, doi:10.1021/es052297c, 2006.
Dzepina, K., Cappa, C. D., Volkamer, R. M., Madronich, S., De-Carlo, P. F., Zaveri, R. A., and Jimenez, J. L.: Modeling the multiday evolution and aging of secondary organic aerosol dur-ing MILAGRO 2006, Environ. Sci. Technol., 45, 3496–3503, doi:10.1021/es103186f, 2011.
Ervens, B., Turpin, B. J., and Weber, R. J.: Secondary or-ganic aerosol formation in cloud droplets and aqueous parti-cles (aqSOA): a review of laboratory, field and model stud-ies, Atmos. Chem. Phys., 11, 11069–11102, doi:10.5194/acp-11-11069-2011, 2011.
Fredenslund, A., Jones, R., and Prausnitz, J.: Group-contribution estimation of activity-coefficients in nonideal liquid-mixtures, AIChE J., 21, 1086–1099, 1975.
Grieshop, A. P., Logue, J. M., Donahue, N. M., and Robinson, A. L.: Laboratory investigation of photochemical oxidation of or-ganic aerosol from wood fires 1: measurement and simulation of organic aerosol evolution, Atmos. Chem. Phys., 9, 1263–1277, doi:10.5194/acp-9-1263-2009, 2009.
Griffin, R. J., Dabdub, D., Kleeman, M. J., Fraser, M., P., Cass, G. R., and Seinfeld, J. H.: Secondary or-ganic aerosol, 3, Urban/regional scale model of size- and composition-resolved aerosols, J. Geophys. Res., 107, 4334, doi:10.1029/2001JD000544, 2002.
Guenther, A., Karl, T., Harley, P., Wiedinmyer, C., Palmer, P. I., and Geron, C.: Estimates of global terrestrial isoprene emissions using MEGAN (Model of Emissions of Gases and Aerosols from Nature), Atmos. Chem. Phys., 6, 3181–3210, doi:10.5194/acp-6-3181-2006, 2006.
F. Couvidat et al.: Modeling SOA formation over the Paris area 995
Haeffelin, M., Barth`es, L., Bock, O., Boitel, C., Bony, S., Bouniol, D., Chepfer, H., Chiriaco, M., Cuesta, J., Delano¨e, J., Drobinski, P., Dufresne, J.-L., Flamant, C., Grall, M., Hodzic, A., Hourdin, F., Lapouge, F., Lemaˆıtre, Y., Mathieu, A., Morille, Y., Naud, C., No¨el, V., O’Hirok, W., Pelon, J., Pietras, C., Protat, A., Romand, B., Scialom, G., and Vautard, R.: SIRTA, a ground-based atmo-spheric observatory for cloud and aerosol research, Ann. Geo-phys., 23, 253–275, doi:10.5194/angeo-23-253-2005, 2005. Hodzic, A., Jimenez, J. L., Madronich, S., Canagaratna, M. R.,
De-Carlo, P. F., Kleinman, L., and Fast, J.: Modeling organic aerosols in a megacity: potential contribution of semi-volatile and inter-mediate volatility primary organic compounds to secondary or-ganic aerosol formation, Atmos. Chem. Phys., 10, 5491–5514, doi:10.5194/acp-10-5491-2010, 2010.
Hong, S.-Y., Noh, Y., and Dudhia, J.: A new vertical diffusion pack-age with an explicit treatment of entrainment processes, Mon. Weather Rev., 134, 2318–2341, doi:10.1175/MWR3199.1, 2006. Isaacman, G., Wilson, K. R., Chan, W. H., Worton, D. R., Kim-mel, J. R., Nah, T., Hohaus, T., Gonin, M., Kroll, J. H., Worsnop, D. R., and Goldstein, A. H.: Improved resolution of hydrocar-bon structures and constitutional isomers in complex mixtures using gas chromatography-vacuum ultraviolet-mass spectrome-try, Anal. Chem., 84, 2335–2342, doi:10.1021/ac2030464, 2012. Jimenez, J. L., Canagaratna, M. R., Donahue, N. M., Prevot, A. S. H., Zhang, Q., Kroll, J. H., DeCarlo, P. F., Allan, J. D., Coe, H., Ng, N. L., Aiken, A. C., Docherty, K. S., Ulbrich, I. M., Grieshop, A. P., Robinson, A. L., Duplossy, J., Smith, J. D., Wilson, K. R., Lanz, V. A., Hueglin, C., Sun, Y. L., Tian, J., Laaksonen, A., Raatikainen, T., Rautiainen13, J., Vaattovaara, P., Ehn, M., Kulmala, M., Tomlinson, J. M., Collins, D. R., Cubison, M. J., Dunlea, E. J., Huffman, J. A., Onash, T. B., Alfarra, M. R., Williams, P. I., Bower, K., Kondo, Y., Schnei-der, J., Drewnick, F., Borrmann, S., Weimer, S., Demerjian, K., Salcedo, D., Cottrell, L., Griffin, R., Takami, A., Miyoshi, T., Hatakeyama, S., Shimono, A., Sun, J. Y., Zhang, Y. M., Dzepina, K., Kimmel, J. R., Sueper, D., Jayne, J. T., Herndon, S. C., Trim-born, A. M., Williams, L. R., Wood, E. C., Middlebrook, A. M., Kolb, C. E., Baltensperger, U., and Worsnop, D. R.: Evolution of organic aerosols in the atmosphere, Science, 326, 1525–1529, doi:10.1126/science.1180353, 2009.
Kanakidou, M., Seinfeld, J. H., Pandis, S. N., Barnes, I., Dentener, F. J., Facchini, M. C., Van Dingenen, R., Ervens, B., Nenes, A., Nielsen, C. J., Swietlicki, E., Putaud, J. P., Balkanski, Y., Fuzzi, S., Horth, J., Moortgat, G. K., Winterhalter, R., Myhre, C. E. L., Tsigaridis, K., Vignati, E., Stephanou, E. G., and Wilson, J.: Organic aerosol and global climate modelling: a review, At-mos. Chem. Phys., 5, 1053–1123, doi:10.5194/acp-5-1053-2005, 2005.
Kautzman, K. E., Surratt, J. D., Chan, M. N., Chan, A. W. H., Hersey, S. P., Chhabra, P. S., Dalleska, N. F., Wennberg, P. O., Flagan, R. C., and Seinfeld, J. H.: Chemical composition of gas-and aerosol-phase products from the photooxidation of naphtha-lene, J. Phys. Chem. A, 114, 913–934, doi:10.1021/jp908530s, 2010.
Kim, Y.: Mod´elisation de la qualit´e de l’air: ´Evaluation des param´etrisations chimiques et m´et´eorologiques, Ph.D. thesis, Universit´e Paris-Est, 2011.
Kim, Y., Couvidat, F., Sartelet, K., and Seigneur, C.: Comparison of different gas-phase mechanisms and aerosol modules for
simu-lating particulate matter formation, J. Air Waste Manage. Assoc, 61, 1218–1226, 2011.
Lee, J. Y. and Lane, D. A.: Unique products from the reaction of naphthalene with the hydroxyl radical, Atmos. Environ., 43, 4886–4893, doi:10.1016/j.atmosenv.2009.07.018, 2009. Lee, J. Y. and Lane, D. A.: Formation of oxidized products
from the reaction of gaseous phenanthrene with the OH rad-ical in a reaction chamber, Atmos. Environ., 44, 2469–2477, doi:10.1016/j.atmosenv.2010.03.008, 2010.
Lim, B. Y. and Ziemann, P. J.: Chemistry of secondary organic aerosol formation from OH radical-initiated reactions of linear, branched and cyclic alkanes in the presence of NOx, Aerosol.
Sci. Technol., 43, 604–619, doi:10.1080/02786820902802567, 2009a.
Lim, B. Y. and Ziemann, P. J.: Effects of molecular structure on aerosol yields from OH radical-initiated reactions of linear, branched, and cyclic alkanes in the Presence of NOx, Environ.
Sci. Technol., 43, 2328–2334, doi:10.1021/es803389s, 2009b. Mallet, V., Qu´elo, D., Sportisse, B., Ahmed de Biasi, M., Debry,
´
E., Korsakissok, I., Wu, L., Roustan, Y., Sartelet, K., Tombette, M., and Foudhil, H.: Technical Note: The air quality model-ing system Polyphemus, Atmos. Chem. Phys., 7, 5479–5487, doi:10.5194/acp-7-5479-2007, 2007.
Menut, L., Goussebaile, A., Bessagnet, B., Khvorostiyanov, D., and Ung, A.: Impact of realistic hourly emissions profiles on air pol-lutants concentrations modelled with CHIMERE, Atmos. Envi-ron., 49, 233–244, doi:10.1016/j.atmosenv.2011.11.057, 2012. Murphy, B. N. and Pandis, S. N.: Simulating the formation of
semivolatile primary and secondary organic aerosol in a regional chemical transport model, Environ. Sci. Technol., 43, 4722– 4728, doi:10.1021/es803168a, 2009.
Nenes, A., Pandis, S., and Pilinis, C.: ISORROPIA: A new ther-modynamic equilibrium model for multiphase multicomponent inorganic aerosols, Aquat. Geoch., 4, 123–152, 1998.
Offenberg, J. H., Lewandowski, M., Edney, E. O., Kleindienst, T. E., and Jaoui, M.: Investigation of a systematic offset in the mea-surement of organic carbon with a semicontinuous analyzer, J. Air Waste Manage. Assoc., 57, 596–599, 2007.
Pankow, J. F. and Asher, W. E.: SIMPOL.1: a simple group contribution method for predicting vapor pressures and en-thalpies of vaporization of multifunctional organic compounds, Atmos. Chem. Phys., 8, 2773–2796, doi:10.5194/acp-8-2773-2008, 2008.
Peltier, R. E., Weber, R. J., and Sullivan, A. P.: Investigating a liquid-based method for online organic carbon detection in atmospheric particles, Aerosol. Sci. Technol., 41, 1117–1127, doi:10.1080/02786820701777465, 2007.
Polidori, A., Turpin, B., Lim, H.-J., Cabada, J. C., Subramanian, R., Pandis, S. N., and Robinson, A. L.: Local and regional secondary organic aerosol : Insights from a year of semi-continuous carbon measurements at Pittsburgh, Aerosol. Sci. Tech., 40, 861–872, doi:10.1080/02786820600754649, 2006.
Presto, A. A., Miracolo, M. A., Donahue, N. M., and Robinson, A. L.: Secondary organic aerosol formation from high-NOx
photo-oxidation of low volatility precursors: n-Alkanes, Environ. Sci. Technol., 44, 2029–2034, doi:10.1021/es903712r, 2010. Prevot, A. S. H., Crippa, M. Pandis, S., Beekmann, M., and
Bal-tensperger, U.: Organic aerosols and their sources in Paris during the MEGAPOLI campaigns, Geophysical Research Abstracts,
13, EGU2011–4631–2, 2011.
Pun, B.: Development and initial application of the sesquiv-ersion of MADRID, J. Geophys. Res., 113, D12212, doi:10.1029/2008JD009888, 2008.
Pun, B., Griffin, R., Seigneur, C., and Seinfeld, J.: Secondary or-ganic aerosol 2. Thermodynamic model for gas/particle parti-tioning of molecular constituents, J. Geophys. Res., 107, 433, doi:10.1029/2001JD000542, 2002.
Pun, B., Wu, S.-Y., Seigneur, C., Seinfeld, J., Griffin, R., and Pandis, S.: Uncertainties in modeling secondary organic aerosols: three-dimensional modeling studies in Nashville/Western Tennessee, Environ. Sci. Technol., 37, 3647–3661, doi:10.1021/es0341541, 2003.
Pun, B., Seigneur, C., and Lohman, K.: Modeling secondary organic aerosol formation via multiphase partitioning with molecular data, Environ. Sci. Technol., 40, 4722–4731, doi:10.1021/es0522736, 2006.
Pye, H. O. T. and Seinfeld, J. H.: A global perspective on aerosol from low-volatility organic compounds, Atmos. Chem. Phys., 10, 4377–4401, doi:10.5194/acp-10-4377-2010, 2010.
Robinson, A. L., Donahue, N. M., Shrivastava, M. K., Weitkamp, E. A., Sage, A. M., Grieshop, A. P., Lane, T. E., Pierce, J. R., and Pandis, S. N.: Rethinking organic aerosols: semivolatile emissions and photochemical aging, Science, 315, 1259–1262, doi:10.1126/science.1133061, 2007.
Royer, P., Chazette, P., Sartelet, K., Zhang, Q. J., Beekmann, M., and Raut, J.-C.: Comparison of lidar-derived PM10 with
re-gional modeling and ground-based observations in the frame of MEGAPOLI experiment, Atmos. Chem. Phys., 11, 10705– 10726, doi:10.5194/acp-11-10705-2011, 2011.
Russel, A. and Dennis, R.: NARSTO critical review of photo-chemical models and modeling, Atmo. Environ., 34, 2283–2324, doi:10.1016/S1352-2310(99)00468-9, 2000.
Russell, M. and Allen, D. T.: Predicting secondary organic aerosol formation rates in southeast Texas, J. Geophys. Res., 110, D07S17, doi:10.1029/2004JD004722, 2005.
Sartelet, K., Debry, E., Fahey, K., Roustan, Y., Tombette, M., and Sportisse, B.: Simulation of aerosols and gas-phase species over Europe with the Polyphemus system. Part I: model-to-data comparison for 2001, Atmos. Environ., 41, 6116–6131, doi:10.1016/j.atmosenv.2007.04.024, 2007.
Sarwar, G., Luecken, D., Yarwood, G., Whitten, G. Z., and Carter, W. P. L.: Impact of an Updated Carbon Bond Mecha-nism on Predictions from the CMAQ Modeling System: Pre-liminary Assessment, J. Appl. Meteor. Climatol., 47, 3–14, doi:10.1175/2007JAMC1393.1, 2008.
Schauer, J. J., Kleeman, M. J., Cass, G. R., and Simoneit, B. R. T.: Measurement of emissions from air pollution sources. 2. C1 through C30 organic compounds from medium duty diesel trucks, Environ. Sci. Technol., 33, 1578–1587, doi:10.1021/es980081n, 1999.
Sciare, J., d’Argouges, O., Zhang, Q. J., Sarda-Est`eve, R., Gaimoz, C., Gros, V., Beekmann, M., and Sanchez, O.: Comparison be-tween simulated and observed chemical composition of fine aerosols in Paris (France) during springtime: contribution of re-gional versus continental emissions, Atmos. Chem. Phys., 10, 11987–12004, doi:10.5194/acp-10-11987-2010, 2010.
Sciare, J., D’Argouges, O., Sarda-Est`eve, R., Gaimoz, C., Dolgo-rouky, C., Bonnaire, N., Favez, O., Bonsang, B., and Gros, V.: Large contribution of water-insoluble secondary organic aerosols in the region of Paris (France) during wintertime, J. Geophys. Res., 116, D22203, doi:10.1029/2011JD015756, 2011.
Shrivastava, M., Fast, J., Easter, R., Gustafson Jr., W. I., Zaveri, R. A., Jimenez, J. L., Saide, P., and Hodzic, A.: Modeling organic aerosols in a megacity: comparison of simple and complex rep-resentations of the volatility basis set approach, Atmos. Chem. Phys., 11, 6639–6662, doi:10.5194/acp-11-6639-2011, 2011. Song, C., Zaveri, R. A., Alexander, M., Thornton, J. A.,
Madronich, S., Ortega, J. V., Zelenyuk, A., Yu, X.-Y., Laskin, A., and Maughan, D. A.: Effect of hydrophobic primary or-ganic aerosols on secondary oror-ganic aerosol formation from ozonolysis of α-pinene, Geophys. Res. Lett., 34, L20803, doi:10.1029/2007GL030720, 2007.
Tsimpidi, A. P., Karydis, V. A., Zavala, M., Lei, W., Bei, N., Molina, L., and Pandis, S. N.: Sources and production of organic aerosol in Mexico City: insights from the combination of a chemical transport model (PMCAMx-2008) and measurements during MI-LAGRO, Atmos. Chem. Phys., 11, 5153–5168, doi:10.5194/acp-11-5153-2011, 2011.
Turpin, B. J. and Lim, H.-J.: Species contributions to PM2.5
mass concentrations: revisiting common assumptions for es-timating organic mass, Aerosol. Sci. Tech., 35, 602–610, doi:10.1080/02786820119445, 2001.
Vestreng, V.: Review and revision. Emission data reported to CLR-TAP Tech. Rep., EMEP MSW-W, Tech. rep., 2003.
Vutukuru, S., Griffin, R. J., and Dabdub, D.: Simulation and analysis of secondary organic aerosol dynamics in the South Coast Air Basin of California, J. Geophys. Res., 111, D10S12, doi:10.1029/2005JD006139, 2006.
Wang, L., Atkinson, R., and Arey, J.: Formation of 9,10-phenanthrenequinone by atmospheric gas-phase reac-tions of phenanthrene, Atmos. Environ., 41, 2025–2035, doi:10.1016/j.atmosenv.2006.11.008, 2007.