HAL Id: hal-01284801
https://hal.archives-ouvertes.fr/hal-01284801
Submitted on 19 Jan 2017
HAL is a multi-disciplinary open access
archive for the deposit and dissemination of
sci-entific research documents, whether they are
pub-lished or not. The documents may come from
teaching and research institutions in France or
abroad, or from public or private research centers.
L’archive ouverte pluridisciplinaire HAL, est
destinée au dépôt et à la diffusion de documents
scientifiques de niveau recherche, publiés ou non,
émanant des établissements d’enseignement et de
recherche français ou étrangers, des laboratoires
publics ou privés.
Environmental solutions for the sustainable production
of bioactive natural products from the marine sponge
Crambe crambe
Paula Perez-Lopez, E. Ternon, Sara Gonzalez-Garcia, Grégory Genta-Jouve,
Gumersindo Feijoo, Olivier P Thomas, Maria Teresa Moreira
To cite this version:
Paula Perez-Lopez, E. Ternon, Sara Gonzalez-Garcia, Grégory Genta-Jouve, Gumersindo Feijoo, et
al.. Environmental solutions for the sustainable production of bioactive natural products from the
marine sponge Crambe crambe. Science of the Total Environment, Elsevier, 2014, 475, pp.71-82.
�10.1016/j.scitotenv.2013.12.068�. �hal-01284801�
1
Environmental solutions for the sustainable production of bioactive natural products from the
1
marine sponge Crambe crambe
2
3
4
Paula Pérez-López1,*, Eva Ternon2, Sara González-García1, Grégory Genta-Jouve2, Gumersindo
5
Feijoo1, Olivier P. Thomas2 and Mª Teresa Moreira1
6
7
1
Department of Chemical Engineering, School of Engineering, University of Santiago de Compostela.
8
15782 - Santiago de Compostela, Spain.
9
2Nice Institute of Chemistry - PCRE, UMR 7272 CNRS, University of Nice Sophia-Antipolis, Faculté
10
des Sciences, Parc Valrose 06108 Nice, France.
11
12
* Corresponding author: Tel.: +34-881816739; E-mail address: paula.perez@usc.es
13
14
Abstract
15
Crambe crambe is a Mediterranean marine sponge known to produce original natural substances
16
belonging to two families of guanidine alkaloids, namely crambescins and crambescidins, which
17
exhibit cytotoxic and antiviral activities. These compounds are therefore considered as potential
18
anticancer drugs. The present study focuses on the environmental assessment of a novel in vivo
19
process for the production of pure crambescin and crambescidin using sponge specimens cultured in
20
aquarium.
21
The assessment was performed following the ISO 14040 standard and extended from the production
22
of the different mass and energy flows to the system to the growth of the sponge in indoor aquarium
23
and further periodic extraction and purification of the bioactive compounds. According to the results,
24
the two stages that have a remarkable contribution to all impact categories are the purification of the
25
bioactive molecules followed by the maintenance of the sponge culture in the aquarium. Among the
26
involved activities, the production of the chemicals (particularly methanol) together with the electricity
27
requirements (especially due to the aquarium lighting) are responsible for up to 90% of the impact in
28
most of the assessed categories. However, the contributions of other stages to the environmental
29
burdens, such as the collection of sponges, considerably depend on the assumptions made during the
30
inventory stage. The simulation of alternative scenarios has led to propose improvement alternatives
2 that may allow significant reductions ranging from 20% to 70%, mainly thanks to the reduction of
1
electricity requirements as well as the partial reuse of methanol.
2
3
Keywords Sponge cultivation, crambescins, crambescidins, antitumor, Life Cycle Assessment,
4
Crambe crambe, Life Cycle Inventory
5
6
7
3
1 Introduction
1
The largest portion of our planet’s surface is covered by water and the biological diversity found in
2
marine ecosystems make seas and oceans one of the most promising sources of natural resources for
3
the future (Larsen et al., 2005; Leal et al., 2012). Among aquatic organisms, sponges are one of the
4
most diverse invertebrates not only due to the number of species but also to the variety of
5
morphological characters (Hooper and Van Soest, 2002). Indeed, between 7,000 and 8,000 different
6
species have already been described, and at least twice that number is thought to exist (Hooper and
7
Lévi, 1994; Thakur and Müller, 2004). This diversity associated to the fact that these sessile
8
invertebrates produce a large array of secondary metabolites make sponges a good target for the
9
search of high value added molecules (Leal et al., 2012). According to Sipkema et al. (2005a), 5,300
10
natural products have been isolated from marine sponges worldwide, an amount that increases
11
annually (Blunt et al., 2013; 2012). Many of these molecules (e.g. halichondrin B, avarol,
12
crambescidins) have shown high biological activities that make them valuable products for medical
13
drugs development due to their anti-inflamatory, antitumor, immunosuppressive or neurosuppressive,
14
antiviral or antibiotic properties, among others (Bergman et al., 2011b; Bondu et al., 2012; Newman
15
and Cragg, 2004; Sipkema et al., 2005a). Eribulin mesylate is the first drug derived from a sponge
16
natural product that entered the market in 2011 as an anticancer agent (Huyck et al., 2011).
17
Despite the great potential of bioactive compounds from marine origin and particularly from sponges,
18
steady production is a key limiting factor that may hinder the development of commercial processes
19
(Murray et al., 2013). As bioactive compounds of marine origin are present in small quantities in the
20
producer organisms, fresh material is required in large amounts. Wild harvest only satisfies the
21
demand partially and arises as an unsuitable production route (Bergman et al., 2011b; Osinga et al.,
22
1999; Pomponi, 2001). Therefore, unless feasible alternatives to harvesting from the natural
23
environment are developed, many of these target molecules will remain unexploited (Murray et al.,
24
2013). For this reason, the current challenge is to develop efficient culture techniques for small to
25
medium-scale production schemes (Schippers et al., 2012).
26
The selection of the most appropriate culture technique can depend on the nature of the target
27
compound and its concentration within the sponge. Thus, if the organism presents a high
28
concentration of the desired metabolite, the cultivation of adult specimens would be the best choice,
29
while in vitro cell cultures may constitute a more suitable method for products found in low
4 concentrations (Schippers et al., 2012; Sipkema et al., 2005b). However, in vitro cultivation systems
1
have been found difficult to maintain in a long-term operation (Müller et al., 2004; Rinkevich, 1999).
2
Alternatively, aquaculture has been widely proposed as a technique to supply sponge materials, not
3
only for the production of natural bath sponges, but more recently also for biotechnological purposes
4
(Duckworth, 2009; Munro et al., 1999; Osinga et al., 1999; Pronzato and Manconi, 2008). Cultivation
5
of sponges can be performed either in situ or ex situ (Bergman et al., 2011b; Louden et al., 2007;
6
Sipkema et al., 2005b). Sea-based culture systems (in situ systems) consist of the construction of a
7
sponge field where small cuttings (explants) from a parent are strung on a support for cultivation in the
8
sea, so as to keep the organisms in their natural environment (Schippers et al., 2012). The main
9
drawbacks of this alternative are the numerous risks to which sponges are exposed, including
10
biological factors such as predation and fouling, but also diseases or adverse weather conditions
11
(Schippers et al., 2012; Webster et al., 2002). These risks are turned into very fluctuant survival rates
12
that strongly depend not only on the considered species but also on the location of the sponge field,
13
the season and the aquaculture method (Bergman et al., 2011a, 2011b; De Caralt et al., 2010, 2007;
14
De Voogd, 2007; Ledda et al., 2012; Louden et al., 2007; Osinga et al., 2010).
15
In order to circumvent these difficulties, the ex situ cultivation of sponges in closed or semi-enclosed
16
systems such as aquarium has been proposed as an alternative strategy (Mohamed et al., 2008;
17
Osinga et al., 2003). Even if this approach avoid seasonality effects and allow controlled conditions,
18
the observed growth rates in aquarium are significantly lower than those of mariculture. The limited
19
progress made in the cultivation of sponges under controlled conditions is due to the scarce
20
knowledge on the optimal environmental conditions and ecological needs required by sponges to
21
develop properly in a non-natural system (Carballo et al., 2010). In this regard, Schippers et al. (2012)
22
suggest that ex situ cultivation should be performed in a semi-continuous mode instead of a batch
23
operation, by regularly harvesting a small fraction of the culture.
24
This study focuses on the environmental assessment of the production of a bioactive fraction
25
constituted by crambescins and crambescidins from the marine sponge Crambe crambe (Schmidt,
26
1862), a red encrusting sponge that is widely found in the Western Mediterranean Sea as well as in
27
the Macaronesian archipelagos (Duran et al., 2004). Both families of guanidine alkaloids have already
28
revealed significant cytotoxic activities, and they are considered as potential anticancer drugs (Bondu
29
et al., 2012; Laville et al., 2009; Martín et al., 2013). The production process consists of the periodic
5 extraction of these biocompounds keeping the organisms alive. This alternative may allow a steady
1
and prolonged production of antitumoral compounds as a basis for a commercial application of these
2
biomolecules.
3
The evaluation of the process was performed according to a Life Cycle Assessment (LCA) approach.
4
LCA standardized methodology was used to assess the environmental impacts of the previously
5
described novel process from a cradle to gate perspective (ISO 14040, 2006). Although other
6
production processes involving marine organisms, such as microalgae or macroalgae, have been
7
already addressed through a life cycle viewpoint (Aresta et al., 2005; Brentner et al., 2011; Campbell
8
et al., 2011; Clarens et al., 2010; Lardon et al., 2009; Pérez-López et al., 2013), there are not available
9
LCA studies focused specifically on the production of high value added molecules from sponges. To
10
the best of our knowledge, this study develops for the first time a detailed life cycle inventory (LCI) and
11
quantification of the environmental impacts associated with the production of bioactive compounds by
12
sponges. Moreover, this paper presents a novel method to obtain the product while maintaining the
13
organism alive. This approach prevents from the unsustainable exploitation of sponges in natural
14
environments, where the growth of new individuals to replace those used to extract the target
15
compounds would take such a long time that their production would be unfeasible.
16
17
2 Goal and scope definition
18
2.1 Objectives
19
The main goal of this study was to identify the environmental impacts associated with the sustainable
20
production of two potential antitumor molecules, specifically crambescin and crambescidin, from the
21
Mediterranean sponge Crambe crambe. The production process has been developed in the Institut de
22
Chimie de Nice at the University the Nice Sophie-Antipolis (France). Furthermore, once the major hot
23
spots (or most problematic issues) were determined, alternative scenarios were simulated and
24
evaluated from an environmental point of view in order to suggest feasible improvement measures that
25
reduce impacts to obtain a more sustainable process.
26
The study takes into account the production of the different mass and energy flows to the system, as
27
well as the growth of the sponge in indoor aquarium and further periodic extraction and purification of
28
the bioactive compounds. Although only crambescidins have been patented for their cytotoxic and
29
antiviral activities (Rinehart and Jares-Erijman, 1998), recent studies suggest that also crambescins
6 may have interesting biological properties (Bondu et al., 2012; Martín et al., 2013). Therefore, both
1
families of guanidine alkaloids were considered as target products.
2
3
2.2 Functional unit
4
The functional unit is a key parameter that provides the reference to which the inputs and outputs of
5
the product system can be related (ISO 14040, 2006). In this case, the selected functional unit was
6
100 mg of total bioactive fraction, including 50 mg of pure crambescin A1 and 50 mg crambescidin
7
816, which corresponds to the production during one year of operation for the base scenario. It should
8
be pointed out that both products are obtained as pure compounds and they could be directly applied
9
for pharmaceutical purposes. The total economic value of this production is estimated in roughly 7,000
10
€, according to a price of 70 €/mg for a similar biocompound: halichondrin B (Sipkema et al., 2005b).
11
12
2.3 Description of the system under study
13
The system boundaries for the assessment of the production of crambescins and crambescidins by
14
Crambe crambe are shown in Figure 1. The stages or subsystems of the process included within the
15
system boundaries are further described below, considering the extraction frequency and yield of the
16
base scenario.
7 FOREGROUND SYSTEM SUBSYSTEM 4: EXTRACTION CRAMB ESCINS A ND CRAMB ESCIDI NS TRANSFER TO PLASTIC BOX WITH SEAWATER
SUBSYSTEM 5: PURIFICATION FILTRATION WITH PERISTALTIC PUMP PASS THROUGH FILTRATION COLUMN MECHANICAL STRESS WITH SOLVENT A IR , SOI L & W A TER EMISS IO NS BACKGROUND SYSTEM SUBSYSTEM 1: COLLECTION OF SPONGES FROM MARINE
ENVIRONMENT
SUBSYSTEM 2: WATER SUPPLY
R A W M A TERIA LS, W A TER & F O SS IL FUEL S SAILING TO SPONGES HABITAT SEAWATER COLLECTION FROM 5 M DEPTHS W A ST E TO TR EA TM EN T SCUBA EQUIPMENT ELECTRICITY VESSEL OPERATIONS AQUARIUM MACHINERY & LABWARE SUPPLIES COLLECTION WITH SCUBA EQUIPMENT PUMPING TO DECANTING TANK SEAWATER DECANTING PUMPING TO AQUARIUM
SUBSYSTEM 3: MAINTENANCE IN AQUARIUM
TRANSPORT IN COOLER
TRANSFER TO AQUARIUM
MAINTENANCE IN AQUARIUM (with lighting) WATER SUPPLY CHEMICALS (Solvents) ELUTION WITH SOLVENT PURIFICATION BY HPLC SEAWATER COLLECTION
1
Figure 1 System boundaries and process chain of the production of pure crambescin and
2
crambescidin from Crambe crambe in indoor aquariums.
3
4
i) Collection of sponges from marine environment
5
Specimens of the thin encrusting sponge Crambe crambe were collected with their substrate
6
(hammer) at 25 m depth by scuba diving and transported in a cooler filled with seawater (18 L) in a 7
7
m length polyester vessel. The inventory data is based in experiments with model samples of 50 cm2.
8
ii) Water supply
9
Three aquariums (20 L volume, 12x15x120 cm) were sustained by an open seawater circuit which
10
pumped water from a depth of 5 m. Seawater was fed at a flow of 2.5 m3/h and then decanted in a
8 tank of 10 m3, which also served as water supply for other units in the facilities. Once decanted,
1
seawater was transferred to the aquarium at a flow rate of 2 L/min.
2
iii) Maintenance in aquarium
3
Ten individuals on their substrates, with an approximate surface of 50 cm2 each, were transferred in
4
each aquarium, which was illuminated by conventional fluorescent lamps. Since the aquariums were
5
fed with seawater, operational conditions changed depending on the period of the year. The
6
temperature was kept below 20ºC during summer with a control system, whereas it fell to 10ºC in
7
winter. Although other parameters also fluctuated depending on the season, they exhibited values
8
around 36.8 kg/dm3 for salinity, 8 for pH and 6.5-7 mg/L for oxygen demand. The detailed data can be
9
accessed on the website http://somlit.epoc.u-bordeaux1.fr/fr/spip.php?rubrique48. After two days of
10
acclimatization in these aquariums (Figure 2), which could be observed by the presence of open
11
canals and oscules on the surface of the sponge, the specimens were ready for extraction.
12
13
Figure 2 Aquariums for the indoor cultivation of Crambe crambe
9
iv) Extraction
1
Each individual was transferred alive into a closed plastic box (700 mL) with 475 mL seawater and 25
2
mL of ethanol 96%. Mechanical stress was applied using a ―snail fork‖ and scratching with 5 cm2
3
intervals, avoiding canals. Half of the volume was collected for filtration in a second closed plastic box
4
and the stressed sponge was replaced in the aquarium for 7 days of recovering. After this period,
5
canals and oscules were opened again in the same way as before stressing the sponge.
6
v) Purification of the bioactive compounds
7
The resulting 250 mL solution from the previous stage was filtered with a peristaltic pump through 0.22
8
µm filter in order to remove all insoluble particles at 50 mL/min.
9
After the filtration stage, the bioactive compounds were extracted from the seawater and purified by
10
HPLC using water and methanol as solvents. The obtained fractions contained around 0.1 mg of pure
11
crambescin A1 and 0.1 mg of crambescidin 816 (0.2 mg of bioactive compounds obtained from each
12
individual). Both extraction and purification were repeated weekly on the same specimens. Despite the
13
periodical scratching of the sponge surface, individuals placed in the aquarium that were not covering
14
all the substrate were observed to grow at a rate of c.a. 20% a year (area measurement) with or
15
without milking. No comparison was done with culture in the sea but this result evidenced that the
16
sponges placed in aquarium were in relatively good health.
17
18
3 Inventory analysis, data quality and simplifications
19
The LCI data for the foreground system including chemicals, water and electricity consumptions,
20
consisted of average data obtained by on-site measurements. Water and air emissions were
21
calculated on the basis that the chemicals which are not consumed during the process are directly
22
discharged. The global inventory of the process is shown in Table 1.
23
24
25
10
Table 1 Global inventory for the production of pure crambescin and crambescidin from Crambe
1
crambe in indoor aquariums (functional unit: 100 mg bioactive fraction, consisting of 50 mg pure
2
crambescin and 50 mg pure crambescidin).
3
INPUTS from TECHNOSPHERE Materials
Collection of sponges from marine environment Maintenance in aquarium
Polyester (vessel hull) 0.111 kg Polymethyl metacrylate (PMMA) 0.515 kg
Steel (engine) 0.028 kg Lamps 0.059 kg
Anti-fouling paint 0.039 kg Extraction
Paint 0.010 kg Ethanol 19.725 kg
Lubricant oil 0.117 kg Distilled water 1.316 kg
Steel (scuba tank) 0.277 kg Polypropylene 0.160 kg
Compressed air (200 bar) 8.951 kg Trapping and purification
Neoprene (scuba equipment) 0.016 kg Steel 1.539 kg
Polypropylene (cooler) 0.016 kg Acetonitrile 7.860 kg
Water supply Mili-Q water 1000.0 kg
Steel 0.961 kg Methanol 791.8 kg
Polyvinyl chloride (PVC) 2.451 kg Trifluoroacetic acid (TFA) 1.489 kg
Concrete 51.543 kg
Energy
Collection of sponges from marine environment Maintenance in aquarium
Diesel 3.591 kg Lighting 1512.00 kWh
Water supply Extraction
Pumping from sea to facilities 234.75 kWh Filtration with peristaltic pump 2.08 kWh
Pumping from decanting tank to aquaria 144.68 kWh Purification with flow trap column 143.20 kWh
INPUTS from ENVIRONMENT Materials
Sponge biomass 159.6 g Seawater 50875 L
Substrate 957.4 g OUTPUTS to TECHNOSPHERE Product Crambescins 50 mg Crambescidins 50 mg Waste treatment
Collection of sponges from marine environment Maintenance in aquarium
Polyester 0.111 kg PMMA 0.515 kg
Steel 0.305 kg Polypropylene 0.559 kg
Neoprene 0.016 kg Lamps 58.800 g
Water supply Extraction
Steel 0.961 kg Polypropylene 0.160 kg
PVC 2.451kg Trapping and purification
Concrete 51.543 kg Steel 1.539 kg
OUTPUTS to ENVIRONMENT Air emissions Water emissions
Collection of sponges from marine environment Collection of sponges from marine environment
CO2 11.218 kg Xylene 3.496 g SO2 0.007 kg Cobalt 0.001 g NMVOC 0.023 kg Copper 8.122 g CH4 0.646 kg Zinc 3.673 g NOx 0.125 kg Ethylbenzene 0.914 g CO 0.027 kg Sea Nine 211 0.392 g PM 0.013 kg Ethanol 0.392 g 4-methylpentan-2-one 0.392 g Maintenance in aquarium Wastewater 50400 L Extraction Wastewater 238.16 L Ethanol 9.860 kg
Trapping and purification
Wastewater 1238 L Ethanol 9.860 kg Acetonitrile 7.860 kg Methanol 791.8 kg Trifluoroacetic acid 1.489 kg
4
11 Concerning the background system, the corresponding inventory data for the production of all the
1
inputs to the system were taken from Ecoinvent database. These inputs include the production of the
2
different chemicals required for the extraction and purification stages, the electricity used in the
3
different production stages, as well as the materials for the equipment (vessel and scuba equipment,
4
water supply system, aquarium, fluorescent tubes, electronic devices) and waste disposal.
5
In the case of the vessel, a shared use of the boat was considered for the base scenario. Thus, 1600
6
hours of annual operation were assumed, corresponding to 200 days of operation for 8 h/day. The
7
amount of materials associated with the collection of sponges itself was estimated considering that this
8
stage only requires 2 h of sailing within the whole year. The effect of this assumption will be further
9
discussed in following sections. Emissions from fuel combustion were determined as shown in the
10
EMEP/EEA air pollutant emission inventory guidebook of 2009 (EMEP/EEA, 2009). Chemicals related
11
to vessel operations (i.e. paint, anti-fouling paint, marine lubricant oil) were inventoried according to
12
Vázquez-Rowe et al. (2010), considering manufacturers’ specifications. For paint and anti-fouling
13
emitted to marine environment, a loss of two thirds of the total amount used was considered (Hospido
14
and Tyedmers, 2005). Solid waste was assumed to be disposed of in sanitary or inert landfills
15
Regarding water supply, the design of the pumping and decanting system was estimated from mass
16
balances. As the output from the decanting tank was shared with other aquariums, the corresponding
17
amount of material was calculated from the ratio between the flow to Crambe crambe aquarium and
18
the total flow to the decanting tank. The quantification of the polymethyl metacrylate of the aquarium
19
was also calculated according to the dimensions of the tank and the density of the material,
20
considering a wall thickness of 4 mm. As the inventory is associated with a hypothetical facility placed
21
in shore, transport of equipments and chemicals was considered negligible. A detailed description of
22
the corresponding database reports considered is shown in Table 2.
23
24
25
12
Table 2 Summary of data sources.
1
Energy Electricity (French electricity profile) Ecoinvent database (Dones et al. 2007)
Diesel Ecoinvent database (Jungbluth 2007)
Chemicals related to vessel operation
Anti-fouling Vázquez-Rowe et al. (2010)
Boat paint Marine lubricant oil
Solvents
Deionized water Ecoinvent database (Althaus et al. 2007)
Tap water Methanol
Ethanol Ecoinvent database (Sutter 2007)
Acetonitrile Trifluoroacetic acid†
Air for scuba equipment
Compressed air Ecoinvent database (Steiner and Frischnecht
2007)
Materials
Glass fibre reinforced plastic, polyester resin
Ecoinvent database (Kellenberger et al 2007) Concrete
Steel Ecoinvent database (Classen et al 2007)
Synthetic rubber Ecoinvent database (Hischier 2007)
PVC
Polymethyl methacrylate Polypropylene
Lamp (60 W) Ecoinvent database (Hischier et al. 2007)
Waste treatment Inert landfill Ecoinvent database (Doka 2007)
Sanitary landfill
†
Assimilated to acetic acid
2
3
The materials needed for the lab ware, as well as for the vessel and scuba equipment, were estimated
4
as average values from manufacturers’ specifications. For the equipment, different life spans were
5
considered, according to the assumptions that are specified in Table 3.
6
7
8
13
Table 3 Life spans and assumptions for materials’ quantification.
1
Equipment Component Life span Assumptions
Vessel
Hull (polyester) 30 years Calculated material increased by 25% to account for
vessel repairs and maintenance (Hospido and Tyedmers, 2005).
Diesel engine (steel) 15 years Average weight estimated from manufacturers. Estimated
weight increased by 50% to account for vessel repairs and maintenance (Hospido and Tyedmers, 2005).
Life span estimated from EMEP/EEA (2009).
Anti-fouling 1 year 2 coats per year assumed, according to manufacturers.
Paint 1 year 1 coat per year assumed, according to manufacturers.
Scuba Diving cylinder (steel) 15 years 10 uses/year, with 1 use related to C. crambe process.
Diving equipment (neoprene) 10 years 10 uses/year, with 1 use related to C. crambe process.
Water supply
Pumps for water supply to decanting tank (steel)
20 years Designed for 10 m3 decanting tank with 2.5 m3/h flow rate. 14% of water pumped associated with C. crambe cultivation.
Pipes for water supply to decanting tank (PVC)
20 years
Decanting tank (concrete) 20 years
Pumps for water supply to aquarium (steel)
20 years Designed to feed three aquaria with 2 L/min flow rate each.
Pipes for water supply to aquarium (PVC)
20 years
Cooler Polypropylene (PP) 20 years According to manufacturers’ specifications.
Aquarium
Polymethyl metacrylate (PMMA) tank
10 years Weight calculated from on-site direct measurement of dimensions.
Lights 30000 h According to manufacturers’ specifications.
Filtration and purification system
Plastic boxes, polypropylene (PP)
20 years According to manufacturers’ specifications.
Pump (steel) 20 years
Separation columns 20 years
2
In this study, two target pure products can be distinguished: crambescin and crambescidin. As both
3
compounds have shown comparable activities, they would have similar market prices; accordingly,
4
mass allocation was considered. Each biocompound corresponds to 50% of the total bioactive
5
fraction, so the environmental burdens associated with them would be half of the total impacts.
6
However, other fractions of crambescins and crambescidins may be obtained as by-products.
7
Although these fractions have been neglected in the present study further research could provide
8
additional information about their potential use. In this case, a fraction of the environmental impacts
9
would be allocated to these by-products and, therefore, the environmental burdens for the main target
10
compounds would decrease with respect to the results here described.
11
12
4 Life Cycle Assessment of crambescin and crambescidin production by Crambe crambe
13
14
The environmental profile of the described system was assessed by performing classification and
15
characterization stages of the LCA methodology (ISO 14040, 2006). Normalization and weighting were
16
not conducted as these optional (and, to some extent, subjective) elements were not considered to
14 provide additional, robust information for the objectives of the study. The characterization factors
1
reported by the Centre of Environmental Science of Leiden University (CML 2001 method) were used
2
(Guinée et al., 2001). The impact potentials (or impact categories) evaluated according to the CML
3
method were: abiotic depletion (ADP), acidification (AP), eutrophication (EP), global warming (GWP),
4
ozone layer depletion (ODP), human toxicity (HTP), freshwater aquatic ecotoxicity (FEP), marine
5
aquatic ecotoxicity (MEP), terrestrial ecotoxicity (TEP) and photochemical oxidants formation (POFP).
6
The software SimaPro 7.3 was used for the computational implementation of the inventories
7
(Goedkoop et al., 2008).
8
9
4.1 Identification of hot spots
10
The characterization results associated with the environmental impacts caused by C. crambe process
11
in the addressed impact categories are detailed in Table 4.
12
13
Table 4 Impact assessment results (characterization step) associated with the base scenario of the
14
production of pure crambescin and crambescidin from Crambe crambe in indoor aquariums (FU: 100
15
mg bioactive fraction).
16
Impact category Unit Value
Abiotic Depletion (ADP) kg Sb eq 17.27
Acidification (AP) kg SO2eq 3.44
Eutrophication (EP) kg PO4
-3
eq 1.23
Global Warming (GWP) kg CO2eq 967.54
Ozone Layer Depletion (ODP) g CFC-11 eq 0.131
Human Toxicity (HTP) kg 1,4-DB eq 640.36
Freshwater aquatic Ecotoxicity (FEP) kg 1,4-DB eq 260.47
Marine aquatic Ecotoxicity (MEP) kg 1,4-DB eq 171.02
Terrestrial Ecotoxicity (TEP) g 1,4-DB eq 62.48
Photochemical Oxidants Formation (POFP) g C2H4 eq 319.45
17
18
As shown in Figure 3, most of the environmental impacts are dominated by the purification stage, with
19
contributions ranging from 34.0% (for TEP) to nearly 90% (87.6% for ADP and 89.9% for ODP). The
20
maintenance in aquarium is also a significant stage, especially in terms of toxicity potentials, which
21
present values between 40.9% and 48.7%. Among the secondary subsystems, water supply is the
22
only stage that has a relevant contribution related to toxicity potentials, with impacts ranging from
23
14.4% (MEP) to 21.7% (HTP).
15
1
Figure 3 Relative contribution per stage of the production of pure crambescin and crambescidin in the
2
base scenario.
3
4
Figure 4 presents the relative contribution of the different activities that are involved in the process.
5
The production of the chemicals required in the extraction and purification stages constitutes the major
6
impact in the categories of ADP (89.2%), AP (51.1%), GWP (70.2%), ODP (89.6%) and POFP
7
(78.5%). Electricity is the other significant contributor to most of the environmental impacts. Indeed,
8
this process accounts for more than 40% in six of the assessed categories, being the main cause of
9
EP (48.7%), HTP (54.2%), FEP (53.0%), MEP (51.3%) and TEP (64.2%).
10
11
16
0%
20%
40%
60%
80%
100%
ADP
AP
EP
GWP
ODP
HTP
FEP
MEP
TEP
POFP
Rel
a
ti
v
e
co
n
tr
ib
u
ti
o
n
Chemicals
Vessel operations
Scuba equipment
Water supply network (infrastructures)
Materials of equipments
Electricity
Waste treatment
1
Figure 4 Relative contribution per involved activity of the production of pure crambescin and
2
crambescidin in the base scenario.
3
4
4.2 Analysis of major contributors
5
4.2.1 Production of chemicals
6
As the production of chemicals is the main issue related to the environmental impacts of the
7
production of crambescin and crambescidin, the breakdown of the contributions of these processes in
8
all the assessed categories is shown in Figure 5. According to the graph, the production of methanol
9
needed for the purification is the main responsible for the environmental impacts, with more than 80%
10
of the contributions to all the categories. The reason behind this remarkable contribution is not the
11
unitary environmental impact of methanol, but the large amount that is consumed in the process,
12
which is two orders of magnitude above other involved chemicals with higher impacts per mass unit,
13
such as acetonitrile or trifluoroacetic acid.
14
15
16
17
17
0%
20%
40%
60%
80%
100%
ADP
AP
EP
GWP ODP
HTP
FEP
MEP
TEP POFP
Re
la
ti
ve
c
o
n
tr
ib
u
ti
on
Ethanol
Distilled water
Acetonitrile
Methanol
Trifluoroacetic acid
1
Figure 5 Relative contribution of the production of the different chemicals involved in the production of
2
pure crambescin and crambescidin in the base scenario.
3
4
4.2.2 Electricity requirements
5
The second hot spot found in the analysis corresponds to the production of electricity in the different
6
stages of the process. This process especially contributes to EP and toxicity categories. The impacts
7
to EP are mainly due to the emissions of phosphate and nitrogen oxides whereas the contributions to
8
toxicity categories are mostly related to the emissions of metals to air and water. Particularly, HTP is
9
highly affected by emissions of selenium, arsenic and chromium VI, while the major responsible for
10
FEP and MEP are emissions of nickel, vanadium and beryllium. Finally, the environmental impacts to
11
TEP principally come from emissions of mercury derived from the use of coal for electricity generation
12
and chromium VI from the distribution network.
13
In order to identify the stages with higher electricity requirements, the contributions are depicted in
14
Figure 6. Nearly three fourths of the electricity consumption comes from lighting during the
15
maintenance of C. crambe in the aquarium. This finding is consistent with the experience from
16
previous works, which point out the importance of artificial lighting in the total energy cost of the
17
cultivation of other marine organisms (Das and Obbard, 2011; Pulz and Scheibenbogen, 1998).
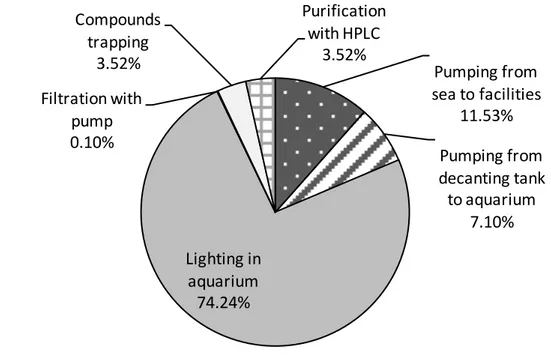
18 Therefore, the optimization in terms of electricity consumption should be focused on the reduction of
1
lighting. Among the secondary stages, water supply has the highest consumption, with 62% due to
2
water pumping. This result suggests that a recirculation in the seawater supply may help to reduce the
3
environmental impacts associated with this stage.
4
Pumping from
sea to facilities
11.53%
Pumping from
decanting tank
to aquarium
7.10%
Lighting in
aquarium
74.24%
Filtration with
pump
0.10%
Compounds
trapping
3.52%
Purification
with HPLC
3.52%
5
Figure 6 Relative contribution of the electricity requirements per stage to the total environmental
6
impact of the production of pure crambescin and crambescidin in the base scenario.
7
8
4.2.3 Effect of vessel operations
9
According to the results, the collection of the sponges from the environment is a minor contributor to
10
all impact categories. This contribution is mainly related to the vessel operations, including fuel
11
consumption but also material inputs for vessel construction. Despite the limited effect found for this
12
subsystem, the results are based on the assumption that the boat is also used for fishing. Thus, only a
13
slight fraction of the total environmental impacts associated with vessel operations were allocated to C.
14
crambe process.
15
Nevertheless, energy and material inputs in fishing vessels can affect the environmental profile
16
significantly, not only due to fuel consumption but also derived from other materials, such as
anti-17
fouling agents or paints (Hospido and Tyedmers, 2005; Vázquez-Rowe et al., 2010). Moreover, the
19 assumptions considered to allocate the impacts from the vessel may considerably affect the global
1
results. For this reason, a sensitivity analysis is shown in Figure 7.
2
Three alternative situations were compared to the base scenario. In the first of them (Sc 1), all the
3
impacts associated with the vessel operations were allocated to the production process of
4
crambescins and crambescidins, assuming that the boat used for the collection was a recreational
5
vessel with no additional function (in terms of other material products obtained). However, it may be
6
argued that a recreational use is associated with an immaterial function that should be taken into
7
account. For this reason, the second scenario (Sc 2) allocates the impact of the collection of sponges
8
according to the ratio between the number of hours associated with this process (2 h per year) and the
9
total number of sailed hours within the year, assuming 2 h sailed per week with 52 weeks per year.
10
The third scenario (Sc 3) is based on the findings of previous works, which suggest that the inputs to
11
vessel construction and maintenance have limited contributions to the total impacts of seafood
12
products (Hospido and Tyedmers, 2005). In this case, a fishing vessel is again considered, and
13
building materials are excluded from the system boundaries.
14
0%
50%
100%
150%
200%
250%
300%
350%
ADP
AP
EP
GWP
ODP
HTP
FEP
MEP
TEP
POFP
Re
la
ti
ve
c
o
n
tr
ib
u
ti
on
w
it
h
re
sp
ec
t
to
b
as
e
sc
en
ar
io
Base scenario: Daily use as fishing boat
Sc 1: Sponge collection as single function
Sc 2: Recreational use as valuable function
Sc 3: Exclusion of vessel materials
15
Figure 7 Effect of vessel operations in the environmental profile of the production of pure crambescin
16
and crambescidin.
20
Figure 7 shows that the assumptions considered to determine the impacts from the vessel
1
considerably influence the global environmental profile of the production of crambescins and
2
crambescidins. Indeed, when considering that the vessel use is only associated with sponge collection
3
(Sc 1), the contributions to most impact categories vary between 1.5 and 3.5 times those of the base
4
scenario. Despite these remarkable differences, it should be pointed out that this is the most unlikely
5
scenario, as the collection stage requires the vessel use for a very short period of time. Therefore, a
6
combined use of the boat for other purposes, such as fishing or collection of other marine specimens
7
for product exploitation, is expected. Regarding the other analyzed scenarios, the effect of vessel
8
operations seems rather restricted, with deviations lower than 4.5% in all the impact categories. Thus,
9
Sc 2 results in impact increases between 0.4% (ADP) and 4.4% (HTP), whereas reductions observed
10
in Sc 3 range from 0.03% (ADP) to 0.3% (HTP) with respect to the base scenario.
11
12
5 Simulation of improvement scenarios
13
5.1 Solvent reuse
14
The production of the chemicals required for the purification stage was the principal contributor to the
15
environmental impacts in five categories (ADP, AP, GWP, ODP and POFP). More than 85% of the
16
mentioned contributions were specifically derived from the production of methanol, due to the large
17
use of this solvent for the purification. For this reason, an alternative scenario is suggested, consisting
18
of the reuse of 50% of the methanol required for obtaining of pure crambescin and crambescidin.
19
Although this assumption was not based on experimental work, several authors have already checked
20
the feasibility of reusing methanol to extract other similar alkaloids (Blaicher et al., 1981; Harkrader
21
and Jones, 1998).
22
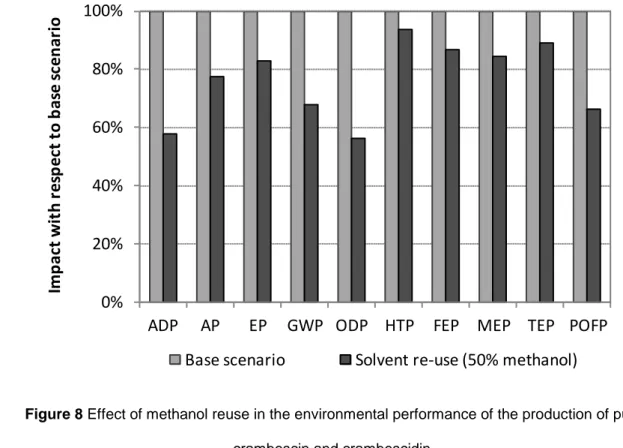
According to Figure 8, the reuse of methanol constitutes a promising option to improve the
23
environmental profile of the studied process. The evaluated scenario presents remarkable reductions
24
in terms of ADP (42.4%), AP (22.6%), GWP (32.4%), ODP (43.8%) and POFP (33.7%). The effect on
25
other categories, such as HTP (6.5%) and TEP (11.0%) is relatively limited, though the performance in
26
all the considered categories is better than the base scenario.
27
21
0%
20%
40%
60%
80%
100%
ADP
AP
EP
GWP ODP HTP
FEP MEP TEP POFP
Imp
ac
t
w
it
h
r
es
p
ec
t
to
b
as
e
sc
en
ar
io
Base scenario
Solvent re-use (50% methanol)
1
Figure 8 Effect of methanol reuse in the environmental performance of the production of pure
2
crambescin and crambescidin.
3
4
5.2 Electricity optimization
5
The production of electricity required throughout the whole C. crambe process was identified as a
6
major concern in six of the ten impact categories under assessment (AP, EP, HTP, FEP, MEP and
7
TEP). The main reason is the dependence on non-renewable sources due to the use of electricity that
8
is directly taken from the French grid, which is characterized by a limited need of fossil fuels but a high
9
reliance on nuclear energy (Dones et al., 2007). Hence, two possible scenarios are evaluated,
10
concerning the use of solar and wind energy as alternative sources to the electricity taken from the
11
grid.
12
In addition, the artificial lighting of the aquarium was identified as the main hot spot associated with
13
electricity requirements, with 75% of the total electric consumption. This is due to the use of
14
fluorescent lamps, which were switched on 24 h/day. However, the necessity of light for the sponge
15
growth is lower than for other marine organisms such as microalgae or macroalgae (González-Rivero
16
et al., 2012; Ogbonna and Tanaka, 2000; Yeh et al., 2010). Furthermore, in the evaluated process, the
17
main goal is not maximizing the biomass production but maintaining the sponge in such healthy
18
conditions that allow the periodical extraction of compounds from the specimens. Therefore, an
22 alternative regime with less lighting seems a feasible strategy to reduce the total electricity
1
consumption of the system. Thus, two additional improvement options were proposed: 16:8 regime
2
scenario and scenario with no lighting. Furthermore, an additional scenario was evaluated, regarding
3
the substitution of conventional fluorescent tubes by light-emitting diodes (LEDs). As well as having a
4
longer life span (about three times higher) than fluorescent lamps, LEDs are also more efficient and
5
can result in a 50% decrease in energy consumption (Chen et al., 2011).
6
According to Figure 9, all the proposed alternatives show remarkable reductions in the environmental
7
impact for most categories, except from the solar scenario in ODP which had a higher contribution
8
mainly due to the production of materials for the solar panels. As expected, the improvements were
9
especially significant for toxicity categories, which were more affected by the electricity requirements,
10
but also for AP and EP. In the solar scenario, the reductions ranged from 2.5% (ADP) and 3.1%
11
(POFP) up to 15% for HTP, FEP and MEP, and even 45.7% for TEP. The wind scenario showed the
12
largest reductions, with more than 35% of improvement in six of the categories (AP, EP, HTP, FEP,
13
MEP and TEP). The scenario with no lighting had the second best performance, with reductions
14
between 30% and 50% for the same categories. However, it should be highlighted that this scenario is
15
based on the assumption that sponge can be maintained in the same conditions (comparable growth
16
rate and equivalent amount of bioactive compounds obtained by extraction) as in the base scenario
17
without lighting. As the verification of this assumption would require further research, the 16:8 regime
18
scenario seems a more feasible strategy to be applied in the short-term. Despite the more restricted
19
improvement, the 16:8 regime scenario still showed significant reductions, ranging from 10% to 16%
20
for those categories that are affected by the use of electricity within the process. Finally, the
21
substitution of conventional fluorescent tubes by LEDs allowed reductions between 3.5% and 24.5%.
22
23
23
1
Figure 9 Sensitivity analysis of the environmental performance considering four improved alternatives
2
for the reduction of electricity requirements in the production of pure crambescin and crambescidin.
3
4
5.3 Recirculation effect
5
As indicated in the previous section, water supply constitutes a secondary contributor that may have a
6
relevant effect in some categories, due to the electricity consumption of the pumping system. Indeed,
7
continuous pumping of water has already been identified as a significant issue in the cultivation of
8
other marine organisms such as microalgae (Lam and Lee, 2012; Xu et al., 2011).
9
In the case of C. crambe process, this contribution is mostly associated with the seawater collection
10
and pumping from the sea to the decanting tank. Therefore, an alternative scenario where 50%
11
seawater was recycled to the aquarium instead of its direct discharge to the sea was assessed.
12
However, the results indicate that the improvement achieved with this measure would be rather
13
limited, with reductions of impact between 0.7% and 4.3%. The highest reductions are found in the
14
toxicity categories, which were those with a significant contribution of electricity. The improvements
15
related to these categories would range from 3.5% for HTP to 4.3% for TEP.
16
17
18
24 5.4 Improved waste treatment
1
Although the environmental burdens associated with waste treatment are rather slight in comparison
2
with other subsystems of the process, an alternative option was proposed, regarding the final disposal
3
of the waste. In the present study, the assumption that the materials of the equipment and
4
infrastructure were finally sent to landfill was considered. Nevertheless, previous LCA studies of
5
related processes proposed other approaches, such as sending these materials to recycling (Collet et
6
al., 2011). In this case, the final disposal of steel, plastic materials and concrete to landfill was
7
substituted by the recycling of these materials. However, the improvement observed with this measure
8
is very limited and the highest reductions were between 1% and 2.4% for the categories of EP, FEP
9
and MEP.
10
11
5.5 Best performance vs most feasible scenario
12
Several of the simulated scenarios can be simultaneously applied, allowing higher reductions of
13
impact. Therefore, the compatible improvement alternatives were combined in two hypothetical
14
scenarios:
15
- Best performance scenario. In this case, the maintenance in aquarium with no lighting is
16
considered together with the wind electricity supply for the other electricity requirements.
17
Additional, a methanol re-use of 50% is taken into account, along with a 50% seawater
18
recirculation and a recycling scenario.
19
- Most feasible scenario. Despite having the lowest environmental burdens, the best
20
performance scenario is based on the assumptions that the reduction of lighting and the
re-21
use of the solvent neither affect the yield of the process nor the purity of the two produced
22
compounds. As further research should be needed to prove the accuracy of these
23
assumptions, another alternative scenario that seems more feasible in a short period of time
24
was proposed. In this case, a 16:8 regime was considered jointly with a solar electricity supply
25
and the use of LEDs, as well as a methanol re-use of 25%, was assumed. Seawater
26
recirculation and recycling of materials were also considered.
27
The improvements that may be achieved by the combined implementation of the alternative scenarios
28
are shown in Figure 10. According to these results, the environmental profile of the production of pure
29
crambescin and crambescidin can be significantly enhanced, with reductions of impact for the best
25 performance scenario between 52 and 78% depending on the category. Even if a more conservative
1
approach is considered, the most feasible scenario in a short term period would allow improvements
2
up to 40% for the categories of AP, EP, HTP, FEP and MEP, and as high as 65% for TEP.
3
4
0%
20%
40%
60%
80%
100%
ADP
AP
EP GWP ODP HTP FEP MEP TEP POFP
Imp
ac
t
w
it
h
r
es
p
ec
t
to
b
as
e
sc
en
ar
io
Base scenario
Best scenario
Most feasible scenario
5
Figure 10 Comparative environmental profiles of the base scenario, the best potential scenario and
6
the most feasible scenario.
7
8
6 Conclusions
9
The principal aim of this study was to evaluate the environmental performance of a novel process for
10
the production of high value added biomolecules from a marine sponge. The life cycle approach was
11
used to identify the main contributors to the assessed impact categories, allowing the proposal of
12
several improvement scenarios that were simulated and analyzed through LCA methodology.
13
The use of large amounts of methanol during the purification stage and the high electricity
14
requirements essentially due to the continuous illumination of the aquarium were found as the two
15
major environmental concerns of the base scenario. The environmental burdens of other stages, such
16
as the collection of sponges, considerably depend on the assumptions made during the inventory
17
analysis stage.
18
Among the proposed improved alternatives, the most promising scenarios were those related to
19
electricity optimization, including the reduction of electricity requirements together with the use of
26 LEDs and the substitution of electricity from the grid by renewable sources, as well as the partial
re-1
use of methanol. The combined implementation of the evaluated options may allow impact reductions
2
in the short term ranging between 20% and 65% depending on the considered category. Further
3
environmental improvements up to 70% could be achieved according to the best potential scenario.
4
The results of this paper should be taken into account, not only due to the importance of LCA as a tool
5
to develop improved production systems but also due to the novelty of the proposed process. This
6
production process avoids the over-exploitation of the marine environment, as it replaces the need of
7
wild harvesting by the maintenance of specimens in a closed aquarium. Moreover, the process is
8
currently under a scale up phase and will be able to deliver enough sponge natural products to be
9
amenable to commercialization. Therefore, this alternative may allow to overcome existing bottlenecks
10
regarding the marine-based biotechnology and specifically in the field of sponges cultivation.
11
12
Acknowledgements This project has been developed within the framework of the BAMMBO Project
13
(Project reference: FP7 KBBE-2010-4 - 265896) and has been partially financed by the Xunta de
14
Galicia (Project Reference GRC 2010/37). P. Pérez-López would like to express her gratitude to the
15
Spanish Ministry of Education for her research fellowship (AP2012-1605). We also acknowledge the
16
assistance of D. Luquet for the recollection of sponges and the Observatoire d’Océanologie de
17
Villefranche sur Mer (G. Gorsky) for hosting the aquariums.
18
19
References
20
Althaus HJ, Chudacoff M, Hischier R, Jungbluth N, Osses M, Primas A. Life cycle inventories of
21
chemicals. Ecoinvent report No. 8, v2.0. EMPA, Swiss Centre for Life Cycle Inventories, Dübendorf
22
(Switzerland); 2007.
23
Aresta M, Dibenedetto A, Barberio G. Utilization of macro-algae for enhanced CO2 fixation and biofuels
24
production: Development of a computing software for an LCA study. Fuel Process Technol 2005;
25
86(14-15):1679-93.
26
Bergman O, Haber M, Mayzel B, Anderson M, Shpigel M, Hill R, et al. Marine-based cultivation of
27
Diacarnus sponges and the bacterial community composition of wild and maricultured sponges and
28
their larvae. Mar Biotechnol 2011a; 13(6):1169-82.
27 Bergman O, Mayzel B, Anderson MA, -Shpigel M, Hill RT, Ilan M. Examination of marine-based
1
cultivation of three demosponges for acquiring bioactive marine natural products. Mar Drugs 2011b;
2
9(11):2201-19.
3
Blaicher FM, Nolte R, Mukherjee KD. Lupin protein concentrates by extraction with aqueous alcohols.
4
J Am Oil Chem Soc 1981; 58(7):A761-A765.
5
Blunt JW, Copp BR, Keyzers RA, Munro MHG, Prinsep MR. Marine natural products. Nat Prod Rep
6
2012; 29(2):144-222.
7
Blunt JW, Copp BR, Keyzers RA, Munro MHG, Prinsep MR. Marine natural products. Nat Prod Rep
8
2013; 30(2):237-323.
9
Bondu S, Genta-Jouve G, Leiròs M, Vale C, Guigonis J-M, Botana LM, et al. Additional bioactive
10
guanidine alkaloids from the Mediterranean sponge Crambe crambe. RSC Adv 2012; 2:2828-2835.
11
Brentner LB, Eckelman MJ, Zimmerman JB. Combinatorial life cycle assessment to inform process
12
design of industrial production of algal biodiesel. Environ Sci Technol 2011; 45(16):7060-7.
13
Campbell PK, Beer T, Batten D. Life cycle assessment of biodiesel production from microalgae in
14
ponds. Bioresour Technol 2011; 102(1):50-6.
15
Carballo J, Yañez B, Zubía E, Ortega M, Vega C. Culture of explants from the sponge Mycale cecilia
16
to obtain bioactive mycalazal-type metabolites. Mar Biotechnol 2010; 12(5):516-25.
17
Chen CY, Yeh KL, Aisyah R, Lee DJ, Chang JS. Cultivation, photobioreactor design and harvesting of
18
microalgae for biodiesel production: A critical review. Bioresour Technol 2011; 102(1):71-81.
19
Clarens AF, Resurreccion EP, White MA, Colosi LM. Environmental life cycle comparison of algae to
20
other bioenergy feedstocks. Environ Sci Technol 2010; 44(5):1813-9.
21
Collet P, Hélias A, Lardon L, Ras M, Goy R-A, Steyer J-P. Life-cycle assessment of microalgae culture
22
coupled to biogas production. Bioresour Technol 2011; 102(1):207-14.
23
Das P, Obbard JP. Incremental energy supply for microalgae culture in a photobioreactor. Bioresour
24
Technol 2011; 102(3):2973-8.
25
De Caralt S, Otjens H, Uriz M, Wijffels R. Cultivation of sponge larvae: settlement, survival, and growth
26
of juveniles. Mar Biotechnol 2007; 9(5):592-605.
27
De Caralt S, Sánchez-Fontenla J, Uriz MJ, Wijffels RH. In Situ Aquaculture Methods for Dysidea avara
28
(Demospongiae, Porifera) in the Northwestern Mediterranean. Mar Drugs 2010; 8(6):1731-42.