HAL Id: hal-00976866
https://hal.archives-ouvertes.fr/hal-00976866
Submitted on 14 Apr 2014
HAL is a multi-disciplinary open access
archive for the deposit and dissemination of
sci-entific research documents, whether they are
pub-lished or not. The documents may come from
teaching and research institutions in France or
abroad, or from public or private research centers.
L’archive ouverte pluridisciplinaire HAL, est
destinée au dépôt et à la diffusion de documents
scientifiques de niveau recherche, publiés ou non,
émanant des établissements d’enseignement et de
recherche français ou étrangers, des laboratoires
publics ou privés.
Larmor diffraction measurement of the temperature
dependence of lattice constants in CuGeO3
Nicolas Martin, L. P. Regnault, S. Klimko, Emilio Lorenzo, R. Gahler
To cite this version:
Nicolas Martin, L. P. Regnault, S. Klimko, Emilio Lorenzo, R. Gahler. Larmor diffraction
measure-ment of the temperature dependence of lattice constants in CuGeO3. Physica B: Condensed Matter,
Elsevier, 2010, 406 (12), pp.2333-2336. �10.1016/j.physb.2010.10.006�. �hal-00976866�
Larmor diffraction measurement of the temperature dependence of lattice constants in
CuGeO
3N. Martina,b, L.-P. Regnaulta,∗, S. Klimkoc, J.E. Lorenzod, R. G¨ahlere
aCEA-Grenoble, INAC-SPSMS-MDN, 38054 Grenoble Cedex 9, France bUniversit´e Joseph Fourier-Grenoble, BP 87, 38402 Saint Martin d’H`eres, France cLaboratoire L´eon Brillouin, CEA-CNRS, CEA-Saclay, 91191 Gif-sur-Yvette, France
dInstitut N´eel, CNRS/UJF, 38042 Grenoble Cedex 9, France eInstitut Laue Langevin, BP 156, 38042 Grenoble, France
Abstract
By using the Neutron Larmor Diffraction method and a setup based on the improved Neutron Resonant Spin Echo option ZETA recently installed on the three-axis spectrometer IN22 (CRG beam line at the ILL), we have determined the precise relative evolution of the inter- and intra-chain lattice constants of the paradigmatic spin-Peierls compound CuGeO3as a function of temperature. Our
results are consistent with previous results obtained by conventionnal high-resolution diffraction. This method also allows to retrieve independently the sample mosaicities, as well as the widths of various lattice-spacings distributions, thus offering an evaluation of the intrinsic sample quality. In spite of the good definition of the spin-Peierls transition at TS P=14.1(1)K in our sample, we observe
a large distribution of lattice constants (∆d/d ≃ 3×10⁻³), while the mosaicity of the sample appears to be quite reasonnable (. 20′).
Keywords: Neutron Larmor diffraction, High-resolution neutron diffraction, Spin-Peierls transition
1. Introduction
Neutron Larmor Diffraction(NLD) is a very powerful tech-nique which was introducted more than one decade ago by M.Th. Rekveldt et al. [1]. As in classical F. Mezei’s Neu-tron Spin Echo(NSE) [2], the key is to make use of the spin degree of freedom and the Larmor precession to label the neu-tron velocity (Larmor encoding). The aim is to relax the usu-ally tight compromise between intensity and accuracy, and to achieve high-resolution diffraction measurement while work-ing with quite modest collimation. As we will see in the next section, the NLD technique (in our case a by-product of the Neutron Resonance Spin Echo (NRSE) technique [3]), allows the precise determination of lattice parameters and their dis-tributions, from measurements of the neutron polarization as a function of the total neutron Larmor phase. In this paper, we will report on the Larmor diffraction option recently installed on the thermal three-axis spectrometer IN22 (CRG beam line at the ILL), which is based on an improved version of the ZETA NRSE option [4]. As first application, the NLD technique has been used for the accurate determination of the relative de-pendences of lattice parameters b and c versus temperature in the inorganic spin-Peierls (SP) compound CuGeO3, in which
strong splattice interactions are at the origin of a lattice in-stability below a characteristic temperature TS P ≈14.1 K, the
so-called spin-Peierls transition temperature [5]. Such an insta-bility should significantly affect the lattice constants.
∗Corresponding author
Email address: regnault@ill.fr (L.-P. Regnault)
2. The basics of Neutron Larmor Diffraction
The configuration that we will first consider is sketched in Fig.1a). Basically, the sample is surrounded by two homoge-neous magnetic field regions of thickness L. A polarized neu-tron beam with polarization direction perpendicular to ~Bis pro-duced by reflexion of the primary beam on an Heusler crystal. Before being elastically scattered by the sample, neutrons travel through the first magnetic field region and, by virtue of the Lar-mor precession, they accumulate a phase ϕi=γn| ~B|L/vi⊥, where
γn=2.916 kHz.G−1is the neutron gyromagnetic ratio and vi⊥is
the component of the neutron velocity perpendicular to the field boundary. In the same way, an additionnal precession angle ϕf
is undergone after scattering so that the total phase, measured by means of a polarization analyzer, can be written as:
ϕtot =ϕi+ϕf =ωLL 1 vi ⊥ + 1 v⊥f , (1)
where ωL=γn| ~B|is the Larmor pulsation. Bragg’s law
stip-ulates that all neutrons must have the same velocity component perpendicular to the lattice planes generating diffraction (i.e. vi⊥ = v
f
⊥ =
πmn
~d). If the field boundaries are parallel to the
lat-tice planes, it is easy to show from Eq.1that the total phase is proportionnal to the lattice spacing d [1]:
ϕtot =
2mnωLL
π~ d (2)
As a consquence, any change in d will lead to a correspond-ing modification of the total Larmor phase:
∆ϕtot=
∆d
ϕtotis independent of the incoming beam monochromaticity
and unavoidable slight misalignment of the setup at first order, but a special care has to be taken when working with large phase values. The data of Section 3 have been corrected from the effects of higher-order terms.
a) b) L ~ B B~ ~ G/2 d θB ϕtot ζ =π 2−θB ~ B − ~B α θB+ α θB−α
Figure 1: Sketch of a typical Neutron Larmor Diffraction setup. a) ”Symmetric
configuration”: Total Larmor phase is proportionnal to lattice spacing d. Each neutron, whatever its velocity or divergence with respect to the main beam axis, participates in the same way to ϕtot. If there is a distribution of lattice plane
distances, final polarization which is the statistical average of the individual spin phases over the beam, will be reduced as a function of ϕtot. b)
”Anti-symmetric configuration”: In this case, the final polarization is sensitive to lattice planes misalignement at first order. Measurement of P as a function of ϕtotyields the mosaicity of the sample along selected direction.
It is worth noting that, in practice, we use a configuration with four pairs of thin radio-frequency (RF) resonance π-flipper coils, separated by zero field regions of length L, to simulate the extended field region (the so-called Bootstrap technique [3],[6]). In addition of offering a spectacular increase by a fac-tor of 4 in field-integral ωLL(which can be as high as 1.5 × 10⁷
rad.m.s−1with the present ZETA set-up), these devices can be
easily rotated by an angle ζ = ±70◦ with respect to the mean
beam axis, thus allowing to fulfill the prerequisites for NLD. Furthermore, in this case ωL is the pulsation of RF fields and
is controlled with high accuracy. Equation (3) has two major consequences which are exploited in order to conduct high res-olution diffraction experiments:
i) The Larmor phase ϕtot can reach ≈ 104 radians. Given
the accuracy on the measurement of precession-region lengths, we can discriminate relative phase changes of the order of 2 × 10⁻⁶ and thus evaluate the d-spacing evolution with very high
precision,
ii) If we consider the case of an unperfect crystal showing lattice-parameter fluctuations, the polarization at the analyzer (which is defined as the average of the spin projection of the whole neutron beam) is reduced as each d-spacing produces a different phase. This reduction of polarization can be measured as a function of the total phase ϕtot, yielding the width δ of
the d-distribution. Assuming that this distribution is a sum of gaussian functions, we can write [7]:
P = P0hcos ϕ(∆d/d)i = P0 Z X j fj(∆d/d) cos ϕ(∆d/d)d(∆d/d) = P0 X j wjexp − ϕ2totδ2j 16 ln 2 , (4)
where P0is the spectrometer intrinsic polarization (≈ 0.90,
value essentially controled by the Heusler-based polarizer and analyser), wj are the stastiscial weight corresponding to
dis-tributions of width δi. This capability is very important as it
allows to evaluate a possible phase mixing over the sample vol-ume.
On the other hand, a real single crystal usually shows a finite mosaicity. If we work within the ”anti-symmetric” configura-tion (Fig.1b)) for which the field directions are opposite before and after the sample, flight-path lengths are slightly different on each side for neutrons diffracted by misaligned blocks, thus in-ducing depolarization when considering the whole beam. If we calculate and expand to first order the residual phase induced by a misalignement α of lattice planes, we find [7]:
ϕ(α) = ωLL v · cos ζ cos(ζ + α)− cos ζ cos(ζ − α) ! ∼ 2ωLL v tan ζ · α (5)
In the following we will call f (α) the distribution of lattice-planes orientations. We see that within this configuration the phase is sensitive to α at first order. From the latter relation, taking into account the resolution function R( ~Q) of the host spectrometer, we can express the final polarization at the an-alyzer as:
P = P0hcos ϕ(α)i
= P0
Z
R( ~Q(0) − ~Q(α)) f (α) cos (ϕ(α)) dα (6)
Thus, measuring P as a function of the total Larmor phase ϕtotyields the width of the distribution f (α) through:
P = P0exp − ϕ 2 tottan2ζ 16 ln 2(1/δω2+1/η2) ! , (7)
where ζ = π/2 −θBis the flipper-coils tilt angle, θBthe Bragg
angle, δω the width (FWHM) of the rocking curve across the Bragg peak and η the mosaicity of the sample.
3. Experimental
To perform our experiment, we have used our Neutron Reso-nant Spin Echo(NRSE) option ZETA installed on its host ther-mal triple-axis spectrometer IN22. Thanks to the optimized 2
double µ-metal shielding, a high field homogeneity, a power-ful cooling system of the static and RF coils, and the possibility to rotate them by angles as large as 70◦, high resolution NLD
experiments can be easily conducted, although ZETA was orig-inally designed to perform structural and magnetic excitation-lifetimes measurements. A picture of the coil setup is shown in Fig.2.
Figure 2: View of the first ”arm” of ZETA in the absence of the double µ-metal shielding. The two pairs of RF flipper coils are tilted w.r.t. the beam axis by an angle of 70◦, showing the high flexibility of the setup.
Turning to CuGeO3, this compound crystallizes within the
orthorhombic space group Pbmm with cell parameters a = 4.81
Å, b = 8.47 Å, and c = 2.94 Å. We used a single crystal of volume 0.4 cm3, synthetized by traveling floating zone method
with an image furnace. Our sample displays a sharp spin-Peierls transition at TS P=14.1(1) K. On the phenomenological
point of view, the 3D lattice of atoms, subjected via the spin-lattice couplings to the strong low-energy quantum fluctuations of the spin-1/2 linear chain sub-system, can undergo a dimer-ization associated with tiny out-of-phase displacements of Cu2+
ions (∼ 0.006 Å) along the (0,0,1) chain direction. This struc-tural distortion is induced by an alternating rotation of GeO4
tetrahedras around the c-axis [8]. This has a strong effect on the super-exchange mediated by Cu-O-Cu bondings and, obvi-ously, on the evolution of the inter-chain constant b [9]. Deeper informations about the physics of CuGeO3can be found in [5].
Long ago, the inter-chain (b) and intra-chain (c) lattice con-stants have been measured by means of conventional diffrac-tion as a funcdiffrac-tion of temperature [8]. For this determination, the authors have used a triple-axis spectrometer with two differ-ent (wavelength and horizontal-collimation) configurations, λ = 3.31 Å (2.36 Å) and 10’-10’-10’-10’ (10’-20’-10’-10’), for the (0,6,0)((0,0,2)) reflexion, respectively1. We have repeated this
kind of measurement by using NLD on the (0,4,0) and (0,0,1) Bragg peaks, employing a wavelength of λ = 2.36 Å and nat-ural collimations 30’-40’-40’-110’. The tilt angles of the
π-1Collimations are given here in the usual order i.e. before monochromator
-sample - analyzer - detector.
flipper coils were ζ(0,4,0) = ±55.7◦ and ζ(0,0,1) = ±66.2◦. Our results agree very well with those of K. Hirota et al. within the error bars (see Fig.3). NLD error bars, which are mainly of statistical origin, are smaller than the size of points. The major improvement is the rather precise definition of the sharp spontaneous thermal contraction occuring along the b-axis at TS P. Below 14.2 K, the relative evolution of parameter b can
be fitted to a single power-law of the form (1 − T/TS P)β with
β ≈ 0.5, in agreement with previous determinations [9]. The intra-chain parameter c seems to be less affected by the spin-Peierls transtion, though one can clearly observe a break in the curve slope. An intriguing new feature is seen in the decrease of c below T ∼ 5 K but we cannot conclude on the reality of this sudden change as we couldn’t reach smaller temperature to confirm this observation. Above TS P, the data are best
repro-duced from the functional aT2+bT4, at least up to temperatures
of the order of 65 K. If the quartic term is rather general2, the
quadratic term is a pure signature of the quasi-1D antiferro-magnetic correlations, which leave an imprint on the structural properties at temperatures larger than TS P, through the
spin-lattice couplings. 0 10 20 30 40 50 60 70 -4.0 -3.5 -3.0 -2.5 -2.0 -1.5 -1.0 -0.5 0.0 0.5 1.0 Q = (0,6,0) - CND Q = (0,0,2) - CND Q = (0,4,0) - NLD Q = (0,0,1) - NLD Temperature (K) ∆ d / d ( x 1 0 4 ) TSP
Figure 3: Lattice spacing evolutions as a function of temperature. Black closed triangles correspond to the inter-chain parameter b, which shows a well-defined contraction at TS P. Red closed circles represent the evolution of the intra-chain
constant c, which is less affected by the spin-Peierls transition. For sake of comparison, we have also reproduced the results of K. Hirota et al., extracted from [8] (open symbols).
As a complementary measurement, we wanted to check whether the quality of this peculiar sample could be affected by successive heating/cooling cycles. Thus, we used ZETA in the ”symmetric” and ”antisymmetric” mode to determine lattice spacings spread along both b- and c-axis as well as its intrinsic mosaicity. In the first case, we have used Eq.4to fit the data of Fig.4, with j = 2 and the following parameters:
2In a Debye model, assuming that Gr¨uneisen parameters are constant,
ther-mal expansivity coefficient of a given material is expected to follow the same law as specific heat (i.e. ∝ T3) for T not much higher than θ
D. This implies a
Axis δ1(10−3) w1 δ2(10−4) w2
b 2.9(1) 0.73(2) 3.0(3) 0.26(1) c 2.1(1) 0.79(3) 2.9(5) 0.22(3) It is surprising to note that the relative-distribution widths, δ1, are much larger than the thermal expansivity of the material,
∆d/d. This result can be understood if d(T ) ≈ d(0)(1 + F(T )) over the whole parameter range, where F(T) is a function only depending on T, but obviously material-dependent. Apparently, the rather poor definition of parameters b and c do not af-fect much the occurence in our sample of a well-defined spin-Peierls transition. Another matter of thinking is the fact that the data are better reproduced if we invoke the presence of two d-distributions. The one with the highest stastistical weight is of the order of 10−3, while the other present widths one order
of magnitude smaller. It is not clear so far if both distributions are really present within the sample or if this result is only a measurement artifact. However, such a two-scale distribution has also been reported in other materials [7]. In any case, the largest value gives the right estimate of the disorder within the sample. 0 2000 4000 6000 8000 10000 0.0 0.2 0.4 0.6 0.8 1.0
"Symmet r ic" configuration
Q = (0, 4, 0) Q = (0, 0, 1)
Larmor phase ϕtot (rad)
N or m al iz e d p ol ar iz at io n
Figure 4: Polarization as function of the total Larmor phase measured at ~Q =
(0, 4, 0) and ~Q = (0, 0, 1) in the ”symmetric” configuration. The data have
been recorded at T = 66K and corrected from higher-order effects of the beam divergence, as ϕtotreach ∼ 104radian and we worked with natural collimations
(see section3).
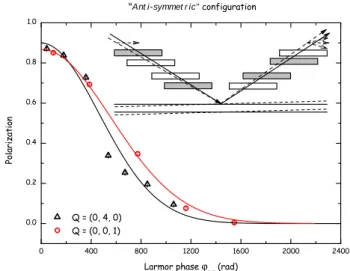
The sample mosaicity was measured in the ”anti-symmetric” mode. A rapid decay of the polarization is observed as a func-tion of ϕtot, as documented from Fig.5. A fit of experimental
data to Eq.7gives the following values, where δω is the width (FWHM) of the corresponding rocking curve:
Axis ηFW H M(′) δωFW H M(′)
b 17.7(9) 35.4(6) c 15.2(2) 36.9(4)
The values of mosaic spreads which have been extracted for the b and c directions are found far below the widths of the corresponding rocking scans and reflect better the intrinsic mo-saicity of the sample. The precise knowledge of η is crucial
when considering, e.g., the design of innovative materials or data correction of NRSE experiments.
0 400 800 1200 1600 2000 2400 0.0 0.2 0.4 0.6 0.8 1.0 Po la ri za ti on Larmor phase ϕ tot (rad) "Ant i-symmet r ic" configuration
Q = (0, 4, 0) Q = (0, 0, 1)
Figure 5: Polarization as a function of ϕtotin the ”anti-symmetric” mode at T
=66 K. The decay is interpreted as the effect of the intrinsic sample mosaicity convoluted with the host spectrometer resolution function (see section2).
4. Conclusion
By means of Neutron Larmor Diffraction, we have carried out a thorough study of a single-crystalline sample of the spin-Peierls compound CuGeO3. Our results tend to show that this
technique is reliable and will most probably become in a close future a method of choice for a better characterization of a large variety of samples, in particular systems showing struc-tural phase transitions. Technical limitations restrict the pre-cision of such measurements to values far below what can be obtained in dilatometry experiments, but the unique feature of Larmor diffraction is to allow an evaluation of the sample qual-ity with the same setup and over its full volume.
Acknowledgements
This work has been supported by the French ANR project NEMSICOM and the European NMI3 network under contract HII3-CT-2003-505925.
References
[1] M.Th. Rekveldt, T. Keller and R. Golub, Europhys. Lett. 54, 342 (2001). [2] F. Mezei, Z. Physik 255, 146 (1972).
[3] R. Golub and R. G¨ahler, Phys. Lett. A 123, 43 (1987).
[4] S. Klimko, C. Stadler, P. B¨oni, R. Currat, F. Demmel, B. Fåk, R. G¨ahler, F. Mezei and B. Toperverg, Physica B 335, 188 (2003).
[5] J.-P. Boucher and L.-P. Regnault, J. Phys. I France 6, 1939 (1996) and references therein.
[6] R. G¨ahler and R. Golub, J. Phys. France 49, 1195 (1988).
[7] T. Keller, M.Th. Rekveldt and K. Habicht, Appl. Phys. A 74, S127 (2002). [8] K. Hirota et al., Phys. Rev. Lett. 73, 736 (1994).
[9] Q.J. Harris et al., Phys. Rev. B 50, 12606 (1994).
[10] N.W. Ashcroft and N.D. Mermin, Solid state physics, Saunders College Publishing (1976).