HAL Id: hal-02326721
https://hal.archives-ouvertes.fr/hal-02326721
Submitted on 22 Oct 2019HAL is a multi-disciplinary open access
archive for the deposit and dissemination of sci-entific research documents, whether they are pub-lished or not. The documents may come from teaching and research institutions in France or abroad, or from public or private research centers.
L’archive ouverte pluridisciplinaire HAL, est destinée au dépôt et à la diffusion de documents scientifiques de niveau recherche, publiés ou non, émanant des établissements d’enseignement et de recherche français ou étrangers, des laboratoires publics ou privés.
Pascal Marrot, Anne Charmantier, Jacques Blondel, Dany Garant
To cite this version:
Pascal Marrot, Anne Charmantier, Jacques Blondel, Dany Garant. Current spring warming as a driver of selection on reproductive timing in a wild passerine. Journal of Animal Ecology, Wiley, 2018, 87 (3), pp.754-764. �10.1111/1365-2656.12794�. �hal-02326721�
Current Spring Warming as a Driver of Selection on Reproductive Timing in a Wild Passerine
Journal: Journal of Animal Ecology Manuscript ID JAE-2017-00314.R2 Manuscript Type: Research Article Date Submitted by the Author: 04-Dec-2017
Complete List of Authors: Marrot, Pascal; Centre d'Ecologie Fonctionnelle et Évolutive UMR 5175, ; Université de Sherbrooke, Département de Biologie, Faculté des Sciences Charmantier, Anne; CEFE
Blondel, Jacques; CEFE
Garant, Dany; Universite de Sherbrooke, Biologie
Key-words: Natural selection, Cyanistes caeruleus, Spring warming, Laying date, Blue tit, Model averaging
Full title
1
Current Spring Warming as a Driver of Selection on Reproductive Timing in a Wild Passerine
2
3
Running head
4
Warming Induces Strong Selection on Lay Date
5
6
Authors:
7
Pascal Marrot 1,2,*, Anne Charmantier 2, Jacques Blondel 2, Dany Garant 1
8
1 Département de Biologie, Faculté des Sciences, Université de Sherbrooke, Sherbrooke,
9
Québec, J1K 2R1, Canada
10
2 CEFE–UMR 5175 1919 route de Mende, F-34293 Montpellier, CEDEX 5, France
11
*corresponding author: Pascal.Marrot@usherbrooke.ca 12
13
Keywords:
14
Natural selection, Cyanistes caeruleus, Spring warming, Laying date, Blue tit, Model
15
averaging
16
18
Abstract
19
1. Evolutionary adaptation as a response to climate change is expected for fitness-related traits
20
affected by climate and exhibiting genetic variance. Although the relationship between
21
warmer spring temperature and earlier timing of reproduction is well documented,
22
quantifications and predictions of the impact of global warming on natural selection acting on
23
phenology in wild populations remain rare. If global warming affects fitness in a similar way
24
across individuals within a population, or if fitness consequences are independent of
25
phenotypic variation in key-adaptive traits, then no evolutionary response is expected for
26
these traits.
27
2. Here we quantified the selection pressures acting on laying date during a 24-year
28
monitoring of blue tits in southern Mediterranean France, a hot spot of climate warming. We
29
explored the temporal fluctuation in annual selection gradients and we determined its
30
temperature-related drivers.
31
3. We first investigated the month-specific warming since 1970 in our study site and tested its
32
influence on selection pressures using a model averaging approach. Then, we quantified the
33
selection strength associated with temperature anomalies experienced by the blue tit
34
population.
35
4. We found that natural selection acting on laying date significantly fluctuated both in
36
magnitude and in sign across years. After identifying a significant warming in spring and
37
summer, we showed that warmer daily maximum temperatures in April were significantly
38
associated with stronger selection pressures for reproductive timing. Our results indicated an
39
increase in the strength of selection by 46% for every +1°C anomaly.
5. Our results confirm the general assumption that recent climate change translates into strong
41
selection favouring earlier breeders in passerine birds. Our findings also suggest that
42
differences in fitness among individuals varying in their breeding phenology increase with
43
climate warming. Such climate driven influence on the strength of directional selection acting
44
on laying date could favour an adaptive response in this trait, since it is heritable.
45
47
Introduction
48
Global climate change results in an increase in temperature mean and variability and
49
generates new environmental conditions for wild populations (Coumou & Rahmstorf 2012).
50
Rising temperatures are known to alter the timing of vegetation development (Fu et al. 2012),
51
leading to shifts in phenology and range shifts of many taxa (Chen et al. 2011) such as plants
52
(Svenning & Sandel 2013), birds (Crick 2004), insects (Parmesan & Yohe 2003) and
53
mammals (Moritz et al. 2008). These responses to climate warming can be due to non-genetic
54
changes (i.e. phenotypic plasticity) or to evolutionary adaptations (Gienapp et al. 2008).
55
Whereas evidence of phenotypic plasticity in this context is often reported in the literature
56
(Merilä & Hendry 2014), studies showing an evolutionary response to climate change are still
57
rare (Gienapp et al. 2008; Merilä 2012). This “missing evidence” (Merilä 2012) is worrying
58
because phenotypic plasticity alone is unlikely to sustain population responses to climate
59
change over a long term warming period (Hoffmann & Sgro 2011).
60
Evolutionary adaptation under climate change is expected if climate-induced selective
61
pressures are found for key adaptive traits with significant genetic variance (Hoffmann &
62
Sgro 2011). While most life history traits affected by the recent climate warming were shown
63
to possess some level of genetic variance in the wild (Postma 2014), strong selective pressures
64
resulting from climate change have always been assumed, but rarely quantified empirically
65
(MacColl 2011). Global warming is often expected to generate strong selection pressures
66
because numerous phenotypic mismatches between adaptive optima and population
67
phenotypic mean have been documented following a warming trend (Gienapp et al. 2008). In
68
particular, theoretical modelling has shown that climate change should increase selection on
69
consumer phenology, even if the environmental changes affecting consumer and resource
phenologies are of similar magnitude (Gienapp, Reed & Visser 2014). However, one of the
71
basic assumptions for natural selection to occur is that fitness varies among individuals and
72
that this variance in fitness is related to their phenotypes. Hence, for climate warming to
73
induce a selective pressure on wild populations, it should cause differences in individual
74
fitness depending on specific phenotypes. In other words, if a phenotypic mismatch affects all
75
individuals similarly, climate warming will not result in a new selective pressure, and no
76
evolutionary response is expected. So far, although many shifts in phenology have been
77
shown in response to warming across all living taxa (Parmesan & Yohe 2003), few studies
78
have attempted to assess changes in selection under climate change (Domínguez & Dirzo
79
1995; McAdam & Boutin 2003; Reale et al. 2003; Maad & Alexandersson 2004; Nussey et
80
al. 2005; Husby et al. 2010; Karell et al. 2011; Anderson et al. 2012; Campbell & Powers
81
2015; Chevin, Visser & Tufto 2015; Kingsolver & Buckley 2015; Visser et al. 2015). These
82
studies showed no clear pattern of new selective regime resulting from global warming, with
83
both increases (Domínguez & Dirzo 1995; Maad & Alexandersson 2004; Nussey et al. 2005;
84
Anderson et al. 2012) and decreases (McAdam & Boutin 2003; Karell et al. 2011; Campbell
85
& Powers 2015) in the strength of natural selection. Moreover, most studies compared
86
selection pressures between only two years (e.g. Domínguez & Dirzo 1995; Maad &
87
Alexandersson 2004) and/or failed to identify a significant climate warming over the study
88
period (e.g. Maad & Alexandersson 2004; Anderson et al. 2012; Visser et al. 2015). Despite
89
these limitations, previous studies showed an increase in the strength of selection along with
90
temperatures in different birds species such as the Pied Flycatcher, Ficedula hypoleuca
91
(Visser et al. 2015), the Great Tit, Parus major (Visser et al. 1998; Charmantier et al. 2008;
92
Husby, Visser & Kruuk 2011; Gienapp et al. 2013; Reed, Jenouvrier & Visser 2013; Vedder,
93
Bouwhuis & Sheldon 2013; Chevin, Visser & Tufto 2015) and the Blue Tit, Cyanistes
94
caeruleus (Phillimore et al. 2016). Overall, these previous studies explored a potential
influence of temperature, partially neglecting the investigation of climate warming (i.e. an
96
exploration of warming patterns over the study period). In order to predict the evolutionary
97
response of populations to climate warming, it is crucial to go beyond an assessment of the
98
impact of temperature on natural selection, and to quantify and predict variation in the
99
strength of selection beyond the current warming period.
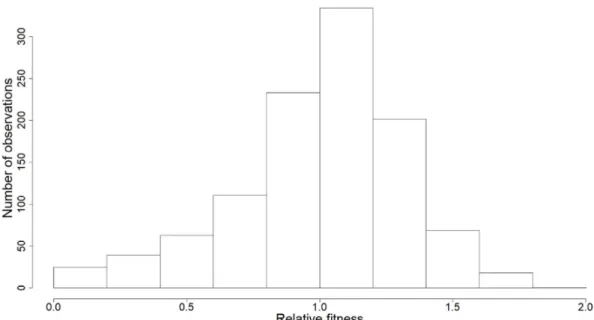
100
Here we investigated temperature-related changes in selection pressures acting on the timing
101
of reproduction in a wild population of blue tits (Cyanistes caeruleus). The Blue tit is an
102
insectivorous passerine living in temperate forests of Europe and in parts of the Middle East,
103
breeding from March to June in southern France (Blondel et al. 2006). The amount of food
104
availability for offspring (mostly leaf-eating caterpillars) is dependent on the timing of
105
budding of oaks (Quercus sp.), which is highly responsive to ambient temperature (Van
106
Noordwijk, McCleery & Perrins 1995). Thus, like most passerines in temperate forests, blue
107
tits must adjust their laying date to track the amount of food available (Visser et al. 1998;
108
Thomas et al. 2001). Fitness differences among birds breeding at different dates are strong
109
with earlier breeders achieving higher reproductive success (Blondel et al. 2006; Porlier et al.
110
2012). Previous studies on a closely related species, the Great tit (Parus major) have shown
111
that the selection differential on breeding dates is correlated with the mean temperature during
112
the period when birds are incubating (Van Noordwijk, McCleery & Perrins 1995; Chevin,
113
Visser & Tufto 2015). Warmer springs generated an increased mismatch between great tit
114
breeding phenology and seasonal food peak, leading to intensifying directional selection on
115
laying dates (Visser, Holleman & Gienapp 2006; Reed, Jenouvrier & Visser 2013). Warmer
116
spring temperatures are thus expected to drive patterns of selection for earlier laying date in
117
the blue tit. However, contrary to the previous work exploring the temperature-induced
118
selection on laying date in great tits in North-Western Europe, we explored the impact of
119
warming on blue tits in the Mediterranean area, which is a warming “hot spot” (i.e. a
responsive region to climate change, Giorgi 2006). Indeed, a pronounced decrease in
121
precipitation and increase in warming, especially in summer, is forecasted in this region for
122
the next decades (Giorgi & Lionello 2008). The relative importance of climate warming on
123
ecological processes may also depend on temperature seasonality. For example, budburst
124
seems to be more sensitive to spring warming than to winter warming (Fu et al. 2012).
125
Moreover, the influence of climate warming might depend on the type of temperature because
126
patterns of warming are different among mean, minimum and maximum temperatures
127
(Rebetez & Reinhard 2008). In order to investigate in detail these climatic drivers, we
128
explored the increase in monthly minimum, mean and maximum temperatures across the
129
calendar year, and assessed their roles as potential determinants of selection acting on blue tit
130
laying date. In addition to these climatic drivers, we also took into account the selective
131
impact of two non-climatic variables: annual predation rate on nestlings and population
132
density. Predation on nestlings by small carnivores (in particular the weasel Mustela nivalis)
133
has strong but variable impacts on blue tit reproductive success in our study population.
134
Population density has previously been shown to increase the strength of selection acting on
135
laying date (e.g. in pied flycatchers, Ficedula hypoleuca, Ahola et al. 2011). These variables
136
were taken into account because they fluctuated across years, potentially shaping the climatic
137
signal on selection acting on laying date. Finally, after assessing the relative impact of
138
climatic and non-climatic drivers of selection on laying date, we quantified the relationship
139
between temperature drivers and selection strength.
140
142
Materials and Methods
143
144
Study area and field work
145
Our analyses were based on data from a long-term study of blue tits in the forest of La
146
Rouvière, near the city of Montpellier (43°40’N, 03°40’E), southern France. This forest is
147
dominated by downy oaks (Quercus humilis) but also contains 10% of holm oaks (Quercus
148
ilex) and it is equipped with 227 nest boxes over 175 ha. Since 1991, nest boxes are routinely
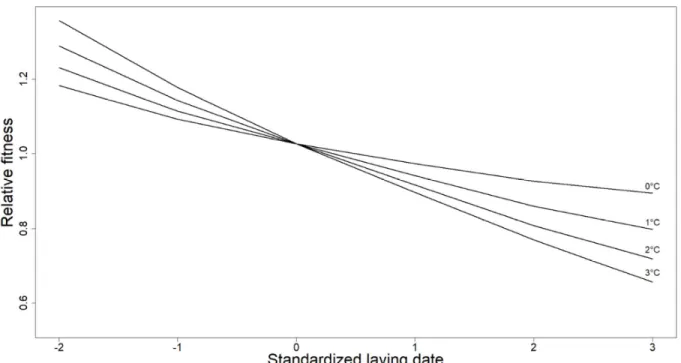
149
monitored from the onset of nest construction until all nestlings have fledged (see
150
Charmantier et al. 2016 for further details). For each brood, laying date (date of the first egg
151
laid, March 1st = 1), clutch size (number of eggs laid) and number of fledglings (number of
152
chicks leaving the nest) are recorded. Parents are captured in nest boxes when chicks are c.9
153
days or older, and are uniquely marked with metal rings (provided by C.R.B.P.O). Nestlings
154
are ringed when 9-15 days old. Only first clutches that were not manipulated were included in
155
the analyses (second clutches represent less than 1% of total number of clutches). Bird
156
capture, ringing and measurement were performed under individual ringing permits delivered
157
by the Centre de Recherche sur la Biologie des Populations d’Oiseaux, C.R.B.P.O, Paris
158
(France). The monitoring protocol was approved by the Animal Care and Use Committee
159
Languedoc-Roussillon (CEEA-LR-12066).
160
Environmental variables
161
Data on daily minimum (Tn), maximum (Tx) and mean (estimated as (Tn+Tx)/2)
162
temperatures were obtained from a weather station (43°24’N, 03°57’E) located approximately
163
24km from the breeding site, provided by Meteo France
164
(https://donneespubliques.meteofrance.fr/). Anomalies in temperatures were estimated as the
difference between monthly temperatures and temperatures averaged for each month across
166
all years during the 1970-2000 period. Annual predation rate was estimated as the ratio of the
167
number of broods predated by the number of nest boxes occupied by blue tits within each
168
year. Because annual predation rate ranged from 0 to 0.4, and because 80% of annual
169
predation rates were below 0.1, its skewed distribution prevented model convergence. Hence,
170
we considered this variable as a categorical variable taking two different modalities: low and
171
high corresponding to a predation rate below or above 0.1 respectively. Only 4 years
172
corresponded to a high predation rate (2001, 2006, 2009 and 2010, i.e. 16% of the time span
173
of the study). Note that variation in predation rate does not result solely from the natural
174
dynamics of predators, but also from hunting practices and various anti-predator protocols
175
that have changed over the monitoring years in order to limit the impact of predators on the
176
study population. Population density was estimated as the inverse of the mean distance (in
177
km) between each nest box occupied by blue tits and its closest neighbour (including nest
178
boxes occupied by great tits). Instead of using the proportion of occupied nest-boxes, we used
179
this metric to estimate local density around the nest boxes since the number and the density of
180
nest boxes within the population changed across years.
181
Statistical analyses
182
All statistical analyses were carried out using the software R (version 3.1.1) (R Core Team
183
2014).
184
Climatic analyses
185
Mean, minimum and maximum monthly temperatures were estimated as the daily temperature
186
averaged during each month. Smoothed monthly temperatures were obtained from a 2-years
187
moving average window (supplementary material, Fig. S1). Temperature changes for each
month were estimated as the slope of anomalies in monthly temperatures regressed over time
189
(years) across the period 1970-2015.
190
Selection analyses
191
Analyses were conducted on female individual data that were not subject to any experimental
192
manipulation, with a dataset of 1024 breeding observations on 721 female blue tits breeding
193
between 1991 and 2014. Selection acting on laying date was defined as the slope of the
194
regression of relative fitness (i.e. number of fledglings) on laying date (Lande & Arnold
195
1983). Clutch size was also included as covariate in the fixed part of the model to estimate the
196
selection acting on laying date independently from selection acting on the highly correlated
197
clutch size (Perrins & McCleery 1989). Thus, selection was estimated from the effect of
198
laying date on the proportion of a clutch that fledged (i.e. brood fledging success). Nonlinear
199
selection acting on laying date was not analysed further because quadratic and correlational
200
selection were not significant (results not shown). Relative fitness corresponded to the
201
individual fitness divided by the annual mean fitness of the population, and followed a
202
Gaussian distribution (Fig. S2). All selection analyses were conducted on laying dates
203
standardized annually (zero mean and unit variance within each year) in order to control for
204
an environmental covariance between fitness and the trait across years. As this dataset
205
includes repeated values within each year and for some individuals, year and individual
206
identities were included in the random part of the selection models to control for
207
pseudoreplication. The significance of selection gradients was estimated using F tests using
208
lmerTest (Kuznetsova, Brockhoff & Christensen 2015) package in R. Temporal variation in
209
selection gradients across years was assessed by including an interaction term between laying
210
date and years (considered as a discrete variable) in the random part of the selection model.
211
This method allows to account for errors in the estimation of annual selection gradients when
212
exploring their fluctuation (Morrissey & Hadfield 2012). Mixed models were fitted using the
lmer function from the lme4 package (Bates et al. 2015) in R and the significance of random
214
terms was tested by Likelihood Ratio Tests (LRT).
215
Model averaging approach
216
The model averaging analysis was conducted following methods provided by Grueber et al.
217
(2011) and by Symonds and Moussalli (2011). Based on information theory, the aim of model
218
averaging is to evaluate relative supports for a given hypothesis over others instead of null
219
hypothesis testing (Burnham, Anderson & Huyvaert 2011). In a first step, we determined
220
which variable to include in the models. Focusing on the four months covering the blue tit
221
breeding season (March, April, May and June), we explored the influence of 14 potential
222
drivers (daily minimum, mean and maximum monthly temperatures (for each of the four
223
months), predation rate and population density) on annual selection by including, in the
224
selection models, interaction terms between laying date and the drivers. In a second step, we
225
generated a "model set" by adjusting all possible submodels from the set of predictors of
226
interest. All submodels included laying date, clutch size, and a combination of drivers
227
(interaction terms between environmental variables and laying date). Since 14 environmental
228
variables were investigated, 16384 models could potentially be fitted (214). Because
229
collinearity among predictors can be a problem in model selection (Freckleton, Cooper & Jetz
230
2011), we constrained the number of possible submodels by avoiding models including
231
temperatures from the same month (e.g. maximum March temperature did not appear in a
232
model including mean or minimum temperatures in March), leading to 1024 models
233
generated. In a third step, we employed the model averaging procedure on our set of models
234
(based on their AIC) in order to obtain robust environmental driver estimates (associated with
235
their standard errors) accounting for model selection uncertainty. This approach is particularly
236
suitable when the Akaike weight of the best model is not considerably higher than the next
237
best model (i.e. it has an Akaike weight of >0.9) (Symonds & Moussalli 2011), which was the
case in our analysis since the Akaike weight of the best model was 0.66. Because employing a
239
model averaging procedure on the full set of models can be spurious (due to models with very
240
low Akaike weight), we selected the 95% confidence set of models (Symonds & Moussalli
241
2011). This procedure led to a set of 17 best models identified (Table S1). Moreover, relative
242
importance of each of the 14 environmental variables was estimated by summing the Akaike
243
weights from each model in which the specific variable appeared. This relative importance
244
can be interpreted as the probability that the variable is a component of the best model
245
(Symonds & Moussalli 2011). A variable was considered as driving selection if its relative
246
importance was above 80%. Note that this relative importance should not be interpreted as a p
247 value. 248 249 Results 250
Patterns of temperature increase
251
The first aim of our analysis was to assess the recent warming in the forest of La Rouvière
252
near Montpellier. Over the last 45 years (1970-2015), the trend in mean annual temperatures
253
in this habitat was +0.44°C / decade (P < 0.001) (Fig. S1). The warming trend was slightly
254
stronger for minimum annual temperature (+0.51°C / decade, P < 0.001) than for maximum
255
annual temperature (+0.33°C / decade, P < 0.001). While warming was negligible (between
-256
0.20°C and +0.20°C per decade) during winter months (Dec.-Feb.), the increase in
257
temperatures in spring (March-May) and summer (June-August) ranged between +0.30°C and
258
+0.80°C per decade (Fig. 1). Warming during autumn (Sept.-Nov.) was also high with trends
259
ranging between +0.20°C and +0.90°C per decade. Minimum monthly temperatures increased
260
all year long except in winter and maximum monthly temperatures increased more strongly in
261
spring-early summer with more than 0.5°C per decade in March, April, May and June (Fig.
1). Our results thus show a strong seasonality in the warming trend experienced by birds at
263
our study site, along with differences between warming in minimum and maximum monthly
264
temperatures.
265
266
Selection on laying date and its temporal variation
267
The fixed effects of the model revealed that the selection gradient on laying date was
268
significantly negative over the 24 years of monitoring (β = -0.049 ± 0.009, F = 26.15, P <
269
0.001). Clutch size was under a strong and significant positive selection (β = 0.119 ± 0.009, F
270
= 149.34, P < 0.001).
271
Our analyses of annual variation in selection gradients for laying date revealed highly
272
significant fluctuations (χ² = 21.86, P < 0.001) in sign and magnitude, across the 24-years of
273
monitoring (Fig. 2). For example, while early breeders were strongly favoured in 2008
274
(estimates obtained from a model of selection fitted in 2008: β = -0.155 ± 0.036, F = 33.84, P
275
< 0.001), selection favouring late breeders was found in 2009 (albeit not significant, β = 0.130
276
± 0.068, F = 2.54, P = 0.133) (Fig. 2). Overall, the annual standard deviation in the slope of
277
the selection gradients was relatively strong (σyear (βLD) = 0.063).
278
279
Climate warming and selection
280
Among the 14 possible drivers tested, the model averaging analysis showed that only daily
281
maximum April temperature and predation rate influenced selection on laying date, with a
282
probability to be a component of the best model (relative importance; e.g. from the fixed
283
effect part of the model) of respectively 89% and 88% (Table 1). Warm maximum April
284
temperatures and low predation rates increased the strength of selection on laying date (since
selection acting on laying date is negative overall – earlier breeders are favoured). Note that
286
these two drivers also significantly altered the strength of selection when tested using a null
287
hypothesis statistical framework (F = 12.12, P < 0.001 and F = 16.57, P < 0.001 for the
288
interaction terms between laying date with predation rate and maximum April temperatures
289
respectively).
290
All other potential drivers had probabilities ≤ 6% of influencing breeding selection patterns.
291
Given the values of the overall linear selection gradient for laying date (-0.050 ± 0.009) and
292
the interaction term between laying date and maximum April temperature (-0.024 ± 0.013),
293
these results suggest an increase in the strength of selection by 46% (95% confidence
294
intervals (CI): 30%-63%) for a +1°C anomaly (Fig. 3, Table 1). This means that the difference
295
in relative fledging success between breeders laying 38 days apart (5 standard deviation in
296
laying date, i.e. encompassing 97% of the laying dates) are 0.32 and 0.72 for 0°C and +3°C
297
anomalies respectively (Fig. S3). To illustrate further the selective effect of anomalies in
298
maximum April temperatures, we conducted selection models on three sub-datasets,
299
depending on temperature: 12 years, 3 years and 5 years in which anomalies in April
300
temperature were lower than 1°C, ranged from 1°C to 2°C, and were higher than 2°C
301
respectively. Results from these three models of selection confirmed that higher temperature
302
anomalies translated into stronger selection acting on laying date (βLD = -0.0267 ± 0.0139, βLD
303
= -0.0789 ± 0.0335 and βLD = -0.1307 ± 0.0201 for T°C < 1°C, 1°C < T°C < 2°C and T°C >
304
2°C respectively; see Fig. 4). While selection acting on laying date was marginally
non-305
significant for years experiencing a temperature anomaly lower than 1°C (F = 3.72, P =
306
0.054), the selection gradient was significant for years experiencing a temperature anomaly
307
higher than 1°C (F = 5.54, P = 0.021 and F = 42.30, P < 0.001, for 1°C < T°C < 2°C and T°C
308
> 2°C respectively). Finally, the selection gradients acting on clutch size were not stronger
309
with greater temperature anomalies (βCS = 0.1321 ± 0.0139, βCS = 0.1310 ± 0.0336 and βCS =
0.0703 ± 0.0196 for T°C < 1°C, 1°C < T°C < 2°C and T°C > 2°C respectively; all P-value 311 were < 0.001). 312 313 Discussion 314
Our analyses confirmed that selection favors earlier breeding in Mediterranean blue tits
315
overall, but also that natural selection showed important fluctuations both in sign and
316
magnitude over the past 25 years. Importantly, we showed that daily maximum April
317
temperature was the main climatic variable correlated with the strength of selection on laying
318
date.
319
In temperate forests, spring temperatures are tightly linked to the annual laying date
320
adjustment of insectivorous passerines (Visser, Holleman & Caro 2009) that are faced with
321
the challenge of matching maximum caterpillar availability to nestling food demand (e.g. Van
322
Noordwijk, McCleery & Perrins 1995; Visser, Holleman & Gienapp 2006). As a result, avian
323
ecologists have emphasized that warmer spring temperatures should contribute to
324
strengthening selection for earlier laying date (Crick 2004; Gienapp, Reed & Visser 2014).
325
This assumption is potentially misleading because natural selection is caused by a variance in
326
fitness and phenotypic performances of individuals, which have rarely been shown to be
327
driven by climate warming (but see Reed, Jenouvrier & Visser 2013; Chevin, Visser & Tufto
328
2015). In other words, a mismatch between trophic levels induced by warming temperatures
329
does not always represent a selection pressure, in particular if all individuals are affected
330
similarly by the warming. Hence, our results represent a rare demonstration of an increase in
331
natural selection strength following a strong spring warming. This warming experienced by
332
blue tits was linked to an increase in the variation in their expected fledging success,
333
depending on their timing of reproduction. This result is concordant qualitatively with those
found in two great tit populations monitored for more than 40 years in the Netherlands (e.g.
335
Visser et al. 1998; Husby, Visser & Kruuk 2011; Reed, Jenouvrier & Visser 2013; Chevin,
336
Visser & Tufto 2015) and the United Kingdom (e.g. Charmantier et al. 2008). It is informing
337
to compare the strength of the relationship between the directional selection on laying date
338
and spring temperature among studies. This relationship, termed the thermal sensitivity of
339
selection (B, Chevin, Lande & Mace 2010), has been estimated at = -5.30 days/°C for great
340
tits in Wytham Woods (UK, Vedder, Bouwhuis & Sheldon 2013) and at -5.01 days/°C for the
341
same species in Hoge Veluwe (Netherlands, Chevin, Visser & Tufto 2015). Considering our
342
estimate of the interaction term between maximum April temperatures and laying date
(=-343
0.024 ± 0.013, Table 1), we expect a thermal sensitivity B = -9.6 days/°C in the present
344
Mediterranean blue tit population. This discrepancy between our and previous estimates may
345
have several origins, such as the time period considered for the temperature measure and/or
346
the warming intensity (Phillimore et al. 2016). Indeed, previous work investigated the thermal
347
sensitivity during a period that was preliminary identified to be the best predictor of the laying
348
date using a sliding-window analysis (Bailey & van de Pol 2016a). Moreover, the only
349
estimation of B for blue tits in the literature (Phillimore et al. 2016) revealed a disparity by a
350
factor of three between latitude (Blat) and longitude (Blong) thermal sensitivity (Blat = -3.84
351
days/°C and Blong = -9.34 days/°C, see Table S2 in Phillimore et al. 2016). Note also that
352
Phillimore et al. (2016) found no disparity between Blat and Blong estimates for great tits,
353
which could suggest a species-dependent thermal sensitivity. Since the period, as well as the
354
type of measure (minimum, maximum or average temperature), varies systematically among
355
studies, it greatly limits the quantitative comparison in selection sensitivity.
356
Even within a single species, life history responses to temperature variation is known to differ
357
among populations (Husby et al. 2010). Since the Mediterranean area is considered a hotspot
358
of climate disruption (Giorgi 2006), similar studies on the force of natural selection across the
blue tit distribution range would provide crucial comparative insights. Up to now, the
360
selective influence of climatic warming has rarely been showed in the wild, with some
361
previous studies showing an increase in the strength of natural selection in plants with
362
climatic warming (e.g. Domínguez & Dirzo 1995; Maad & Alexandersson 2004; Anderson et
363
al. 2012), while others showed a decrease, mainly in animals (McAdam & Boutin 2003;
364
Karell et al. 2011; Campbell & Powers 2015). Moreover, estimating the drivers of selection
365
remains challenging because of several interactions and covariances between potential drivers
366
and traits shaping the causal paths to selection. Our current approach based on multi-model
367
inference (Grueber et al. 2011) proved to be powerful to disentangle the different months and
368
modes of temperature that are related to the strength of selection.
369
Rather than analyzing a general relationship between selective forces and temperature, we
370
explored temporal changes in a variety of temperature modes and seasonality, which could
371
affect spring phenology in several ways. By showing a warming close to zero in winter, our
372
study confirms results obtained in previous studies in Switzerland (Rebetez & Reinhard
373
2008), UK (Prior & Perry 2014) and southern France (Chaouche et al. 2010). Trends in
374
temperatures during the blue tit breeding season (around 0.6°C per decade from March to
375
June) were similar to trends found previously for the same region during the same period
376
(+0.7°C per decade) (Chaouche et al. 2010). Such temperature warming in spring and summer
377
provides scope for potentially important mismatches across tropic levels (Harrington,
378
Woiwod & Sparks 1999).
379
Although this is not a causal relationship, April maximum temperatures were the main
380
variable impacting the strength of selection on laying date. The causal path behind this
381
relationship is certainly linked to the date of emergence of the main food resource of blue tit
382
nestlings (i.e. the caterpillars). Indeed, because the caterpillars hatching is tracking April
383
temperatures (through the bud burst oaks), blue tits are desynchronised with their main food
resource, and selection for early laying is occurring in a warming context. Such mistiming has
385
been shown in great tits in the UK (Charmantier et al. 2008) and the Netherlands (Chevin,
386
Visser & Tufto 2015), where birds could not track the advancement in caterpillar emergence
387
date. Moreover, spring warming could also decrease the caterpillar biomass by disrupting the
388
synchrony between tree and caterpillar phenology, as shown in European oaks (Quercus
389
robur, Visser & Holleman 2001) and in Sitka spruces (Picea sitchensis, Dewar & Watt 1992).
390
In this context, it would be relevant to explore the effect of warming seasonality on the
391
caterpillar emergence date and its relationship with selection for early breeding in blue tits.
392
Unfortunately, only 10 years of data on caterpillar biomass were available in this study site,
393
preventing us from conducting such a long-term analysis.
394
Maximum April temperatures anomalies increased significantly since 1970 in the forest of La
395
Rouvière (slope = 0.056 ± 0.012, P < 0.001), yet we did not detect any significant pattern in
396
selection gradients across years since 1991 (Fig. 2). This discrepancy is due to the fact that
397
spring temperatures, while getting warmer, did not significantly increase during the
1991-398
2015 period (slope = 0.051 ± 0.035, P = 0.16), arguably due to a smaller sample size for this
399
period (n = 24 versus 45 years). If the warming mechanism involved until now remains stable
400
over time, average maximum April temperature anomalies, compared to the 1970-2000
401
period, are predicted to reach +3°C in 2050 (predictions extracted from an autoregressive
402
integrated moving average model conducted on the 1970-2015 period, see Fig S4). Such
403
spring warming might reinforce the strength of selection acting on laying date by 139% (a
404
multiplication by almost 2.5), meaning that differences in fledging success between blue tits
405
will keep increasing depending on their laying dates. However, these results must be
406
considered with caution because the population should theoretically respond by advancing its
407
breeding timing (a heritable trait in this population, h²= 0.11 Delahaie et al. 2017). Moreover,
408
mean laying date is expected to advance only if the causal factor (the caterpillar peak)
modulating selection pressure remains associated with spring warming (Charmantier &
410
Gienapp, 2014). Indeed, a desynchronization between the caterpillar peak and the anomalies
411
in spring temperature could modify the evolutionary trajectory of the population, making
412
future predictions challenging.
413
Several processes other than warming could influence the strength of selection on the timing
414
of reproduction of blue tits and shape its evolutionary trajectory. For instance, the selection
415
gradient acting on laying date was lower under higher annual predation rate in our study site
416
(see Table 1). Although the difference in mean absolute fitness was non-significant between
417
high and low predation years (F = 2.87, P = 0.09), the variance in relative fitness was
418
significantly (F = 1.70, P < 0.001) lower in high predation (=0.064) than in low predation
419
years (=0.109), which could potentially explain the reduction in the magnitude of selection in
420
high predation years. This result, however, is only based on four years of high predation rates
421
and thus needs to be confirmed and refined by a longer term study of predation and selection
422
in order to refine the biologically interpretation of this relationship. Additionally, while
423
climate warming is mainly characterized by an increase in mean temperature, an increase in
424
climate variability among years is also observed and predicted in the future (Coumou &
425
Rahmstorf 2012), especially in the Mediterranean area (Giorgi & Lionello 2008). Hence, an
426
increase in the variability of selection regimes among years could occur in the future, and
427
could shape the adaptive response to warming. For instance, Kingsolver and Buckley (2003)
428
found that the predicted evolutionary response to mean climate warming is small in an alpine
429
butterfly (Colias meadii) studied since 1980, mainly because of the variability in selection.
430
While climatic variability is increasing along with warming, the impact of this variability on
431
evolutionary response will be difficult to predict, especially in term of extreme climatic events
432
(Bailey & van de Pol 2016b). For instance, a previous study in the same population showed
433
that when 10% of broods experienced an extremely hot day, selection for earlier breeding
increased by 39% (Marrot, Garant & Charmantier 2017). In addition, besides global warming,
435
climate change is also characterized by changes in precipitation regimes. Indeed, heavy
436
rainfalls are expected to be more frequent (Giorgi & Lionello 2008), which could impact the
437
amount of caterpillar available for tits during the breeding season. We did not explore the
438
influence of monthly precipitations on selection because no change in precipitation regime
439
was detected in our study site since 1975 (unpubl. data). Another possible limitation of our
440
study is the fact that selection was investigated using fledging success as a fitness proxy.
441
Although laying date mainly affects the number of fledglings (Perrins 1970), climate warming
442
could also influence the selection acting on nestling survival until recruitment and/or adult
443
survival (Grosbois et al. 2006). However, nestling recruitment is linked to winter survival and
444
although the investigation of the effect of winter climate on number of recruits and selection
445
would be interesting, this would require to take into account 36 additional climatic variables
446
in our models (three climatic variables per month), leading to challenging interpretation of
447
results. Moreover, although number of recruits is more closely related to the true fitness than
448
fledging success is, the number of fledglings is more tightly linked with adult reproductive
449
performance than number of recruits (which depends more on the offspring phenotypes).
450
To conclude, this study reveals that climate warming induces an increase in selection pressure
451
during reproduction for a blue tit population in the Mediterranean region. This finding implies
452
that recent climate change results in strong selection favouring specific phenotypes (e.g.
453
earlier laying dates). This means that over and above the common phenological plasticity
454
observed (Charmantier & Gienapp 2014), natural selection could allow populations to cope
455
with global warming, if the lag between the increase in selection strength and the evolutionary
456
response remains short (Hendry & Gonzalez 2008). While increasing natural selection under
457
climate change could be a route for populations to adapt to climate change, it could also be an
indicator of increased extinction risk since it suggests that part of the population has reduced 459 fitness (Bell 2013). 460 461 Acknowledgements 462
We thank Samuel Caro, Jarrod Hadfield, Ben Sheldon and an anonymous reviewer for useful
463
comments on previous versions of this manuscript. We are very grateful to Fanie Pelletier,
464
Mark Vellend, Hélène Fréville and Céline Teplitsky for useful discussions. We thank Cyril
465
Bernard and the Forecast team at the CEFE for providing climatic data. We thank everyone
466
who helped maintain the study site and conduct the blue tit monitoring since 1991, in
467
particular Philippe Perret, Marcel Lambrechts, Arnaud Grégoire and Claire Doutrelant. This
468
project was funded by the Agence Nationale de la Recherche (BioAdapt grant
ANR-12-469
ADAP-0006-02-PEPS to A.C.), the European Research Council (Starting grant
ERC-2013-470
StG-337365-SHE to A.C.), the OSU-OREME, and the Natural Sciences and Engineering
471
Research Council of Canada (NSERC discovery grant to D.G.).
472
474
REFERENCES:
475
Ahola, M.P., Laaksonen, T., Eeva, T. & Lehikoinen, E. (2011) Selection on laying date is connected to 476
breeding density in the pied flycatcher. Oecologia, 168, 703-710. 477
Anderson, J.T., Inouye, D.W., McKinney, A.M., Colautti, R.I. & Mitchell-Olds, T. (2012) Phenotypic 478
plasticity and adaptive evolution contribute to advancing flowering phenology in response to 479
climate change. Proceedings of the Royal Society B: Biological Sciences, 279, 3843-3852. 480
Bailey, L.D. & van de Pol, M. (2016a) climwin: An R Toolbox for Climate Window Analysis. PLoS ONE, 481
11, e0167980. 482
Bailey, L.D. & van de Pol, M. (2016b) Tackling extremes: challenges for ecological and evolutionary 483
research on extreme climatic events. Journal of Animal Ecology, 85, 85-96. 484
Bates, D., Mächler, M., Bolker, B. & Walker, S. (2015) Fitting Linear Mixed-Effects Models Using lme4. 485
2015, 67, 48.
486
Bell, G. (2013) Evolutionary rescue and the limits of adaptation. Philosophical Transactions of the 487
Royal Society B: Biological Sciences, 368, 20120080.
488
Blondel, J., Donald, W., Thomas., Charmantier, A., Perret, P., Bourgault, P. & Lambrechts, M.M. 489
(2006) A thirty-year study of phenotypic and genetic variation of blue tits in mediterranean 490
habitat mosaics. BioScience, 56, 661-673. 491
Burnham, K., Anderson, D. & Huyvaert, K. (2011) AIC model selection and multimodel inference in 492
behavioral ecology: some background, observations, and comparisons. Behavioral Ecology 493
and Sociobiology, 65, 23-35.
494
Campbell, D.R. & Powers, J.M. (2015) Natural selection on floral morphology can be influenced by 495
climate. Proceedings of the Royal Society of London B: Biological Sciences, 282, 1-7. 496
Chaouche, K., Neppel, L., Dieulin, C., Pujol, N., Ladouche, B., Martin, E., Salas, D. & Caballero, Y. 497
(2010) Analyses of precipitation, temperature and evapotranspiration in a French 498
Mediterranean region in the context of climate change. Comptes Rendus Geoscience, 342, 499
234-243. 500
Charmantier, A., Doutrelant, C., Dubuc-Messier, G., Fargevieille, A. & Szulkin, M. (2016) 501
Mediterranean blue tits as a case study of local adaptation. Evolutionary Applications, 9, 135-502
152. 503
Charmantier, A. & Gienapp, P. (2014) Climate change and timing of avian breeding and migration: 504
evolutionary versus plastic changes. Evolutionary Applications, 7, 15-28. 505
Charmantier, A., McCleery, R.H., Cole, L.R., Perrins, C., Kruuk, L.E.B. & Sheldon, B.C. (2008) Adaptive 506
Phenotypic Plasticity in Response to Climate Change in a Wild Bird Population. Science, 320, 507
800-803. 508
Chen, I.C., Hill, J.K., Ohlemuller, R., Roy, D.B. & Thomas, C.D. (2011) Rapid Range Shifts of Species 509
Associated with High Levels of Climate Warming. Science, 333, 1024-1026. 510
Chevin, L.-M., Lande, R. & Mace, G.M. (2010) Adaptation, Plasticity, and Extinction in a Changing 511
Environment: Towards a Predictive Theory. PLoS Biology, 8, e1000357. 512
Chevin, L.-M., Visser, M.E. & Tufto, J. (2015) Estimating the variation, autocorrelation, and 513
environmental sensitivity of phenotypic selection. Evolution, 69, 2319-2332. 514
Coumou, D. & Rahmstorf, S. (2012) A decade of weather extremes. Nature Climate Change, 2, 491-515
496. 516
Crick, H.Q.P. (2004) The impact of climate change on birds. Ibis, 146, 48-56. 517
Delahaie, B., Charmantier, A., Chantepie, S., Garant, D., Porlier, M. & Teplitsky, C. (2017) Conserved 518
G-matrices of morphological and life-history traits among continental and island blue tit 519
populations. Heredity, 119, 76-87. 520
Dewar, R.C. & Watt, A.D. (1992) Predicted changes in the synchrony of larval emergence and 521
budburst under climatic warming. Oecologia, 89, 557-559. 522
Domínguez, C.A. & Dirzo, R. (1995) Rainfall and flowering synchrony in a tropical shrub: Variable 523
selection on the flowering time ofErythroxylum havanense. Evolutionary Ecology, 9, 204-216. 524
Freckleton, R.P., Cooper, N. & Jetz, W. (2011) Comparative Methods as a Statistical Fix: The Dangers 525
of Ignoring an Evolutionary Model. The American Naturalist, 178, E10-E17. 526
Fu, Y.H., Campioli, M., Deckmyn, G. & Janssens, I.A. (2012) The Impact of Winter and Spring 527
Temperatures on Temperate Tree Budburst Dates: Results from an Experimental Climate 528
Manipulation. PLoS ONE, 7, e47324. 529
Gienapp, P., Lof, M., Reed, T.E., McNamara, J., Verhulst, S. & Visser, M.E. (2013) Predicting 530
demographically sustainable rates of adaptation: can great tit breeding time keep pace with 531
climate change? Philosophical Transactions of the Royal Society B: Biological Sciences, 368, 532
20120289. 533
Gienapp, P., Reed, T.E. & Visser, M.E. (2014) Why climate change will invariably alter selection 534
pressures on phenology. Proceedings of the Royal Society B: Biological Sciences, 281, 535
20141611. 536
Gienapp, P., Teplitsky, C., Alho, J.S., Mills, J.A. & Merilä, J. (2008) Climate change and evolution: 537
disentangling environmental and genetic responses. Molecular Ecology, 17, 167-178. 538
Giorgi, F. (2006) Climate change hot-spots. Geophysical Research Letters, 33. 539
Giorgi, F. & Lionello, P. (2008) Climate change projections for the Mediterranean region. Global and 540
Planetary Change, 63, 90-104.
541
Grosbois, V., Henry, P.-Y., Blondel, J., Perret, P., Lebreton, J.-D., Thomas, D.W. & Lambrechts, M.M. 542
(2006) Climate impacts on Mediterranean blue tit survival: an investigation across seasons 543
and spatial scales. Global Change Biology, 12, 2235-2249. 544
Grueber, C.E., Nakagawa, S., Laws, R.J. & Jamieson, I.G. (2011) Multimodel inference in ecology and 545
evolution: challenges and solutions. Journal of Evolutionary Biology, 24, 699-711. 546
Harrington, R., Woiwod, I. & Sparks, T. (1999) Climate change and trophic interactions. Trends in 547
Ecology & Evolution, 14, 146-150.
548
Hendry, A.P. & Gonzalez, A. (2008) Whither adaptation? Biology & Philosophy, 23, 673-699. 549
Hoffmann, A.A. & Sgro, C.M. (2011) Climate change and evolutionary adaptation. Nature, 470, 479-550
485. 551
Husby, A., Nussey, D.H., Visser, M.E., Wilson, A.J., Sheldon, B.C. & Kruuk, L.E.B. (2010) Contrasting 552
Patterns of Phenotypic Plasticity in Reproductive Traits in Two Great Tit (Parus Major) 553
Populations. Evolution, 64, 2221-2237. 554
Husby, A., Visser, M.E. & Kruuk, L.E.B. (2011) Speeding Up Microevolution: The Effects of Increasing 555
Temperature on Selection and Genetic Variance in a Wild Bird Population. PLoS Biology, 9, 556
e1000585. 557
Karell, P., Ahola, K., Karstinen, T., Valkama, J. & Brommer, J.E. (2011) Climate change drives 558
microevolution in a wild bird. Nature Communications, 2, 208. 559
Kingsolver, J.G. & Buckley, L.B. (2015) Climate variability slows evolutionary responses of Colias 560
butterflies to recent climate change. Proceedings of the Royal Society B: Biological Sciences, 561
282, 20142470. 562
Kuznetsova, A., Brockhoff, P.B. & Christensen, R.H.B. (2015) Package ‘lmerTest’. R package version, 2. 563
Lande, R. & Arnold, S.J. (1983) The Measurement of Selection on Correlated Characters. Evolution, 564
37, 1210-1226. 565
Maad, J. & Alexandersson, R. (2004) Variable selection in Platanthera bifolia (Orchidaceae): 566
phenotypic selection differed between sex functions in a drought year. Journal of 567
Evolutionary Biology, 17, 642-650.
568
MacColl, A.D.C. (2011) The ecological causes of evolution. Trends in Ecology & Evolution, 26, 514-522. 569
Marrot, P., Garant, D. & Charmantier, A. (2017) Multiple extreme climatic events strengthen 570
selection for earlier breeding in a wild passerine. Philosophical Transactions of the Royal 571
Society B: Biological Sciences, 372, 20160372.
McAdam, A.G. & Boutin, S. (2003) Variation in viability selection among cohorts of juvenile red 573
quirrels (Tamiasciurus hudsonicus). Evolution, 57, 1689-1697. 574
Merilä, J. (2012) Evolution in response to climate change: In pursuit of the missing evidence. 575
BioEssays, 34, 811-818.
576
Merilä, J. & Hendry, A.P. (2014) Climate change, adaptation, and phenotypic plasticity: the problem 577
and the evidence. Evolutionary Applications, 7, 1-14. 578
Moritz, C., Patton, J.L., Conroy, C.J., Parra, J.L., White, G.C. & Beissinger, S.R. (2008) Impact of a 579
Century of Climate Change on Small-Mammal Communities in Yosemite National Park, USA. 580
Science, 322, 261-264.
581
Morrissey, M.B. & Hadfield, J.D. (2012) Directional Selection in Temporally Replicated Studies Is 582
Remarkably Consistent. Evolution, 66, 435-442. 583
Nussey, D.H., Postma, E., Gienapp, P. & Visser, M.E. (2005) Selection on Heritable Phenotypic 584
Plasticity in a Wild Bird Population. Science, 310, 304-306. 585
Parmesan, C. & Yohe, G. (2003) A globally coherent fingerprint of climate change impacts across 586
natural systems. Nature, 421, 37-42. 587
Perrins, C. (1970) The timing of bird' breeding seasons. Ibis, 112, 242-255. 588
Perrins, C.M. & McCleery, R.H. (1989) Laying Dates and Clutch Size in the Great Tit. The Wilson 589
Bulletin, 101, 236-253.
590
Phillimore, A.B., Leech, D.I., Pearce-Higgins, J.W. & Hadfield, J.D. (2016) Passerines may be 591
sufficiently plastic to track temperature-mediated shifts in optimum lay date. Global Change 592
Biology, 22, 3259-3272.
593
Porlier, M., Charmantier, A., Bourgault, P., Perret, P., Blondel, J. & Garant, D. (2012) Variation in 594
phenotypic plasticity and selection patterns in blue tit breeding time: between- and within-595
population comparisons. Journal of Animal Ecology, 81, 1041-1051. 596
Postma, E. (2014) Four decades of estimating heritabilities in wild vertebrate populations: Improved 597
methods, more data, better estimates. Quantitative genetics in the wild (eds A. Charmantier, 598
D. Garant & L.E.B. Kruuk), pp. 16-33. Oxford University Press, Oxford. 599
Prior, M.J. & Perry, M.C. (2014) Analyses of trends in air temperature in the United Kingdom using 600
gridded data series from 1910 to 2011. International Journal of Climatology, 34, 3766-3779. 601
R Core Team (2014) R: A Language and Environment for Statistical Computing. R Foundation for 602
Statistical Computing, Vienna, Austria. 603
Reale, D., McAdam, A.G., Boutin, S. & Berteaux, D. (2003) Genetic and plastic responses of a northern 604
mammal to climate change. Proceedings of the Royal Society B: Biological Sciences, 270, 591-605
596. 606
Rebetez, M. & Reinhard, M. (2008) Monthly air temperature trends in Switzerland 1901–2000 and 607
1975–2004. Theoretical and Applied Climatology, 91, 27-34. 608
Reed, T.E., Jenouvrier, S. & Visser, M.E. (2013) Phenological mismatch strongly affects individual 609
fitness but not population demography in a woodland passerine. Journal of Animal Ecology, 610
82, 131-144. 611
Svenning, J.-C. & Sandel, B. (2013) Disequilibrium vegetation dynamics under future climate change. 612
American Journal of Botany, 100, 1266-1286.
613
Symonds, M.E. & Moussalli, A. (2011) A brief guide to model selection, multimodel inference and 614
model averaging in behavioural ecology using Akaike’s information criterion. Behavioral 615
Ecology and Sociobiology, 65, 13-21.
616
Thomas, D.W., Blondel, J., Perret, P., Lambrechts, M.M. & R., S.J. (2001) Energetic and Fitness Costs 617
of Mismatching Resource Supply and Demand in Seasonally Breeding Birds. Science, 291, 618
2598-2600. 619
Van Noordwijk, A.J., McCleery, R.H. & Perrins, C.M. (1995) Selection for the Timing of Great Tit 620
Breeding in Relation to Caterpillar Growth and Temperature. Journal of Animal Ecology, 64, 621
451-458. 622
Vedder, O., Bouwhuis, S. & Sheldon, B.C. (2013) Quantitative Assessment of the Importance of 623
Phenotypic Plasticity in Adaptation to Climate Change in Wild Bird Populations. PLoS Biology, 624
11, e1001605. 625
Visser, M., Holleman, L.M. & Gienapp, P. (2006) Shifts in caterpillar biomass phenology due to 626
climate change and its impact on the breeding biology of an insectivorous bird. Oecologia, 627
147, 164-172. 628
Visser, M.E., Gienapp, P., Husby, A., Morrisey, M., de la Hera, I., Pulido, F. & Both, C. (2015) Effects of 629
Spring Temperatures on the Strength of Selection on Timing of Reproduction in a Long-630
Distance Migratory Bird. PLoS Biology, 13, e1002120. 631
Visser, M.E. & Holleman, L.J.M. (2001) Warmer springs disrupt the synchrony of oak and winter moth 632
phenology. Proceedings of the Royal Society of London B: Biological Sciences, 268, 289-294. 633
Visser, M.E., Holleman, L.J.M. & Caro, S.P. (2009) Temperature has a causal effect on avian timing of 634
reproduction. Proceedings of the Royal Society B: Biological Sciences, 276, 2323-2331. 635
Visser, M.E., Noordwijk, A.J.v., Tinbergen, J.M. & Lessells, C.M. (1998) Warmer springs lead to 636
mistimed reproduction in great tits (Parus major). Proceedings of the Royal Society of London 637 B: Biological Sciences, 265, 1867-1870. 638 639 640 641
Temperature change (in °C per decade) for daily minimum (in blue), mean (in black) and maximum (in red) monthly temperatures over the 1970-2014 period near the forest of La Rouvière, southern France.
Temporal fluctuation of standardized selection gradient on laying date across years.The red dashed line indicates the mean selection gradient over 24-years. *, ** and ***represent P-values < 0.05, < 0.01 and <
0.001 respectively. 676x381mm (72 x 72 DPI)
Annual selection gradients acting on laying date related to annual anomalies in maximum April temperatures. Error bars represent the standard deviation of each estimate. The black line represents the estimate of the interaction term between maximum April temperature anomalies and laying date extracted
from our best model during the model averaging procedure. Dashed lines represent 95% confidence intervals.
Directional selection gradients for laying date (solid lines) estimated on three datasets containing only years experiencing three different warming context: (A) 12 years experiencing anomalies in maximum April temperatures lower than 1°C (n = 530 broods); including 4 years (1994, 1998, 2000 and 2013) associated with negative temperatures anomalies, (B) 3 years experiencing anomalies in maximum April temperatures
ranging from 1°C to 2°C (n = 104 broods) and (C) 5 years experiencing anomalies in maximum April temperatures higher than 2°C (n = 288 broods). Temperatures anomalies correspond to the temperatures compared to the average temperatures over the 1970-2000 period. Years associated with a high predation rate (2001, 2006, 2009 and 2010) were removed from these datasets to avoid confounding their effect with
the climatic signal (see Table 1). Dashed lines represent 95% CIs. The mean annual standard deviation of laying date was 7.6 days in our population.
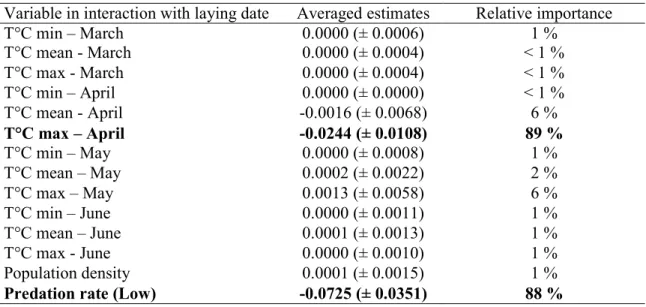
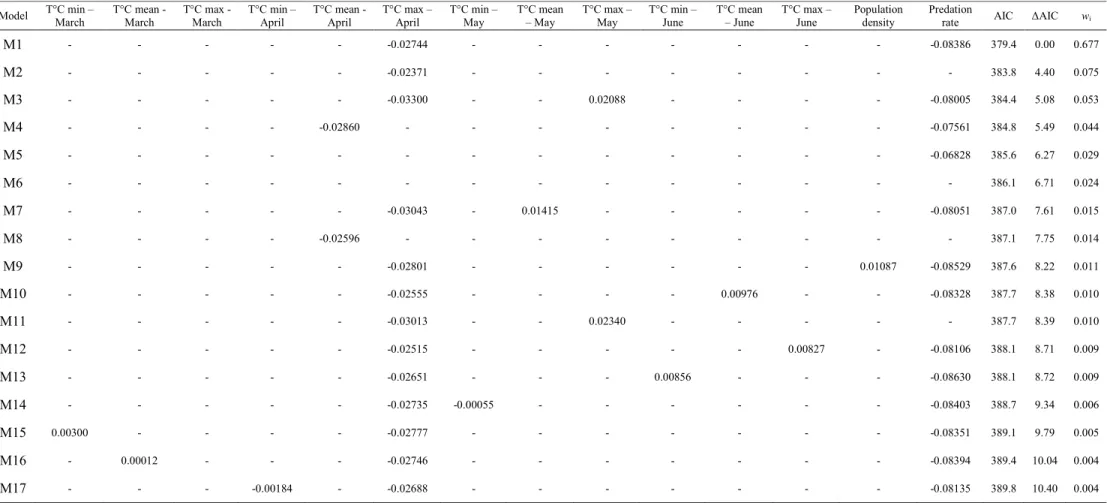
Table 1: Summary results of the model averaging approach to assess climatic variables driving selection on laying date.
Variable in interaction with laying date Averaged estimates Relative importance
T°C min – March 0.0000 (± 0.0006) 1 % T°C mean - March 0.0000 (± 0.0004) < 1 % T°C max - March 0.0000 (± 0.0004) < 1 % T°C min – April 0.0000 (± 0.0000) < 1 % T°C mean - April -0.0016 (± 0.0068) 6 % T°C max – April -0.0244 (± 0.0108) 89 % T°C min – May 0.0000 (± 0.0008) 1 % T°C mean – May 0.0002 (± 0.0022) 2 % T°C max – May 0.0013 (± 0.0058) 6 % T°C min – June 0.0000 (± 0.0011) 1 % T°C mean – June 0.0001 (± 0.0013) 1 % T°C max - June 0.0000 (± 0.0010) 1 % Population density 0.0001 (± 0.0015) 1 %
Predation rate (Low) -0.0725 (± 0.0351) 88 %
T°C min, T°C mean and T°C max represent the daily minimum, mean and maximum monthly temperatures respectively. Relative importance represents the probability that the variable was included in the best model. In bold, the only variable with a relative importance above 70%. Population density represents the annual mean distance between an occupied nest box and its closest neighbour. Predation rate was estimated as a categorical variable taking two different modalities: low and high corresponding to a predation rate below or above 0.1 respectively.
Figure S2: Distribution of relative fitness (i.e. number of fledglings) of female blue tits in La Rouvière, southern France.
Figure S3: Standardized selection gradients on laying date for anomalies in daily maximum April temperatures ranging between 0 and 3°C. Selection gradients were extracted from the best model of the model averaging approach (including an interaction between laying date and predation rate and maximum April temperature). The mean annual standard deviation of laying date was 7.6 days in our population.
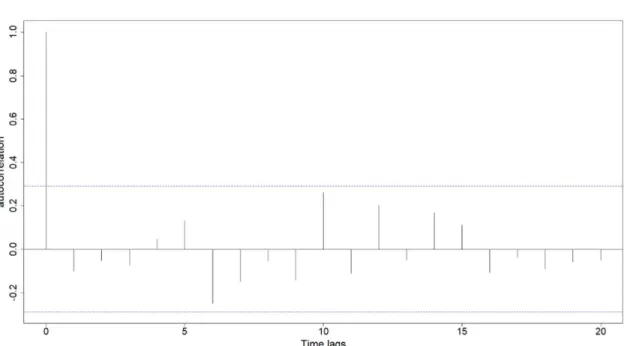
Figure S4: (A) ARIMA procedure. The graph show temporal autocorrelation in April maximum temperature. Dotted blue lines represent significance thresholds. Temperatures were autocorrelated at time lags of 3, 4 and 5 years. (B) Anomalies in daily maximum April temperatures over the 1970-2050 period compared to the 1970-2000 period. Predictions (blue line) for the 2015-2050 period were extracted from an autoregressive integrated moving average model including a temporal autocorrelation order = 4. The grey area shows the 95% confidence intervals.
B:
ARIMA procedure:
First, we tested for temporal autocorrelation in temperatures using the acf function in R. Because significant temporal autocorrelation was detected in the temperature series (based on the visualization of the correlogram), an autoregressive model structure was needed. Commonly used in temporal series analysis, autoregressive models are a special case of statistical models, allowing to take into account temporal autocorrelation at several lags, and integrating a moving average (Brockwell & Davis, 2002). Because several ARIMA are possible for a time series, we used the auto.arima function from the package forecast (Hyndman & Khandakar, 2008) in R, in order to select the best ARIMA describing temperatures changes. The best ARIMA included a degree of differencing of 1 (which allows to take into account the positive trend) and a negative autoregressive order of 4, meaning that temperatures identified as a driver of selection were negatively autocorrelated for up to four years.
Brockwell PJ, Davis RA (2002) Introduction to Time Series and Forecasting, New York, NY, Springer New York.
Hyndman RJ, Khandakar Y (2008) Automatic Time Series Forecasting: The forecast Package for R. 2008,27, 22.